Intermodal Freight Transportation Market Size and Share
Market Overview
| Study Period | 2020 - 2031 |
|---|---|
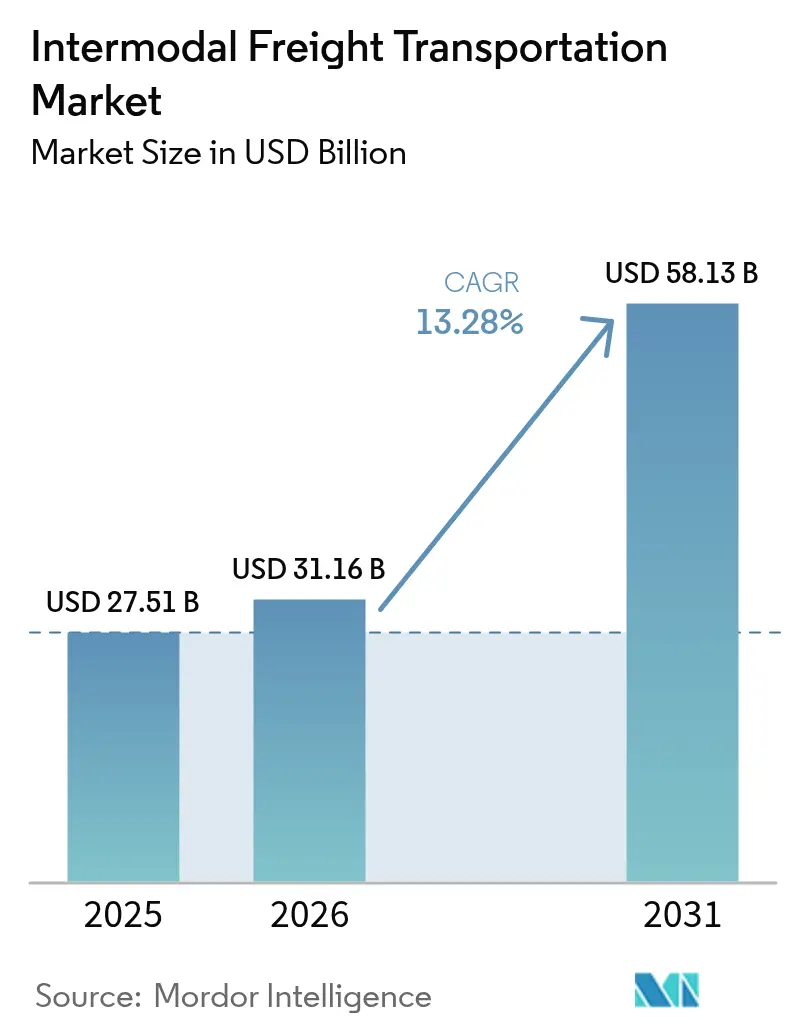
| Market Size (2026) | USD 31.16 Billion |
| Market Size (2031) | USD 58.13 Billion |
| Growth Rate (2026 - 2031) | 13.28% CAGR |
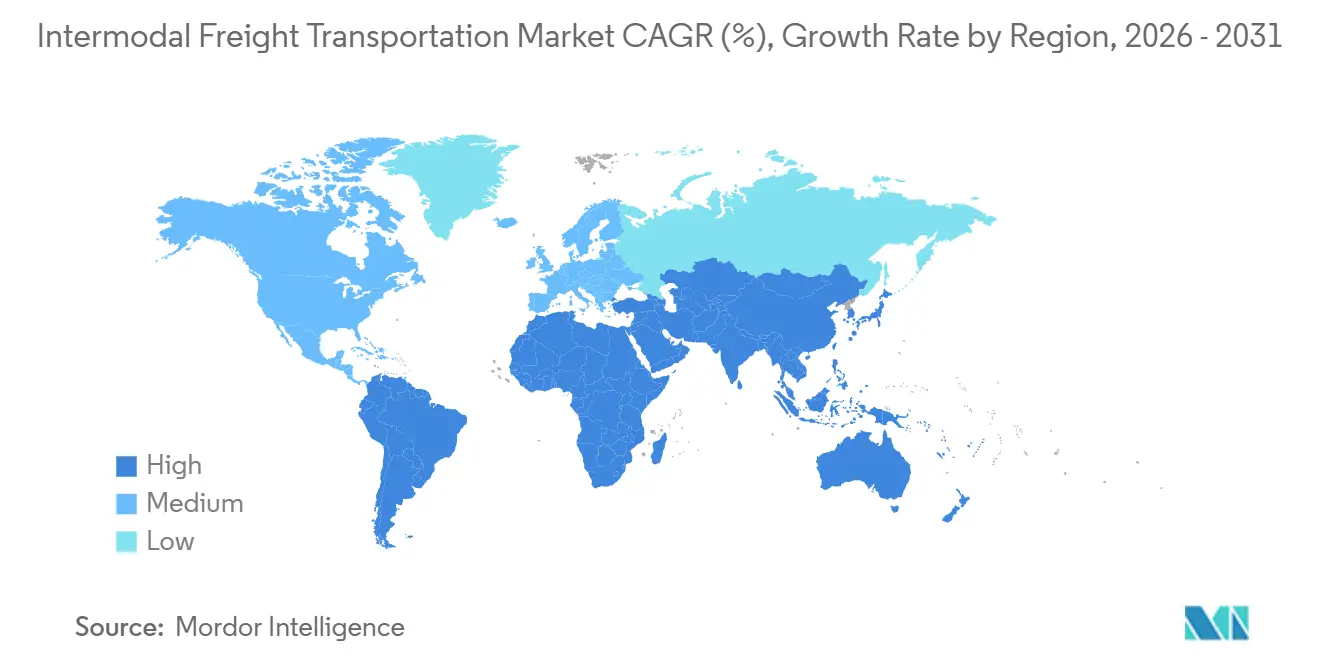
| Fastest Growing Market | Africa |
| Largest Market | Asia Pacific |
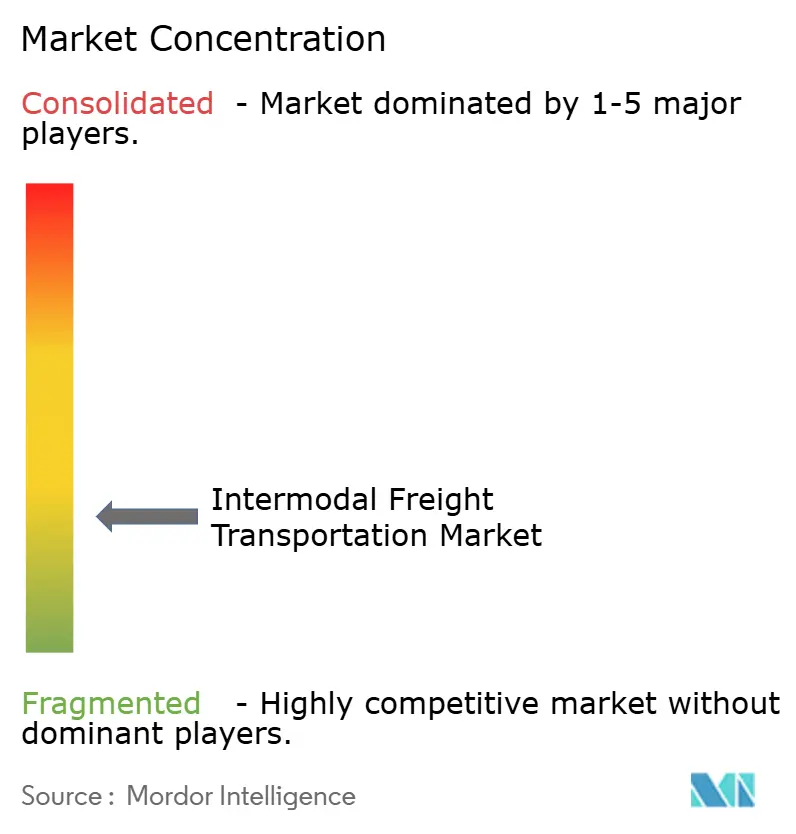
| Market Concentration | Low |
Major Players *Disclaimer: Major Players sorted in no particular order Image © Mordor Intelligence. Reuse requires attribution under CC BY 4.0. | |
Intermodal Freight Transportation Market Analysis by Mordor Intelligence
The intermodal freight transportation market size is expected to increase from USD 27.51 billion in 2025 to USD 31.16 billion in 2026 and reach USD 58.13 billion by 2031, growing at a CAGR of 13.28% over 2026-2031. Capacity aggregation across rail, road, air, and barge networks keeps line-haul prices competitive while still meeting e-commerce delivery windows. Shippers are shifting loads from pure trucking to rail-road combinations to avoid looming carbon surcharges and tighten inventory turns. Digital control-tower platforms turn once-static mode plans into dynamic routings that minimize dwell time and reduce penalty fees. At the same time, public subsidies for inland dry-port construction are widening the addressable hinterland that the intermodal freight transportation market can serve.
Key Report Takeaways
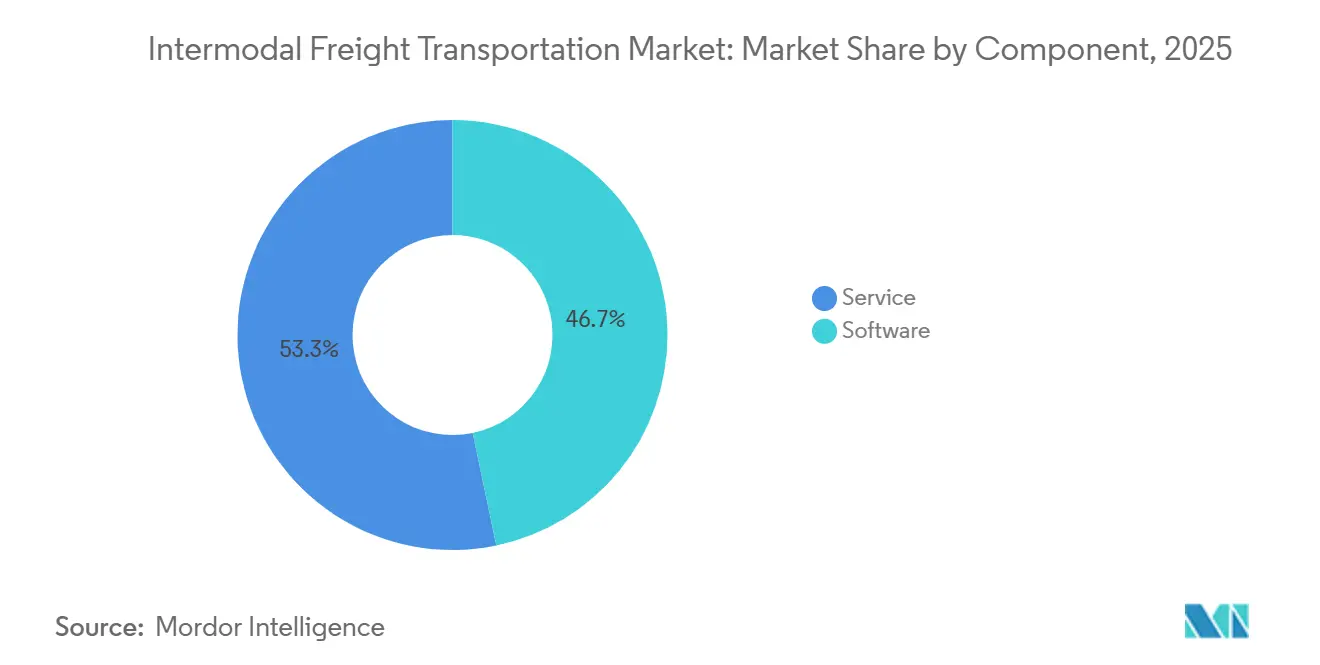
- By component, software led with 46.74% revenue share in 2025, while services are projected to expand at a 13.66% CAGR through 2031.
- By transportation mode, rail and road accounted for 47.33% of 2025 demand, whereas air and road are anticipated to post the fastest growth at a 14.07% CAGR to 2031.
- By end-user industry, consumer and retail commanded 29.56% of the intermodal freight transportation market share in 2025, while food and beverage is set to grow at a 14.43% CAGR through 2031.
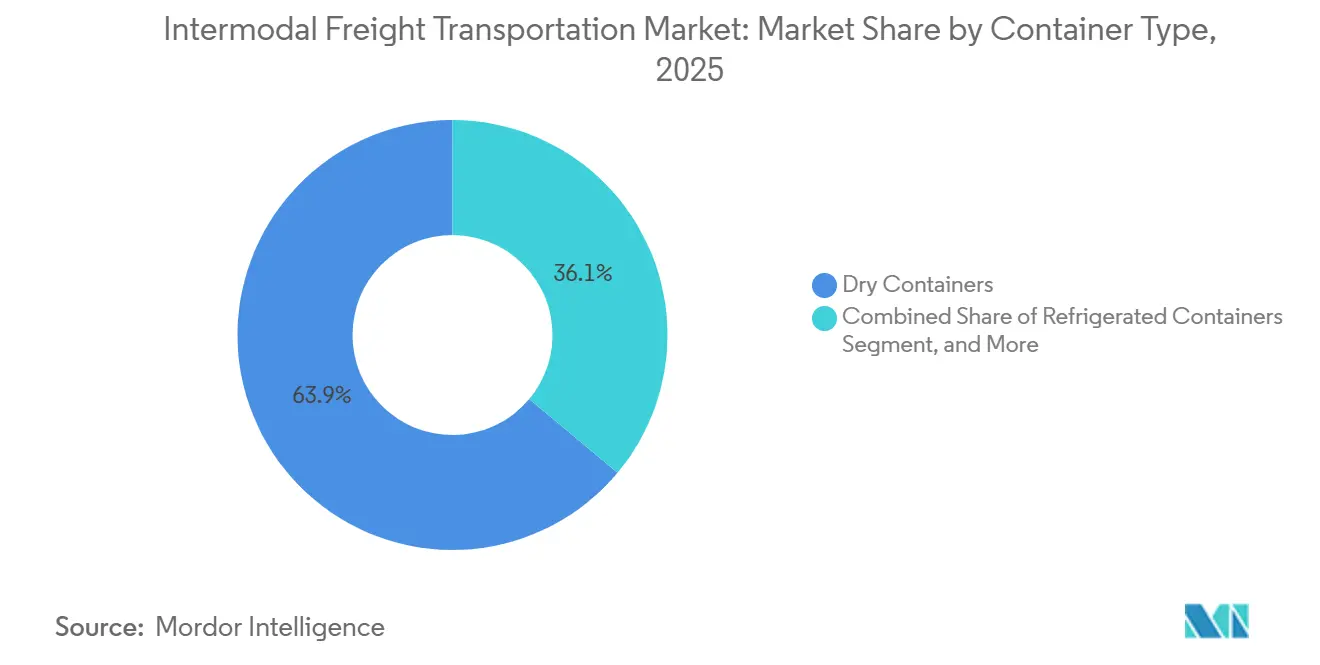
- By container type, dry boxes dominated with 63.93% of 2025 volume, and refrigerated units are forecast to advance at a 14.09% CAGR through 2031.
- By service type, transportation planning accounted for 34.78% of the intermodal freight transportation market share in 2025, while fleet-management services are on track for a 14.12% CAGR over the forecast horizon.
- By geography, Asia-Pacific captured 36.71% of 2025 revenue, whereas Africa is projected to register the fastest regional expansion at a 14.21% CAGR to 2031.
Note: Market size and forecast figures in this report are generated using Mordor Intelligence’s proprietary estimation framework, updated with the latest available data and insights as of 2026.
Global Intermodal Freight Transportation Market Trends and Insights
Drivers Impact Analysis*
| Driver | (~) % Impact on CAGR Forecast | Geographic Relevance | Impact Timeline |
|---|---|---|---|
| Digitization of global supply chains | +2.8% | Global, early North America and Europe | Medium term (2-4 years) |
| Expansion of e-commerce volumes | +3.1% | Global, Asia-Pacific and North America | Short term (≤ 2 years) |
| Shift toward decarbonized logistics | +2.5% | Europe and North America, spillover Asia-Pacific | Long term (≥ 4 years) |
| Government investment in intermodal hubs | +2.2% | Asia-Pacific, North America, Africa | Medium term (2-4 years) |
| Emergence of synchromodal booking algorithms | +1.6% | Europe and North America, pilots Asia-Pacific | Medium term (2-4 years) |
| Adoption of 53-foot domestic reefers | +1.1% | North America, nascent South America | Short term (≤ 2 years) |
| Source: Mordor Intelligence | |||
Digitization of Global Supply Chains Enhances Real-Time Visibility
Control-tower platforms aggregate GPS, RFID, and electronic logging device feeds, allowing shippers to compare rail velocity and gate queues before locking in bookings, which improves service reliability. Oracle Transportation Management Cloud and Blue Yonder Luminate now use these feeds to shift a delayed box from rail to expedited truck without human intervention, protecting high-penalty automotive and electronics flows. A 2025 Descartes survey found 81% of logistics executives view their TMS as a competitive advantage, up from 68% in 2023, confirming that software adoption is accelerating across modes.[1]Descartes Systems Group, “2025 Transportation Management Survey,” descartes.com Machine-learning forecasts of terminal congestion trigger proactive chassis deployment, cutting dwell time and boosting asset turns. As more carriers expose real-time APIs, the visibility gap between intermodal and truckload narrows, reinforcing the momentum of the modal shift.
Expansion of E-Commerce Volumes Demanding Flexible Freight Options
Online retail surpassed 20% of total sales in several major economies during 2024, fragmenting shipment profiles into small lots that favor intermodal consolidation. Maersk’s 2025 launch of 440 weekly trains, 130 barge loops, and 700 trucking partners delivers 48-hour door-to-door service across Europe, shaving 12-24 hours off prior hub-and-spoke routings.[2]Maersk, “Maersk Expands European Intermodal Network,” maersk.com Inland customs pre-clearance lets containers bypass congested seaports, speeding cross-border e-commerce flows. J.B. Hunt reported a 6% year-on-year rise in intermodal loads in Q2 2025 as retailers sought capacity unaffected by truck driver shortages. With return logistics and same-day replacements on the rise, e-commerce sellers increasingly book capacity across multiple modes in a single digital workspace.
Shift Toward Decarbonized Logistics Through Modal-Shift Incentives
Carbon-intensity caps in the European Union and California levy financial penalties on diesel-only truck lanes, nudging freight toward lower-emission rail corridors. DP World and Maersk aim to remove 700,000 t of CO₂ in the United Kingdom over five years. The EU eFTI regulation, effective 2024, mandates paperless freight documentation, trimming 2-3 hours at each border and making intermodal transport more time-competitive. China’s Ministry of Transport now subsidizes up to 30% of inland rail costs for containers that switch from highway to sea-rail service, lowering landed costs and easing urban congestion.[3]Ministry of Transport PRC, “Sea-Rail Intermodal Guidelines,” mot.gov.cn Shippers chasing ESG targets increasingly include modal-shift clauses in procurement bids, locking in railroad or barge-road volumes for multi-year terms. These incentives compound over time, expanding the carbon-adjusted cost gap in favor of the intermodal option.
Government Investments in Railroad Terminals and Dry Ports
Public capital is flowing into intermodal infrastructure at an unprecedented scale. Canada’s National Trade Corridors Fund adds USD 4.4 billion for grade separations and automated yards that could raise throughput by up to 30%. India’s fully operational Dedicated Freight Corridors cut the Delhi-Mumbai rail transit time from 4 to 5 days to under 20 hours, a game-changer for export-oriented manufacturers. In East Africa, TradeMark East Africa reduced wait times at the Mombasa-Kampala border to below 8 hours, unlocking new inland markets for containerized imports and agricultural exports. Oregon’s Port of Coos Bay won USD 100 million in 2024 to dredge a channel and build a Panamax-ready intermodal terminal, diverting cargo from chronically congested West Coast gateways. Such projects extend the reach of railroad networks into new hinterlands, broadening the revenue base for intermodal operators.
Restraints Impact Analysis*
| Restraint | (~) % Impact on CAGR Forecast | Geographic Relevance | Impact Timeline |
|---|---|---|---|
| Port congestion and chassis shortages | -2.3% | North America and Europe, episodic Asia-Pacific | Short term (≤ 2 years) |
| Fragmented data standards | -1.8% | Global, acute Asia-Pacific and South America | Medium term (2-4 years) |
| Limited interoperability of reefer networks | -0.9% | Global, concentrated emerging markets | Medium term (2-4 years) |
| Rising insurance premiums | -0.7% | Global, high-theft corridors | Short term (≤ 2 years) |
| Source: Mordor Intelligence | |||
Port Congestion and Chassis Shortages Escalating Turn-Round Times
Average container dwell time at Los Angeles hit 5.2 days in late 2024, as chassis shortages delayed pickups even after customs clearance. Beneficial cargo owners pay per-diem fees above USD 150 per box per day, quickly eroding the 10-15% cost edge intermodal usually holds over truckload moves. The Intermodal Association of North America named chassis imbalance the industry’s top operational constraint for 2025, as leasing firms were unable to build units fast enough to keep up with import surges. Savannah’s gate-appointment system eased gridlock only marginally as peak truck waits still exceeded 90 minutes, prompting retailers to reroute via Gulf ports. Persistent congestion keeps service reliability volatile, discouraging some shippers from making larger modal shifts to railroad combinations.
Fragmented Data Standards Limit System Interoperability
Lack of uniform EDI protocols forces shippers to reconcile container events across multiple portals, adding four to six hours of manual work to many loads. Timestamp formats and geolocation accuracy vary by carrier and customs agency, undermining automated exception handling. A March 2025 Journal of Commerce survey found 60% of intermodal moves still need manual data fixes, inflating administrative overhead and delaying proactive rerouting. ISO 18186 promises standardized RFID and GPS data, but full deployment is not expected before 2027. Until global standards mature, system incompatibility will continue to sap productivity and blunt the speed advantages of digitized intermodal networks.
*Our forecasts treat driver/restraint impacts as directional, not additive. The impact forecasts reflect baseline growth, mix effects, and variable interactions.
Segment Analysis
By Component: Software Commands Today but Services Accelerate
Software captured 46.74% of the intermodal freight transportation market share in 2025, as shippers prioritized cloud-based transportation management, warehouse management, and visibility suites. Enterprises are now purchasing licenses to integrate milestones from rail, truck, barge, and air into a unified control tower, marking a significant stride in the digital transformation journey. This integration enables seamless coordination across various transportation modes, improving operational efficiency and decision-making processes.
Between 2026 and 2031, the intermodal freight transportation market is set to grow at a robust CAGR of 13.66%. This surge is largely attributed to companies increasingly outsourcing execution risks. These managed offerings, which seamlessly integrate brokerage, transloading, and compliance consulting, empower customers to transform their fixed IT expenses into flexible operating costs, all while ensuring strict adherence to service levels.


By Transportation Mode: Railroad Retains Cost Edge while Air-Road Gains Pace
In 2025, railroad moves dominated the demand landscape, capturing 47.33% of the market share. This solidified railroads as the go-to, cost-effective choice for distances exceeding 800 km, bolstered by advancements like double-stack clearances and automated terminals. Furthermore, consistent fuel surcharges and ample box capacity have firmly anchored both bulk consumer goods and industrial inputs to this mode of transport. The railroad sector continues to benefit from its ability to handle large volumes efficiently, making it a preferred choice for industries reliant on cost-effective and reliable long-distance transportation.
Forecasts predict air-road combinations will lead the pack with a robust 14.07% CAGR. This surge is largely driven by the swift pivot of high-value pharmaceuticals and electronics towards a two-day delivery commitment. The combination of express lifts and GPS-enabled drayage has significantly reduced lead times, making the premium pricing justifiable. As a result, an increasing segment of the intermodal freight transportation market is gravitating towards these speed-focused cargo owners. The growing adoption of advanced technologies and the rising demand for expedited delivery services are expected to further propel the growth of air-road combinations, particularly among industries prioritizing time-sensitive shipments.
By End-User Industry: Retail Dominates, yet Food and Beverage Surges
In 2025, consumer and retail shippers made up 29.56% of the total volume, underscoring a trend where e-commerce consolidation directs parcel flows into containerized rail lanes for regional fulfillment. This shift highlights the growing importance of railroads in supporting the e-commerce supply chain. Omnichannel merchants are increasingly relying on railroads to strategically balance inventory across distribution centers, solidifying their dominance in the intermodal freight transportation market. Additionally, the integration of rail services into omnichannel strategies is enabling merchants to optimize delivery times and reduce costs.
As cold-chain mandates become more stringent, food and beverage shipments are poised to experience a 14.43% CAGR through 2031. The growing adoption of 53-foot domestic reefers, which offer 13% more cubic capacity, is not only reducing per-pallet freight costs but also broadening the scope of the intermodal freight market that utilizes temperature-controlled equipment. This expansion is further supported by advancements in refrigeration technology and increased investments in cold-chain infrastructure, ensuring compliance with regulatory standards while meeting rising demand for perishable goods transportation.
By Container Type: Dry Boxes Lead while Reefers Climb
Dry containers provided 63.93% of 2025 equipment throughput, anchoring general merchandise, apparel, and hardware that tolerate ambient conditions. Thanks to their universal appeal, costs remain low and utilization rates stay high, solidifying their dominance in the intermodal freight transportation market across various container classes. This universality ensures seamless integration across different transportation modes, further enhancing their efficiency and cost-effectiveness.
As demand surges for end-to-end telemetry in fresh produce, seafood, and vaccines, refrigerated units are set to expand at a robust 14.09% CAGR. With IoT sensors relaying temperature, humidity, and door events every 15 minutes, proactive interventions become possible. This trend is channeling an increasing share of the intermodal freight transportation market into lucrative reefer operations. The growing adoption of these technologies is driven by the need to ensure product quality, reduce spoilage, and comply with stringent regulatory standards, particularly in the transportation of perishable goods and pharmaceuticals.

By Service Type: Planning Leads, Fleet Management Accelerates
Transportation planning accounted for 34.78% of 2025 revenue, underscoring that route optimization and load consolidation remain the strategic core of outsourced support. Shippers rely on network engineers to optimize operations by balancing costs, cutting carbon emissions, and shortening transit times across rival rail and truck corridors. These engineers analyze complex logistics networks, identify inefficiencies, and implement solutions to enhance overall supply chain performance. Their expertise ensures that shippers can meet delivery demands while maintaining sustainability and cost-effectiveness.
As GPS-equipped chassis and predictive maintenance reduce unplanned downtime, fleet-management platforms are projected to grow at a 14.12% CAGR during the forecast period. These platforms play a critical role in optimizing operations by integrating asset health with terminal slot availability on unified dashboards. This integration not only enhances utilization rates but also attracts increased revenue to this segment of the intermodal freight transportation market, highlighting its growing importance in the industry.
Geography Analysis
Asia-Pacific contributed 36.71% of 2025 turnover, cementing its position as the largest regional node in the intermodal freight transportation market. Belt and Road rail corridors and India’s Dedicated Freight Corridors shrink inland dray distances, while ASEAN’s connectivity plan chips away at border delays. Rising middle-class consumption and export diversification into Central Asia will keep the region at the forefront of new terminal builds and synchromodal pilot projects.
Africa is forecast to post a 14.21% CAGR to 2031, the fastest clip globally. TradeMark East Africa’s corridor upgrades cut Mombasa-Kampala clearance times to under 8 hours, and the AfCFTA’s single window reduces paper-driven holdups, magnifying the size of the intermodal freight transportation market available to regional 3PLs. East-West rail links such as the LAPSSET corridor open landlocked South Sudan and Ethiopia to the Indian Ocean trade, accelerating reefer demand for fresh-produce exports.
North America remains pivotal, with Class I railroads spending billions on double-stack clearances and automated terminals that elevate velocity. Europe benefits from the eFTI regulation, which streamlines digital paperwork across member states, and from Maersk’s Rhine-Danube barge loops, which relieve congestion on autobahns. South America and the Middle East trail in volume but present strategic hubs: Brazil’s soy corridors fuel reefer growth, and Jebel Ali’s electric dray trials serve as a showpiece for carbon-neutral intermodal freight transportation market deployments.

Competitive Landscape
The top five asset-based carriers and forwarders account for roughly 30-35% of global revenue, signaling a moderately fragmented intermodal freight transportation market where digital brokers can still carve out capacity niches. DSV’s USD 15.9 billion takeover of DB Schenker in 2025 created the world’s largest contract-logistics platform, aligning warehouse scale with synchromodal reach. DP World deploys electric yard tractors at Jebel Ali, and Maersk’s European network now bypasses hub-and-spoke dependencies, giving customers direct origin-to-destination routings.
Software vendors such as Oracle, Blue Yonder, and Descartes embed AI into mode-selection logic, automatically shifting slow-moving containers from rail to expedited truck, thereby protecting service levels and capturing more wallet share in the intermodal freight transportation market. Synchromodal startups leverage real-time capacity APIs from railways, barge lines, and drayage fleets, enabling shippers to secure bookings with truck-like ease. The EU’s FOR-FREIGHT trial proved that algorithms can trim empty repositioning by 12% and slash CO₂ by 18%, findings that embolden venture capital in the intermodal freight transportation industry.
White-space geographies such as Central Africa see new entrants specializing in cold-chain, hazardous bulk, or oversized cargo, partnering with Class I railroads rather than competing head-to-head. ISO’s forthcoming container-tracking standard could erode the proprietary moats guarding incumbents, enabling interoperability that favors nimble disruptors ready to scale as the intermodal freight transportation market matures.
Intermodal Freight Transportation Industry Leaders
Cognizant Technology Solutions Corporation
Oracle Corporation
Blue Yonder Group Inc.
Transplace LLC
Körber AG
- *Disclaimer: Major Players sorted in no particular order

Recent Industry Developments
- October 2025: Maersk expanded its European network to 440 weekly trains, 130 barge services, and 700+ trucking partners, offering 48-hour door-to-door e-commerce transit times.
- October 2025: DP World released a survey showing 80% of logistics executives use digital tools, but only 19% achieve full platform integration.
- April 2025: DSV closed its USD 15.9 billion purchase of DB Schenker, forming the largest global contract-logistics provider.
- February 2025: The Intermodal Association of North America confirmed 2024 volumes rose 8.5%, led by a 13.9% jump in international containers.


Global Intermodal Freight Transportation Market Report Scope
The Intermodal Freight Transportation Market Report is Segmented by Component (Software, and Service), Transportation Mode (Rail and Road Transport, Air and Road Transport, Maritime and Road Transport, Other Transportation Modes), End-User Industry (Industrial and Manufacturing, Oil and Gas, Consumer and Retail, Food and Beverage, Construction, Other End-User Industries), Container Type (Dry Containers, Refrigerated Containers, Tank Containers, Flat-Rack and Open-Top Containers), Service Type (Transportation Planning, Fleet Management, Warehousing and Distribution, Other Service Types), and Geography (North America, South America, Europe, Asia-Pacific, Middle East and Africa). The Market Forecasts are Provided in Terms of Value (USD).
| Software |
| Service |
| Rail and Road Transport |
| Air and Road Transport |
| Maritime and Road Transport |
| Other Transportation Modes |
| Industrial and Manufacturing |
| Oil and Gas |
| Consumer and Retail |
| Food and Beverage |
| Construction |
| Other End-User Industries |
| Dry Containers |
| Refrigerated Containers |
| Tank Containers |
| Flat-Rack and Open-Top Containers |
| Transportation Planning |
| Fleet Management |
| Warehousing and Distribution |
| Other Service Types |
| North America | United States | |
| Canada | ||
| Mexico | ||
| South America | Brazil | |
| Argentina | ||
| Rest of South America | ||
| Europe | United Kingdom | |
| Germany | ||
| France | ||
| Italy | ||
| Rest of Europe | ||
| Asia Pacific | China | |
| Japan | ||
| India | ||
| South Korea | ||
| Rest of Asia Pacific | ||
| Middle East and Africa | Middle East | United Arab Emirates |
| Saudi Arabia | ||
| Rest of Middle East | ||
| Africa | South Africa | |
| Egypt | ||
| Rest of Africa | ||
| By Component | Software | ||
| Service | |||
| By Transportation Mode | Rail and Road Transport | ||
| Air and Road Transport | |||
| Maritime and Road Transport | |||
| Other Transportation Modes | |||
| By End-User Industry | Industrial and Manufacturing | ||
| Oil and Gas | |||
| Consumer and Retail | |||
| Food and Beverage | |||
| Construction | |||
| Other End-User Industries | |||
| By Container Type | Dry Containers | ||
| Refrigerated Containers | |||
| Tank Containers | |||
| Flat-Rack and Open-Top Containers | |||
| By Service Type | Transportation Planning | ||
| Fleet Management | |||
| Warehousing and Distribution | |||
| Other Service Types | |||
| By Geography | North America | United States | |
| Canada | |||
| Mexico | |||
| South America | Brazil | ||
| Argentina | |||
| Rest of South America | |||
| Europe | United Kingdom | ||
| Germany | |||
| France | |||
| Italy | |||
| Rest of Europe | |||
| Asia Pacific | China | ||
| Japan | |||
| India | |||
| South Korea | |||
| Rest of Asia Pacific | |||
| Middle East and Africa | Middle East | United Arab Emirates | |
| Saudi Arabia | |||
| Rest of Middle East | |||
| Africa | South Africa | ||
| Egypt | |||
| Rest of Africa | |||


Key Questions Answered in the Report
How fast is revenue expected to grow in the intermodal freight transportation market between 2026 and 2031?
Revenue is projected to rise from USD 31.16 billion in 2026 to USD 58.13 billion by 2031, a 13.28% CAGR.
Which region currently generates the highest intermodal freight revenue?
Asia-Pacific led with 36.71% of global turnover in 2025 due to robust export corridors and new rail infrastructure.
What factors are driving refrigerated container adoption?
Vaccine distribution standards and fresh-produce trade require continuous temperature control, propelling reefers at a 14.09% CAGR through 2031.
Why are services outpacing software in growth?
Shippers increasingly outsource execution risk, lifting managed-service revenue at 13.66% CAGR versus slower software expansion.
What is the chief operational restraint facing North American intermodal hubs?
Chassis shortages and related port congestion extend container dwell, eroding the traditional cost advantage over long-haul trucking.
Page last updated on:


