Space Debris Monitoring And Removal Market Size and Share
Market Overview
| Study Period | 2019 - 2031 |
|---|---|
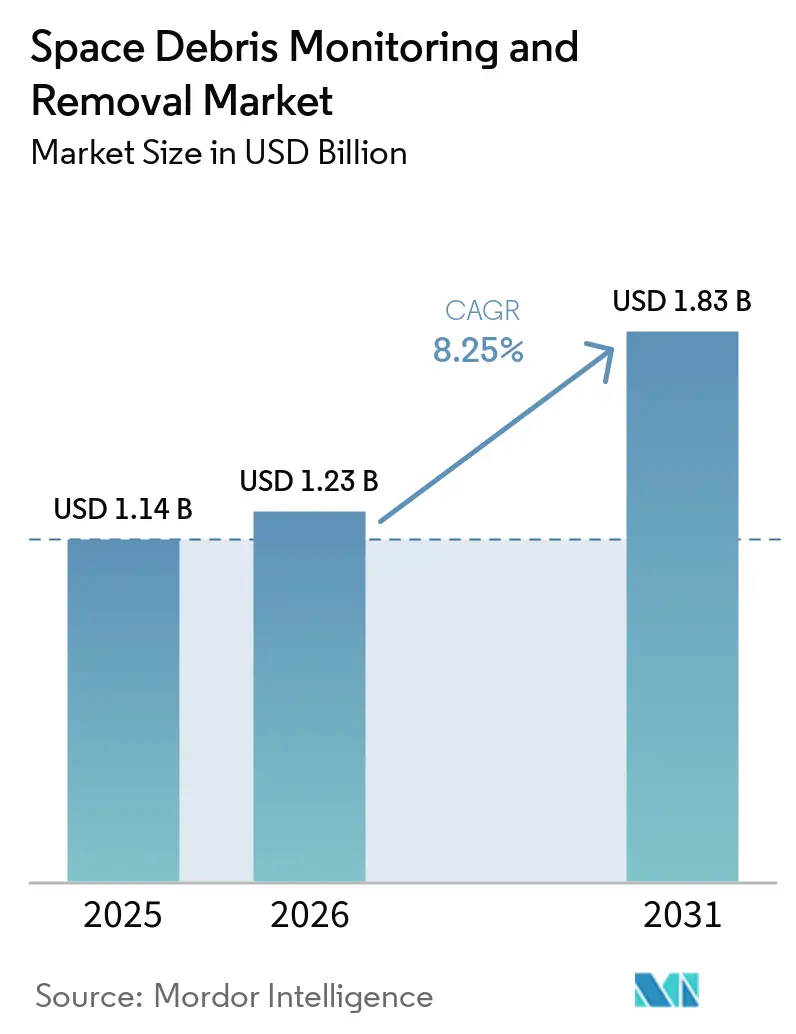
| Market Size (2026) | USD 1.23 Billion |
| Market Size (2031) | USD 1.83 Billion |
| Growth Rate (2026 - 2031) | 8.25% CAGR |
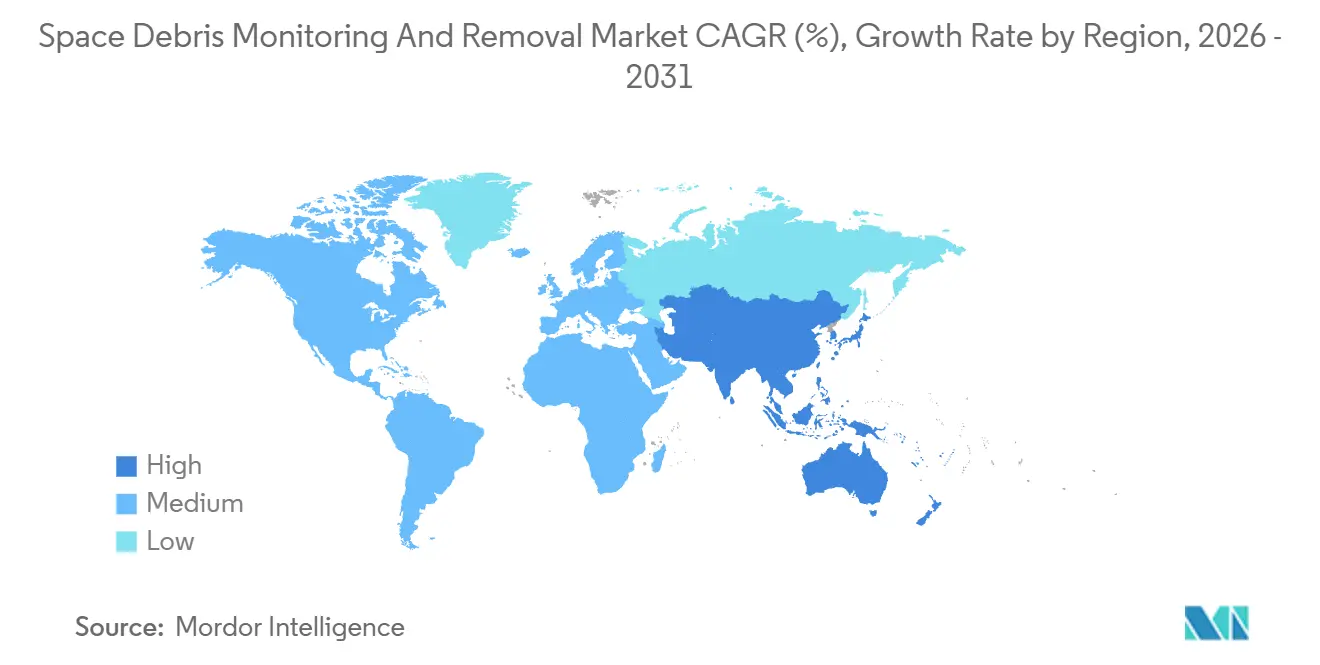
| Fastest Growing Market | Asia Pacific |
| Largest Market | North America |
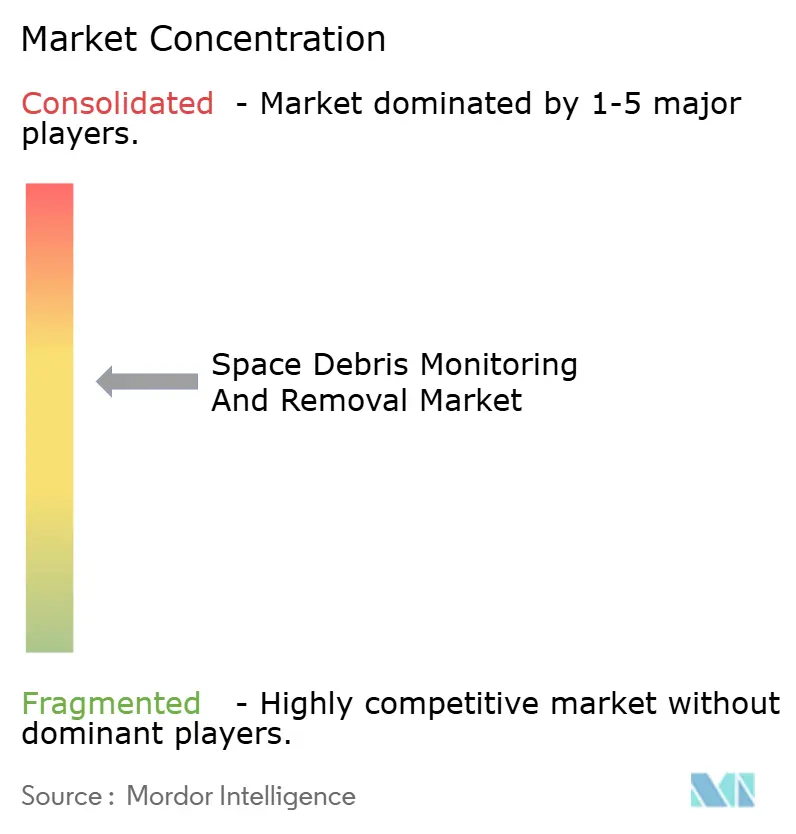
| Market Concentration | Medium |
Major Players *Disclaimer: Major Players sorted in no particular order Image © Mordor Intelligence. Reuse requires attribution under CC BY 4.0. | |
Space Debris Monitoring And Removal Market Analysis by Mordor Intelligence
The space debris monitoring and removal market size was valued at USD 1.14 billion in 2025 and estimated to grow from USD 1.23 billion in 2026 to reach USD 1.83 billion by 2031, at a CAGR of 8.25% during the forecast period. The space debris monitoring and removal market is moving beyond passive tracking, as operators now face direct costs associated with conjunction risk, end-of-life disposal, and collision response. Satellite sustainability revenue reached USD 500 million in 2025, up 43% from the prior year, indicating that orbital safety is being purchased as an operating service rather than treated solely as a compliance obligation. The FCC five-year deorbit rule and the draft EU Space Act are also pushing operators to budget for maneuverability, monitoring subscriptions, and formal avoidance support much earlier in a mission lifecycle, supporting recurring demand in the space debris monitoring and removal market for monitoring software, catalog access, and safety analytics, as these services can be deployed faster than large-scale removal missions. The lack of a binding global framework for third-party debris removal continues to slow the removal side of the space debris monitoring and removal market, even as servicing, refurbishment, and recycling programs expand the commercial path for capture and relocation technologies.
Key Report Takeaways
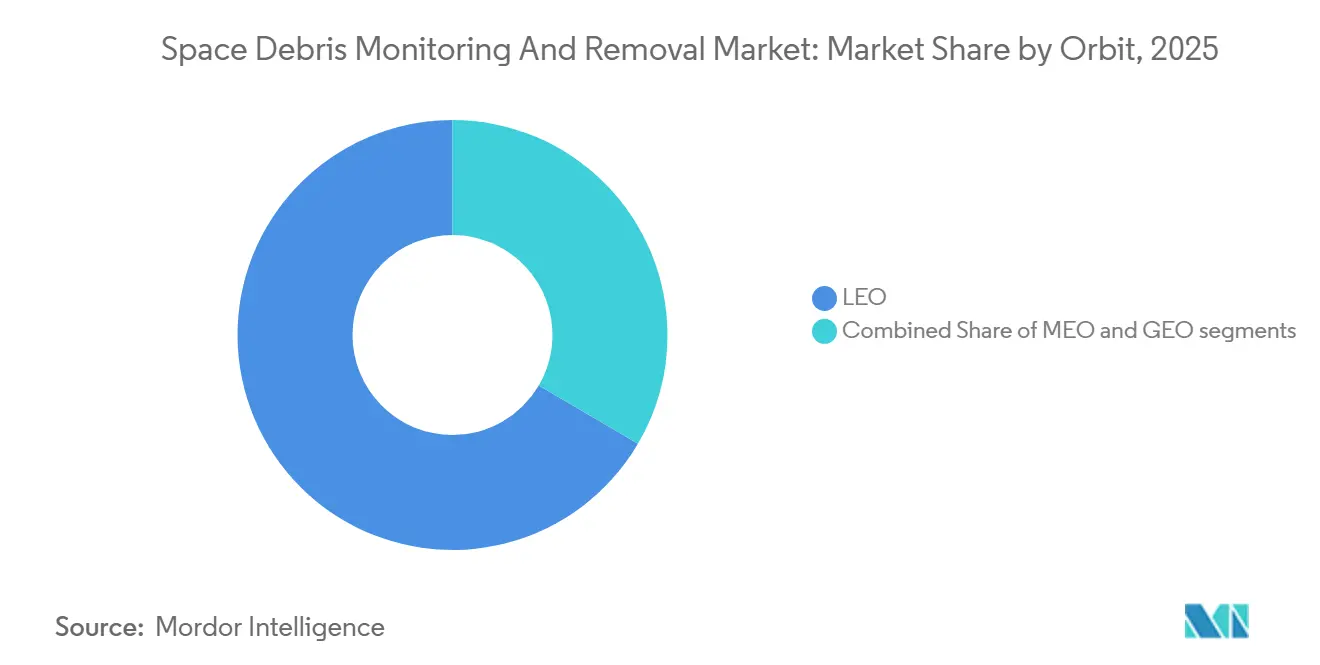
- By orbit type, LEO led with a 66.56% share in 2025, while MEO is projected to be the fastest-growing orbit segment, with a CAGR of 9.16% through 2031.
- By service type, space debris monitoring held 58.87% share in 2025, while space debris removal is projected to expand at a 9.91% CAGR through 2031.
- By removal technique, contact methods held 57.45% share in 2025, while contactless approaches are forecast to grow at a 13.32% CAGR through 2031.
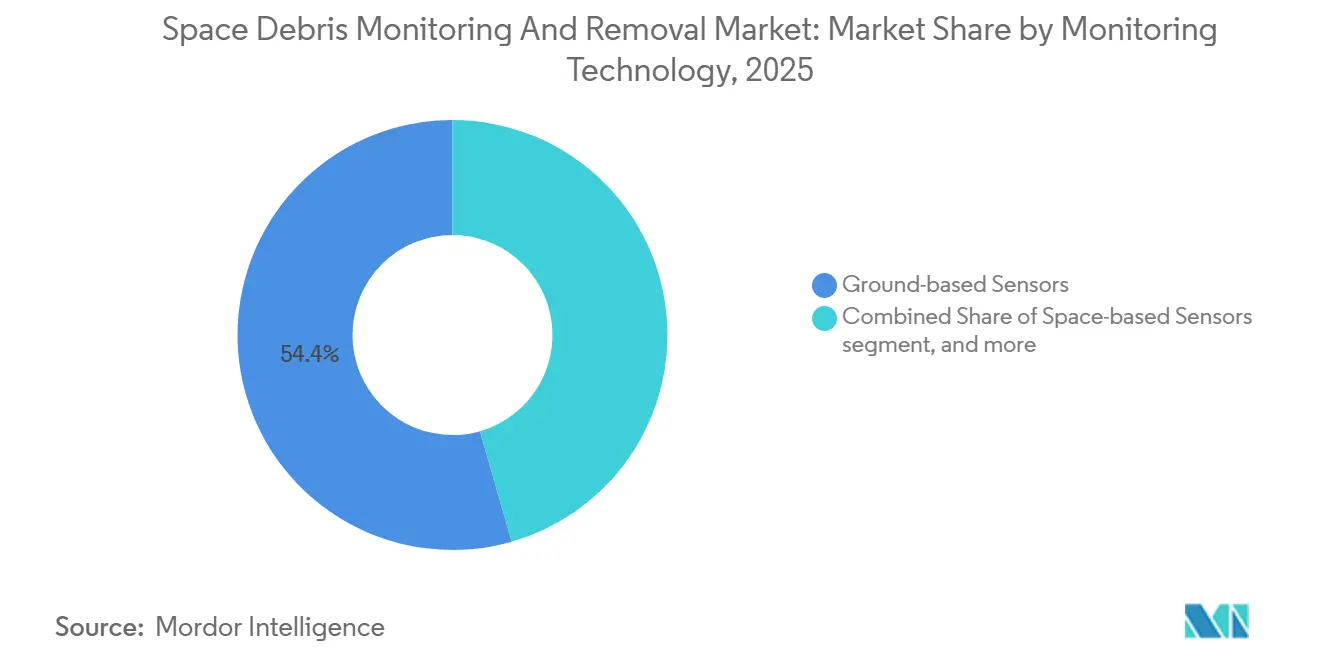
- By monitoring technology, ground-based sensors accounted for 54.44% market share in 2025, while analytics and collision-avoidance software are projected to grow at a 12.21% CAGR through 2031.
- By debris size, debris larger than 10 cm captured 41.67% share in 2025, while the 1 mm to less than 1 cm fragment segment is projected to grow at a 10.78% CAGR through 2031.
- By end user, government and defense entities held 55.54% share in 2025, while commercial satellite operators are forecast to grow at a 10.19% CAGR through 2031.
- By geography, North America held 38.87% share in 2025, while Asia-Pacific is projected to record the fastest regional growth at a 12.11% CAGR through 2031.
Note: Market size and forecast figures in this report are generated using Mordor Intelligence’s proprietary estimation framework, updated with the latest available data and insights as of January 2026.
Global Space Debris Monitoring And Removal Market Trends and Insights
Drivers Impact Analysis*
| Driver | ( ~ ) % Impact on CAGR Forecast | Geographic Relevance | Impact Timeline |
|---|---|---|---|
| Expansion of LEO satellite deployments | +2.1% | Global, concentrated in the US, China, and EU | Short term (≤ 2 years) |
| Increasing government spending on Space Situational Awareness (SSA) initiatives | +1.8% | North America and EU, with spill-over to Japan and Australia | Short term (≤ 2 years) |
| Stricter international regulations for post-mission satellite disposal | +1.5% | Global, with early gains in the US, EU, and Japan | Medium term (2-4 years) |
| Advancements in high-precision tracking technologies for small-scale debris | +1.3% | Global, with technology development in the US, UK, and Japan | Long term (≥ 4 years) |
| Growing adoption of in-orbit servicing and satellite recycling models | +1.2% | North America, Europe, and Japan | Medium term (2-4 years) |
| Rising influence of orbital debris risk on space insurance premiums | +0.9% | North America and EU | Medium term (2-4 years) |
| Source: Mordor Intelligence | |||
Expansion of Low Earth Orbit (LEO) Satellite Deployments
The space debris monitoring and removal market is under stronger pressure in LEO because launch activity is rising faster than mitigation capacity. In 2025, 4,434 satellites entered orbit, and the active satellite population reached 14,266, with the US accounting for 3,529 commercially procured payloads. Reporting tied to ESA’s 2026 space environment assessment identified 550 km as a critical altitude at which debris object density is nearing active satellite density, and collision risk in LEO rose by 20% from 2024 levels. That pattern is changing who buys services in the space debris monitoring and removal market, as constellation operators now generate much of the day-to-day demand for conjunction analysis and maneuver support. Commercial operators also buy more frequently than public agencies, so the space debris monitoring and removal market gains steadier recurring software revenue as maneuver volumes increase.
Increasing Government Spending on Space Situational Awareness (SSA) Initiatives
Government-backed SSA spending remains one of the clearest demand anchors for the space debris monitoring and removal market. LeoLabs reported more than USD 60 million in total contract awards in 2025. They said its US government contracts grew 186% year over year, supported by a September 2025 joint license involving the Office of Space Commerce and the US Space Force.[1]Victoria Heath, “LeoLabs Achieves Record Bookings in 2025 Fueled by Triple Digit Growth in U.S. Government Contracts,” LeoLabs, leolabs.space In March 2025, the company was also selected for a USD 60 million STRATFI award to deploy next-generation UHF radar in the Indo-Pacific by 2027.[2]Aaron Herbach, “LeoLabs Selected for $60M STRATFI to Deploy Its Next-Generation Radar Technology in the Indo-Pacific Region,” LeoLabs, leolabs.space France selected Thales for the Aurore radar program in October 2025. Germany moved ahead with the Indra S3TSR radar for its space command under the L-GUARD program, which shows that sovereign monitoring capacity is becoming a priority across Europe, expanding the customer base for the space debris monitoring and removal market, as governments seek to reduce reliance on shared public catalogs and build domestic monitoring capabilities in partnership with commercial providers.
Stricter International Regulations for Post-Mission Satellite Disposal
Regulation is shortening decision timelines across the space debris monitoring and removal market. The FCC’s five-year post-mission disposal rule for non-geostationary satellites became mandatory on September 29, 2024, replacing the older 25-year guideline and raising design, propellant, and compliance demands for commercial operators. The December 2025 compromise text for the EU Space Act requires maneuverability above 400 km, access to collision-avoidance services, and orbital lifetime conditions for LEO spacecraft, to be implemented through subsequent implementing acts. In the US, the Orbital Sustainability Act of 2025 authorized USD 150 million for fiscal years 2026 through 2030 for a competitive demonstration program in active debris remediation. These rules support the space debris monitoring and removal market by making safer operations measurable and enforceable. Still, they also favor better-capitalized providers that can absorb compliance costs more quickly than smaller operators.
Growing Adoption of In-Orbit Servicing and Satellite Recycling Models
In-orbit servicing is widening the commercial case for the space debris monitoring and removal market. Astroscale and BAE Systems completed a feasibility study in March 2025 for the In-orbit Refurbishment and Upgrading Service, which links debris-capture capability with future upgrade and refurbishment work.[3]Astroscale, “Astroscale and BAE Systems Lay the Foundation for a Circular Space Economy,” Astroscale, astroscale.com Northrop Grumman’s Mission Extension Vehicles had delivered nearly a decade of combined in-space service by early 2026, and the Mission Robotic Vehicle remained on track for a 2026 launch to add robotic inspection, relocation, and payload support services. A July 2025 GAO review said operators still hesitate to design spacecraft for servicing until commercial demand is proven, while servicers hesitate without a serviceable installed base. ESA’s Zero Debris technical work also called for active debris removal services in LEO and MEO as part of debris-neutral operations by 2030, which supports a longer runway for the space debris monitoring and removal market even when direct removal contracts remain limited.
Restraints Impact Analysis*
| Restraint | ( ~ ) % Impact on CAGR Forecast | Geographic Relevance | Impact Timeline |
|---|---|---|---|
| Lack of internationally binding legal framework for Active Debris Removal (ADR) | -1.4% | Global, especially constraining for cross-border removal operations | Long term (≥ 4 years) |
| High capital investment and uncertain return on investment for debris removal missions | -1.2% | Global, especially pronounced for commercially funded LEO removal missions | Medium term (2-4 years) |
| Export control and regulatory barriers on dual-use space surveillance technologies | -0.8% | North America and EU, affecting cross-border technology transfer | Medium term (2-4 years) |
| Skilled workforce shortages in orbital mechanics and space robotics fields | -0.6% | Global, concentrated in the US, Europe, and Japan | Long term (≥ 4 years) |
| Source: Mordor Intelligence | |||
Lack of Internationally Binding Legal Framework for Active Debris Removal
The legal framework for the space debris monitoring and removal market remains incomplete because ownership of space objects does not lapse when they become debris. Current space law leaves jurisdiction with the launching state, and there is no formal mechanism to declare an object abandoned for third-party removal. A 2025 ESA-linked survey found that 45% of technical experts supported adding a salvage clause for older objects and 50% supported mandatory ADR insurance, but no intergovernmental consensus followed. The UK and New Zealand presented a non-binding bilateral model in May 2025 to clarify liability sharing and consent procedures for joint ADR and servicing missions. Until broader consent frameworks emerge, the space debris monitoring and removal market will remain tilted toward monitoring services, as removal providers can pursue only a limited set of cooperative targets.
High Capital Investment and Uncertain Return on Investment for Debris Removal Missions
Mission economics still constrain the pace of the space debris monitoring and removal market. Astroscale’s ELSA-M mission received around USD 35 million from the UK Space Agency and ESA, while the company funded well over 50% of the total mission costs, implying a single-object mission cost that remains high for routine commercial procurement. JAXA’s CRD2 Phase II contract with Astroscale Japan was valued at JPY 13.2 billion (USD 82.95 million), which underlines the capital intensity of early large-scale removal attempts. There is still no standardized pricing model based on kilograms removed or orbit bands cleared, so long-term revenue planning remains difficult across the space debris monitoring and removal market. A July 2025 GAO review said private capital is unlikely to scale the needed infrastructure without clearer long-run government demand signals, which keep many providers dependent on milestone-driven public contracts.
*Our forecasts treat driver/restraint impacts as directional, not additive. The impact forecasts reflect baseline growth, mix effects, and variable interactions.
Segment Analysis
By Orbit: LEO Dominates, but MEO Gains Strategic Priority
LEO held 66.56% of the space debris monitoring and removal market share in 2025 because most active satellites and the densest operational debris environment sit below 2,000 km. The space debris monitoring and removal market in this orbit benefits from both government-funded SSA programs and commercial demand for collision avoidance support. More than 40,000 objects are cataloged globally, while ESA’s MASTER-8 model estimated around 54,000 objects larger than 10 cm and nearly 1.2 million fragments in the 1 cm to 10 cm range. That volume keeps LEO at the center of both monitoring contracts and removal mission planning because the operational consequences of a missed conjunction are immediate.
MEO will be the fastest-growing orbit segment with a CAGR of 9.16% through 2031. The UK’s 2025 COPUOS statement highlighted updated IADC guidance that includes disposal provisions for MEO spacecraft, affecting the space debris monitoring and removal market. Navigation and timing assets in MEO carry high mission value, so even limited debris growth can trigger higher compliance spending. GEO remains smaller in volume, but the economics are attractive because single-servicing missions can support high-value life-extension or relocation work. D-Orbit’s EUR 119.6 million (USD 138.69 million) contract shows that operators will fund specialized servicing capability when the payload and orbital slot values are high enough. The result is a space debris monitoring and removal market that stays centered on LEO by volume while slowly broadening into MEO and GEO, where mission economics justify targeted intervention.


By Service Type: Removal Accelerates as Mission Pipelines Mature
Space debris monitoring accounted for 58.87% of the 2025 service type demand, keeping it ahead of direct removal work in the space debris monitoring and removal market. Monitoring leads because radar networks, optical sensors, catalog services, and alert platforms can be deployed more quickly and sold as recurring subscriptions. That also gives providers lower capital exposure than removal missions, which often depend on a single launch, a narrow target set, and government-backed milestones. The monitoring side of the space debris removal industry, therefore, benefits from shorter sales cycles and steadier renewal patterns than hardware-intensive removal programs. As regulatory obligations tighten, monitoring remains the default first purchase for operators that need compliance support without taking on mission redesign.
Space debris removal is still the fastest-growing service category, with the space debris monitoring and removal market size for removal services projected to expand at a 9.91% CAGR through 2031. The shift reflects a pipeline that is finally moving from technology demonstration toward operational procurement in selected missions. Astroscale’s ADRAS-J completed 293 days of proximity operations and began deorbit in March 2026, providing the sector with a validated commercial benchmark for inspection and close approach of non-cooperative debris.[4]Astroscale, “Astroscale’s ADRAS-J Mission Completes Operations, Begins Deorbit,” Astroscale, astroscale.com The space debris monitoring and removal market is also blurring the line between removal and servicing because rendezvous, proximity operations, and docking can support debris capture, life extension, relocation, and inspection from the same platform. That overlap helps providers spread development costs across several revenue streams. It also reduces the risk that a company builds a spacecraft for only one narrow use case. Over time, the service mix in the space debris monitoring and removal market is likely to become less binary as operators buy packages that combine monitoring, mission planning, and intervention capability.
By Removal Technique: Contact Methods Lead, Contactless Gains Ground
Contact-based techniques held 57.45% of the 2025 removal technique demand because they are supported by a more mature testing and demonstration record in the space debris monitoring and removal market. Robotic arms, magnetic capture systems, and tether-like concepts have clearer mission heritage than most contactless alternatives. Northrop Grumman’s servicing history and Astroscale’s magnetic capture demonstrations helped reinforce confidence in these methods. That matters because operators and agencies still prefer technologies with visible operational proof when mission failure could create more debris. The current lead for contact methods, therefore, reflects execution confidence as much as technical preference.
Contactless techniques are projected to grow at a 13.32% CAGR through 2031, making them the fastest-growing approach in the space debris monitoring and removal market. The appeal is practical because ion beam shepherding, laser ablation, and electrostatic concepts can reduce the legal and mechanical complications that come with direct physical capture. A 2025 peer-reviewed assessment ranked tethered nets first and laser systems second on a weighted performance basis, noting their versatility across debris shapes and tumbling states. The contactless methods are well-suited for non-cooperative debris at altitudes above 700 km, where contact capture becomes more hazardous, and debris populations are expected to rise, giving contactless systems a clearer role in parts of the space debris monitoring and removal market where safety margins are tighter, and target behavior is less predictable. As that case strengthens, the balance between contact and contactless methods will depend less on concept novelty and more on who can show repeatable mission economics.
By Monitoring Technology: Analytics Software Outpaces Hardware Segments
Ground-based sensors accounted for 54.44% of monitoring technology demand in 2025 because the space debris monitoring and removal market still relies heavily on installed radar and optical infrastructure. National space commands, commercial radar operators, and EU-linked surveillance networks already have hardware in place, which lowers adoption barriers for additional data services. That installed base also makes ground systems the default backbone for routine cataloging and tracking work. Even so, these systems cannot consistently track the smallest operationally dangerous fragments, which keeps gaps in conjunction awareness. Objects smaller than 10 cm remain difficult for many ground systems, leaving a large population of 1 cm to 10 cm debris only partially visible in day-to-day operations.
Analytics and collision-avoidance software are the fastest-growing monitoring technologies, expanding at a 12.21% CAGR through 2031, reflecting a fundamental shift in the space debris monitoring and removal market, as mega-constellation operators need automated decision support rather than manual review of rising alert volumes. Kayhan Space’s Satcat Product Suite and its later inclusion in the TraCSS COLA Gap Pathfinder initiative show how data aggregation, automated maneuver planning, and machine-to-machine coordination are becoming standard tools. The space debris removal industry is increasingly valuing software because it turns a tracking feed into an operational action plan that can be repeated across thousands of satellites. The EU Space Act adds another layer of support by requiring recognized collision-avoidance service access for spacecraft operating above defined thresholds, creating a firmer demand floor for analytics platforms in the space debris monitoring and removal market, especially in Europe, where compliance design is advancing rapidly.
By Debris Size: Sub-Centimeter Tracking is Redefining Investment Priorities
Debris larger than 10 cm accounted for 41.67% of the 2025 market by debris size because these objects are cataloged, trackable, and easier to prioritize in public procurement frameworks. This group fits more naturally into existing monitoring and intervention workflows because target identity and orbital history are usually better established. The 1 mm to less than 1 cm segment is projected to grow at a 10.78% CAGR, which makes it the fastest-growing debris size class in the space debris monitoring and removal market. These fragments are small, but they matter because they can damage spacecraft surfaces, sensors, and shielding while staying below routine tracking thresholds. NASA and JAXA are supporting the Multi-layer Acoustic and Conductive-grid Sensor for deployment on Japan’s HTV-X3 mission, aimed at improving measurements of the smaller debris environment. The mmWave radar development as a path toward continuous in-situ debris density mapping, which could reshape sensor spending if flight qualification scales across constellations, changing priorities in the space debris monitoring and removal market, as better detection of smaller fragments would influence shielding design, route planning, and insurance assessment, rather than just headline removal missions. As that capability improves, investment will shift toward sensing and prediction tools that help avoid damage before a removal decision is even needed.
By End User: Government Dominance Faces Commercial Disruption
Government and defense entities accounted for 55.54% of 2025 end-user spending, making them the largest buyers in the space debris monitoring and removal market. Their lead reflects sovereign SSA needs, national space command functions, and grant-backed demonstration missions that private operators still avoid funding on their own. Public agencies also set many of the standards that later shape commercial procurement, thereby extending their role beyond direct spending, providing government customers with an outsized influence on technology validation and contract design across the space debris monitoring and removal market. Monitoring, catalog licensing, and early removal demonstrations still depend heavily on that public anchor demand.
Commercial satellite operators are projected to grow at a 10.19% CAGR through 2031, suggesting a gradual shift in how the space debris monitoring and removal market is funded. The FCC disposal rule, rising insurance pressure, and mandatory service expectations under emerging regulation are pushing operators to treat orbital safety as a direct cost of doing business. Academic and research organizations remain the smallest end-user group, but they help validate new sensing and analytics tools before those products scale commercially. Neuraspace’s university-linked participation in a public AI platform program reflects that role in the wider space debris monitoring and removal market. As commercial fleets grow larger and more maneuverable, the spending mix in the space debris monitoring and removal market will shift further away from pure government reliance.
Geography Analysis
North America held 38.87% of the space debris monitoring and removal market share in 2025, which reflects the combined pull of the US Space Force, NASA, and the Office of Space Commerce. The region leads because policy, public funding, and the scale of the commercial constellation are aligned in ways few other markets can match. NorthStar Earth and Space also announced a USD 300 million SPAC merger in April 2026 to fund the expansion of its Skylark space-based SSA constellation. Turion Space added to that regional momentum by raising more than USD 75 million in April 2026 to scale spacecraft output to 40 vehicles a year, which shows that capital is now backing operational fleet growth rather than only concept development.
Europe is the most regulation-active region in the space debris monitoring and removal market because ESA programs, EU rules, and national defense priorities are moving in the same direction. The Zero Debris Charter reached more than 150 signatories across 19 countries by 2025, which shows growing alignment around debris-neutral operating practices. ClearSpace and ESA announced the PRELUDE mission in January 2026 as a step toward commercial in-orbit services, while ClearSpace-1 remained scheduled for a 2029 launch after its earlier target change. France’s Aurore radar program and Germany’s L-GUARD effort also show that Europe is not relying solely on regulation, as sovereign surveillance infrastructure continues to expand in parallel.
Asia-Pacific is the fastest-growing region in the space debris monitoring and removal market, with a 12.11% CAGR projected through 2031. China’s 92 orbital launches in 2025 are adding pressure on regional monitoring needs, encouraging wider SSA investment across the western Pacific. South America, the Middle East, and Africa remain smaller in current demand. Still, institutional engagement from the UAE and Brazil shows that the regional footprint of the space debris monitoring and removal market is broadening, even where commercial activity remains limited.

Competitive Landscape
The space debris monitoring and removal market features competition between large aerospace contractors and specialized firms. Companies like Northrop Grumman, Lockheed Martin, Airbus, and Boeing leverage government ties and systems integration expertise in monitoring, SSA tasks, and GEO servicing. Meanwhile, firms such as LeoLabs, NorthStar, Astroscale, ClearSpace, Kayhan Space, Neuraspace, Kall Morris, and Turion Space focus on catalogs, analytics, capture systems, and removal vehicles. This structure creates a moderately concentrated market, where competitive advantage depends on mission credibility and regulatory compliance as much as financial strength.
A key divide in the market separates data service providers from hardware developers. Monitoring firms benefit from subscription models, faster deployment, and lower mission risks, while hardware providers rely on milestone-based contracts and fewer validated missions. In 2025, LeoLabs strengthened its position with catalog licensing and radar contracts. Astroscale advanced in debris removal with ADRAS-J operations in 2026, while ClearSpace progressed with its autonomous rendezvous capabilities.
Opportunities remain in sensing, automation, and capturing uncooperative objects. Kall Morris Inc. demonstrated innovative capture methods with its REACCH system in 2025 and 2026. Automation also showed potential in reducing COLA gap timing, challenging slow catalog updates. Insurance-linked incentives are gaining traction, as precise tracking data lowers deductibles and promotes better space traffic practices. Standards development and refueling interface designs are shaping future servicing advantages. While scale is important, proven safe execution remains the key determinant of competitive standing in the market.
Space Debris Monitoring And Removal Industry Leaders
ClearSpace
Astroscale Holdings Inc.
LeoLabs, Inc.
Airbus SE
Northrop Grumman Corporation
- *Disclaimer: Major Players sorted in no particular order

Recent Industry Developments
- April 2026: Turion Space secured over USD 75 million in a Series B funding round led by Washington Harbour Partners LP. The funding aims to increase spacecraft production from approximately 8 to 40 vehicles annually and expand the Droid-class space domain awareness fleet across LEO and GEO. The company currently holds 28 US government contracts, including agreements with NASA, the US Space Force, the Space Development Agency, and the NRO.
- April 2026: NorthStar Earth and Space announced a planned merger with Viking Acquisition Corp. I, valued at USD 300 million pre-money. The merger includes a committed USD 30 million PIPE, anchored by Cartesian Capital Group, to support the expansion of its Skylark space-based SSA constellation.
- March 2026: Astroscale's ADRAS-J mission, the first commercial debris inspection satellite globally, completed 293 days of proximity operations around a 3-ton H-IIA rocket upper stage. The mission approached within 15 meters, validated autonomous collision-avoidance capabilities, and initiated controlled deorbit. Phase II (ADRAS-J2), aimed at actual debris removal, is scheduled for fiscal year 2027.


Global Space Debris Monitoring And Removal Market Report Scope
Space debris monitoring is the process of tracking and identifying debris in Earth's orbit to prevent collisions with operational satellites and spacecraft. Space debris removal involves techniques and technologies that actively remove debris from orbit to ensure the sustainability of space activities.
The space debris monitoring and removal market is segmented by orbit, service type, removal technique, monitoring technology, debris size, end user, and geography. By orbit, the market is segmented into LEO, MEO, and GEO. By service type, the market is divided into space debris monitoring and space debris removal. By removal technique, it is categorized into contact and contactless. By monitoring technology, the market is segmented into ground-based sensors, space-based sensors, and analytics and collision-avoidance software. By debris size, the market is classified into 1mm to less than 1cm, 1cm to less than 10cm, and more than 10cm. By end user, the market is segmented into government and defense, commercial satellite operators, and academic and research organizations. The report also covers the market sizes and forecasts for the space debris monitoring and removal market in major countries across different regions. For each segment, the market size is provided in terms of value (USD).
| Low Earth Orbit (LEO) |
| Medium Earth Orbit (MEO) |
| Geostationary Orbit (GEO) |
| Space Debris Monitoring |
| Space Debris Removal |
| Contact |
| Contactless |
| Ground-based Sensors |
| Space-based Sensors |
| Analytics and Collision-avoidance Software |
| 1 mm to Less than 1 cm |
| 1 cm to Less than 10 cm |
| More than 10 cm |
| Government and Defense |
| Commercial Satellite Operators |
| Academic and Research Organizations |
| North America | United States | |
| Canada | ||
| Mexico | ||
| Europe | United Kingdom | |
| France | ||
| Germany | ||
| Italy | ||
| Rest of Europe | ||
| Asia-Pacific | China | |
| India | ||
| Japan | ||
| South Korea | ||
| Rest of Asia-Pacific | ||
| South America | Brazil | |
| Rest of South America | ||
| Middle East and Africa | Middle East | United Arab Emirates |
| Saudi Arabia | ||
| Rest of Middle East | ||
| Africa | South Africa | |
| Rest of Africa | ||
| By Orbit | Low Earth Orbit (LEO) | ||
| Medium Earth Orbit (MEO) | |||
| Geostationary Orbit (GEO) | |||
| By Service Type | Space Debris Monitoring | ||
| Space Debris Removal | |||
| By Removal Technique | Contact | ||
| Contactless | |||
| By Monitoring Technology | Ground-based Sensors | ||
| Space-based Sensors | |||
| Analytics and Collision-avoidance Software | |||
| By Debris Size | 1 mm to Less than 1 cm | ||
| 1 cm to Less than 10 cm | |||
| More than 10 cm | |||
| By End User | Government and Defense | ||
| Commercial Satellite Operators | |||
| Academic and Research Organizations | |||
| By Geography | North America | United States | |
| Canada | |||
| Mexico | |||
| Europe | United Kingdom | ||
| France | |||
| Germany | |||
| Italy | |||
| Rest of Europe | |||
| Asia-Pacific | China | ||
| India | |||
| Japan | |||
| South Korea | |||
| Rest of Asia-Pacific | |||
| South America | Brazil | ||
| Rest of South America | |||
| Middle East and Africa | Middle East | United Arab Emirates | |
| Saudi Arabia | |||
| Rest of Middle East | |||
| Africa | South Africa | ||
| Rest of Africa | |||


Key Questions Answered in the Report
What is the current size of the space debris monitoring and removal market?
The space debris monitoring and removal market was valued at USD 1.14 billion in 2025 and is estimated at USD 1.23 billion in 2026, with growth to USD 1.83 billion by 2031 at an 8.25% CAGR.
Why is Low Earth Orbit the main demand center for debris services?
LEO held 66.56% share in 2025 because it contains the highest concentration of active satellites and the heaviest collision-avoidance burden.
Which service segment is growing fastest in this field?
Space debris removal is the faster-growing service type, with a projected 9.91% CAGR through 2031, even though monitoring still held the larger 58.87% share in 2025.
Why are software and analytics becoming more important than hardware alone?
Analytics and collision-avoidance software is growing at 12.21% CAGR because large fleets need automated conjunction assessment and maneuver planning, not only raw tracking data.
Which region is expanding the fastest for orbital safety services?
Asia-Pacific is the fastest-growing region at a 12.11% CAGR, driven by Japan’s debris removal programs and wider regional investment in tracking capacity.
What is the biggest barrier to faster commercial adoption of debris removal missions?
The two main barriers are the lack of a binding international legal framework for third-party removal and the high capital cost of missions with uncertain pricing and return profiles.
Page last updated on:


