
Market Overview
| Study Period | 2021 - 2031 |
|---|---|
| Forecast Data Period | 2026 - 2031 |
| Base Year Market Size (2025) | USD 2.28 Billion |
| Market Size (2026) | USD 2.44 Billion |
| Market Size (2031) | USD 3.43 Billion |
| Growth Rate (2026 - 2031) | 7.03 % |
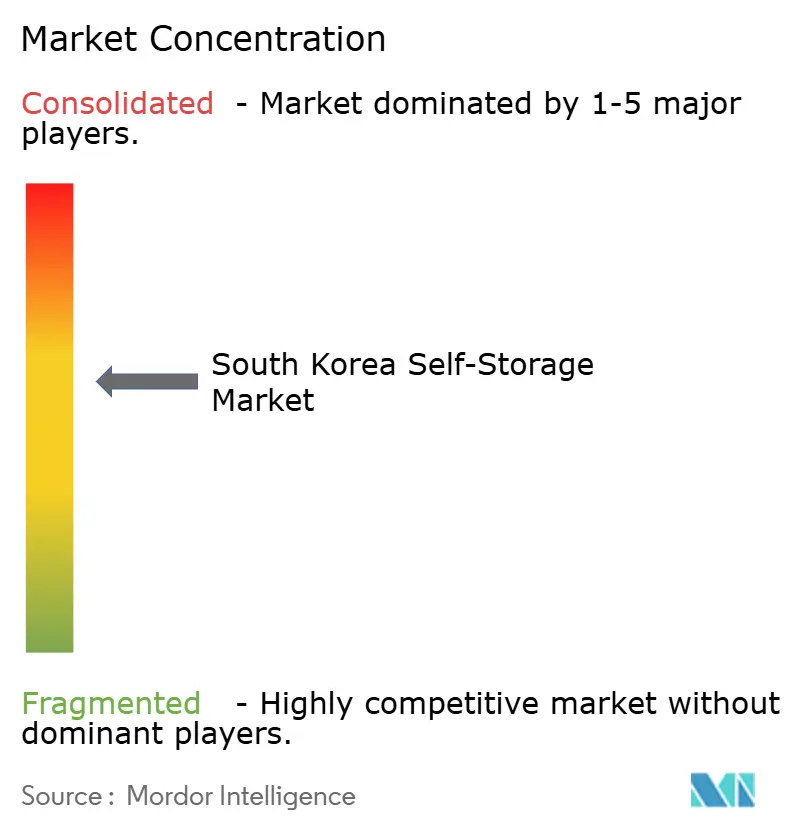
| Market Concentration | Medium |
Major Players
*Disclaimer: Major Players sorted in no particular order Image © Mordor Intelligence. Reuse requires attribution under CC BY 4.0. |
|
South Korea Self-Storage Market Analysis by Mordor Intelligence
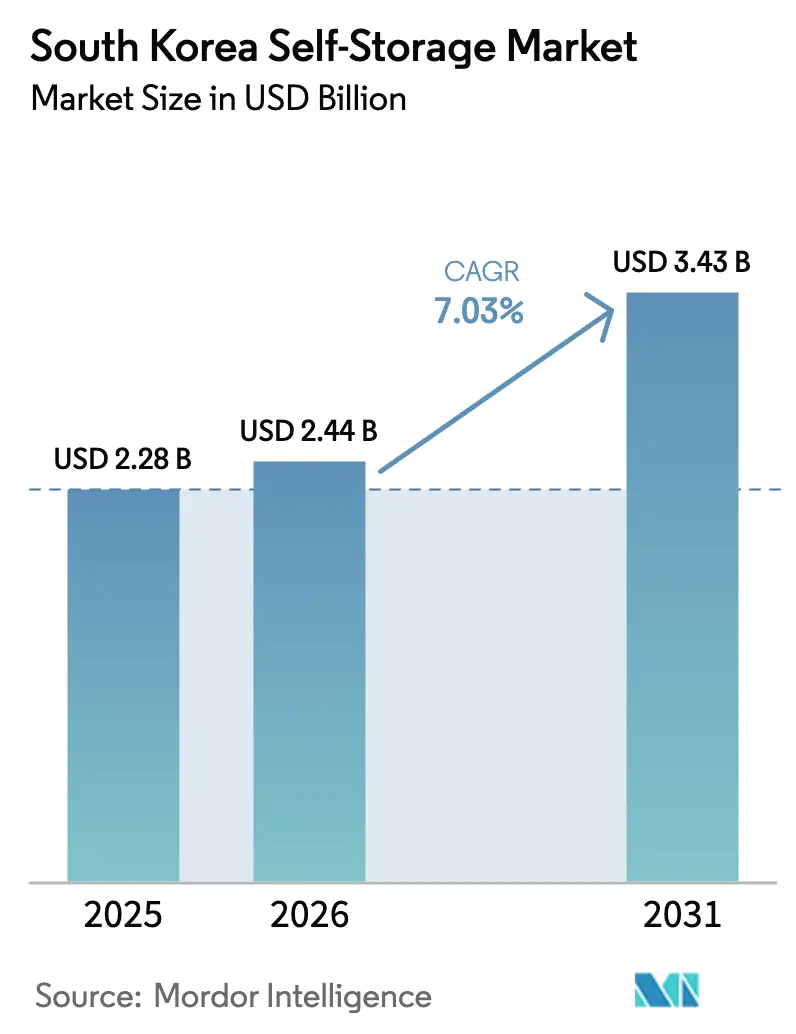
The South Korea self-storage market size is expected to grow from USD 2.28 billion in 2025 to USD 2.44 billion in 2026 and is forecast to reach USD 3.43 billion by 2031 at 7.03% CAGR over 2026-2031. Demand aligns with rapid urban densification, mounting space constraints, and the shift toward single-person households, which already account for more than one-third of residences in the country. Operators are broadening footprints to secondary metros while upgrading facilities with automation to lift utilization and tap high-margin premium services. At the same time, small and mid-sized e-commerce sellers are adopting flexible storage as a cost-efficient alternative to long-term warehousing contracts. Consolidation has begun as well-capitalized incumbents secure prime city locations and invest in digital platforms, raising barriers for late entrants. Regulatory compliance and fire-safety capital outlays temper new builds, but they also provide durable moats for established providers.
Key Report Takeaways
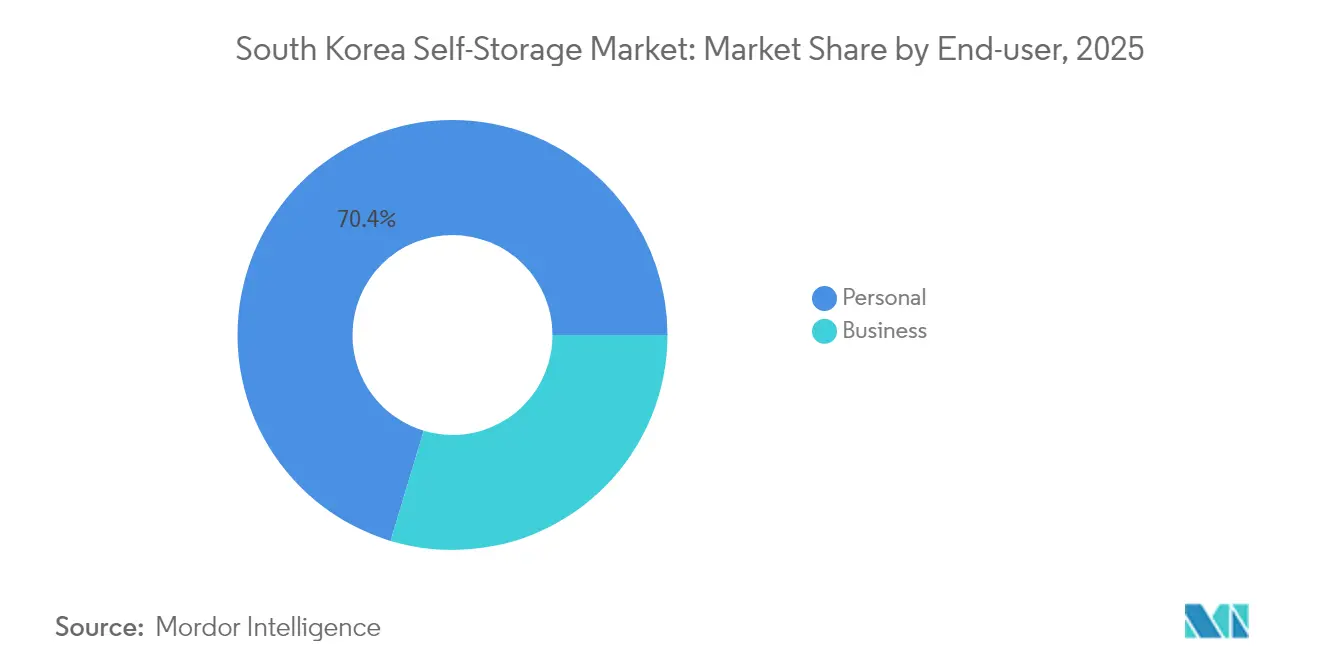
- By end-user, personal users held 70.35% of South Korea self-storage market share in 2025, whereas the business segment is expanding at a 8.75% CAGR through 2031.
- By storage unit size, small units (1–3 m²) led with 41.30% share of the South Korea self-storage market size in 2025, while the XXS/XS category (<1 m²) is growing at a 10.05% CAGR.
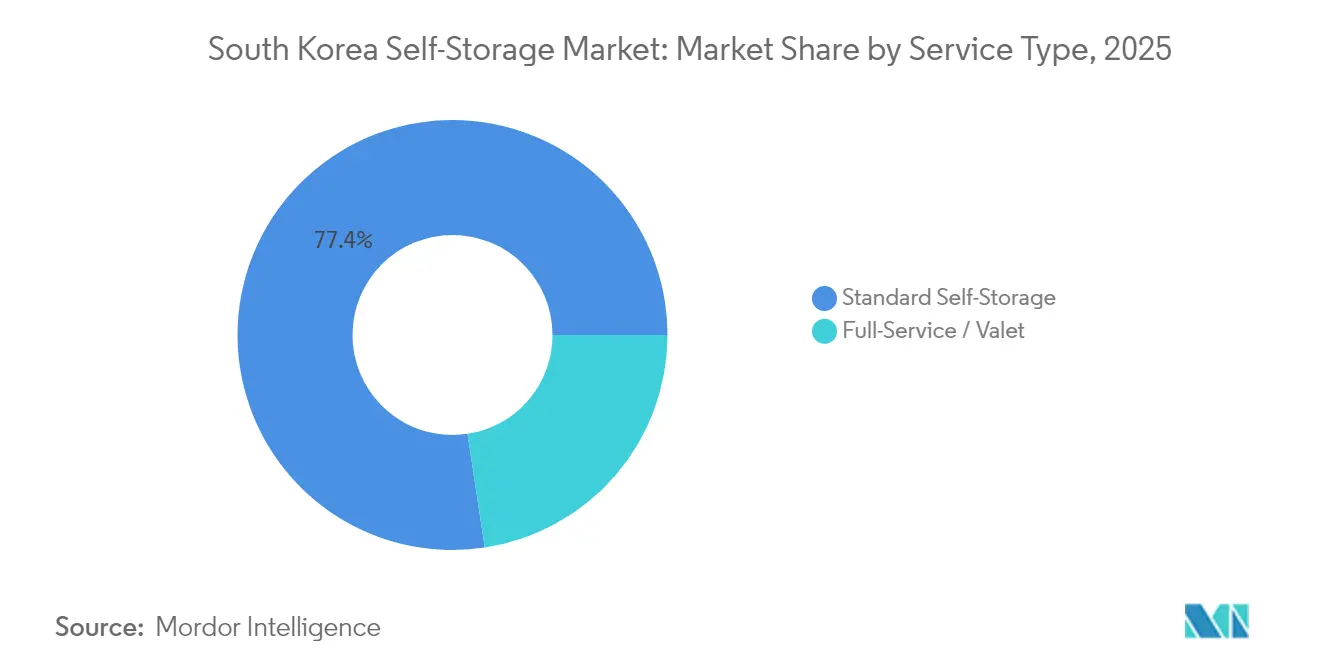
- By service type, standard self-storage commanded 77.40% revenue share in 2025; full-service valet offerings are forecast to post an 7.82% CAGR to 2031.
- By application, household goods and seasonal items accounted for 39.60% share of the South Korea self-storage market size in 2025; e-commerce inventory storage is advancing at a 9.35% CAGR.
- By region, Seoul-city captured 53.60% of South Korea self-storage market share in 2025, while Busan-Ulsan-Gyeongnam is the fastest-growing cluster at an 8.08% CAGR.
Note: Market size and forecast figures in this report are generated using Mordor Intelligence’s proprietary estimation framework, updated with the latest available data and insights as of 2026.
South Korea Self-Storage Market Trends and Insights
Drivers Impact Analysis*
| Driver | (~) % Impact on CAGR Forecast | Geographic Relevance | Impact Timeline |
|---|---|---|---|
| Urbanization & shrinking average floor space | +2.1% | Seoul Capital Area; spillover to Busan-Ulsan-Gyeongnam | Medium term (2-4 years) |
| Rising housing prices & jeonse deposit squeeze | +1.8% | Seoul-city core; extending to Gyeonggi-do suburbs | Short term (≤ 2 years) |
| E-commerce micro-fulfillment demand | +1.4% | National; focus on Seoul and Busan logistics corridors | Long term (≥ 4 years) |
| Live-commerce broadcasters’ inventory spikes | +0.9% | Seoul Capital Area; emerging in Daegu-Gyeongbuk | Medium term (2-4 years) |
| Source: Mordor Intelligence | |||
Urbanization & Shrinking Average Floor Space
South Korea’s metropolitan build-up continues to outpace residential floor-space additions, creating a durable storage gap. Single-person households are projected to edge toward 40% of total households by mid-century, a demographic that tends to maximize every square meter of living area. Developers are prioritizing unit count over floor space per dwelling, intensifying the need for external “closet” capacity. Leading operator Mini Warehouse Darak reports utilization above 90% at more than 100 Seoul-area locations, underscoring tight supply.[1] The runway is unlikely to diminish in the medium term because zoning policies still favor residential and commercial projects over storage-specific permits
Rising Housing Prices & Jeonse Deposit Squeeze
Record jeonse deposits now exceed USD 500,000 in Seoul’s premium districts, pushing families into smaller apartments and driving demand for supplemental storage. The financial strain is immediate: tenants downsize to meet deposit requirements yet retain furniture that no longer fits at home. Storage facilities profit from both the initial move-in spike and prolonged retention, as households defer larger home upgrades until deposits ease. Government housing programs that deliver smaller subsidized units inadvertently amplify off-site storage needs.
E-commerce Micro-fulfillment Demand
Mobile purchases already represent 74% of South Korea’s online sales, and food alone makes up 30% of total e-commerce value.[2] Tier-one players such as Coupang are pouring USD 2.24 billion into fulfillment hubs, but small and medium sellers rely on pay-as-you-go self-storage to keep last-mile inventory close to customers.[3]Facilities equipped with 24-hour access and app-based stock tracking are positioning themselves as micro-fulfillment partners, unlocking premium pricing and longer tenancy.
Live-commerce Broadcasters’ Inventory Spikes
Live-commerce—a blend of streaming and retail—requires broadcasters to hold diverse product samples that turn over rapidly. Studios in Seoul’s Gangnam and Hongdae districts frequently rent short-term storage during promotional events, producing episodic, high-margin demand. Operators are responding by offering photo booths, packing stations, and lightning-fast pickup protocols that align with broadcast schedules, thereby monetizing a niche yet growing user base.
Restraints Impact Analysis*
| Restraint | (~) % Impact on CAGR Forecast | Geographic Relevance | Impact Timeline |
|---|---|---|---|
| Scarcity of suitable urban real-estate plots | -1.3% | Seoul Capital Area; acute in CBD zones | Long term (≥ 4 years) |
| High conversion cap-ex & fire-protection standards | -0.8% | National; strongest in dense metros | Medium term (2-4 years) |
| Source: Mordor Intelligence | |||
Scarcity of Suitable Urban Real-estate Plots
Competing land uses in central Seoul command valuations that often surpass the breakeven threshold for storage facilities. Zoning legislation rarely carves out dedicated provisions for self-storage, forcing bidders to match prices paid by offices or residential developers. The result is a defensive moat for incumbents, yet it suppresses organic capacity growth and channels future projects toward less convenient outskirts.
High Conversion Cap-ex & Fire-protection Standards
Multi-story conversions must comply with warehouse-grade sprinkler and detection systems, lifting project costs by as much as 30%. Academic safety reviews highlight the need for specialized suppression in rack-type environments.[4]Smaller entrants struggle to raise the upfront capital, tilting the market toward operators with deeper balance sheets or listed-entity backing.
*Our forecasts treat driver/restraint impacts as directional, not additive. The impact forecasts reflect baseline growth, mix effects, and variable interactions.
Segment Analysis
By End-user: Personal Dominance Masks Business Acceleration
Personal users accounted for 70.35% of revenue in 2025, reflecting deep consumer adoption of the South Korea self-storage market. Households leverage units to offset limited apartment closets during seasonal wardrobe changes and frequent moves. Utilization spikes at quarter-ends when leases renew and during public holidays when families reorganize living areas.
The business segment, though smaller, is set to record a 8.75% CAGR through 2031 as SMEs and start-ups embrace flexible inventory solutions. Entrepreneurs view the South Korea self-storage industry as a variable-cost extension of their supply chains, sidestepping multiyear warehouse leases. Hybrid use is rising, with sole proprietors storing both personal goods and e-commerce stock in the same facility, blurring traditional boundaries.

By Storage Unit Size: Micro-storage Disrupts Traditional Sizing
Small units (1–3 m²) maintained a 41.30% share in 2025, yet the sub-1 m² band is growing at 10.05% annually, outpacing all other sizes in the South Korea self-storage market. Millennials prefer these micro-lockers for sports gear or seasonal décor, prioritizing proximity over volume.
Operators are re-engineering floorplates with denser vertical layouts and automated retrieval, squeezing more rentable lockers into fixed footprints. This shift improves yield per square meter and aligns with evolving urban lifestyles that favor renting over owning bulky items.
By Service Type: Valet Services Challenge Standard Model
Standard access solutions still dominate with 77.40% share in 2025, benefiting from lower price points and customer familiarity. The South Korea self-storage market size for valet services, however, is expected to grow at an 7.82% CAGR as time-poor professionals outsource pickup and delivery.
Digital platforms enable remote inventory visibility and app-driven scheduling, narrowing the convenience gap between standard and valet tiers. Economies of scope arise when providers layer paid transport on top of core rent, boosting revenue per user without proportionate capital outlay.
By Application: E-commerce Inventory Transforms Storage Purpose
Household goods and seasonal items held 39.60% revenue in 2025, anchoring the traditional demand base. E-commerce inventory storage is now the fastest climber at a 9.35% CAGR, underscoring Korea’s digital commerce maturity.
Facilities have begun offering barcode-based stock management, climate-controlled zones for perishables, and same-day courier hand-offs. These add-ons elevate stickiness and justify premium rents, propelling the South Korea self-storage market size allocated to commercial items.
Geography Analysis
Seoul Capital Area remains the nucleus of demand thanks to unparalleled population density and elevated commercial activity. Self-storage fills structural space gaps in apartments that rank among the smallest, globally, on a per-capita basis. Suburban Gyeonggi-do supports spill-over demand as commuters seek larger homes while retaining city jobs, generating peak rental activity during bi-annual moving seasons.
Busan-Ulsan-Gyeongnam’s 8.08% CAGR reflects port-driven commerce and infrastructure upgrades that include new fulfillment centers and industrial parks. Strategic logistics investments by national players spur auxiliary storage demand among SME merchants and third-party sellers. The region’s favorable land costs permit larger footprints, enabling operators to experiment with automated systems that raise throughput.
Mid-tier metros—Daegu-Gyeongbuk, Daejeon-Chungcheong, and Gwangju-Jeolla—show steady adoption as urbanization spreads beyond the capital corridor. Lower real-estate barriers allow facility developers to secure centrally located plots, offering convenience levels once exclusive to Seoul. These geographies present expansion corridors for chains targeting first-to-scale advantage.
Regulatory Landscape
South Korea’s self-storage sector has operated in a gray zone between neighborhood facilities and industrial warehouses, with operators historically facing restrictions tied to zoning and building-use classifications, particularly for permitting in residential areas. In 2024, the Ministry of Science and ICT (MSIT) Industrial Convergence Regulatory Sandbox designated multiple self-storage-related operators for demonstration exemptions, supporting trials of tech-enabled, unmanned, and neighborhood-adjacent operating models.
In 2025, the Ministry of Land, Infrastructure and Transport (MOLIT) advanced a building-law amendment to create a distinct category for shared storage (self-storage) separate from industrial logistics warehouses, and the public opinion period for the amendment closed on July 1, 2025. Alongside clearer classification, compliance requirements in dense metros continue to emphasize fire protection and safe building retrofits for multi-story conversions, which affects capex needs and favors operators that can meet higher safety and monitoring standards at scale.
Value Chain Analysis
The value chain starts with site sourcing and building procurement (leases or acquisitions), followed by design, permitting, and retrofitting underutilized commercial space into storage units that meet fire-safety and access requirements. Fit-out typically includes unit and locker installation, security and monitoring systems, and increasing use of unmanned access and app-based controls, after which operators monetize occupancy through subscriptions and add-on services such as insurance, packing supplies, climate control, and premium access. Korea-focused suppliers also support the ecosystem through unit manufacturing and installation, while operators differentiate through facility density in the Seoul Capital Area and expansion into secondary metros.
Go-to-market and operations run through digital discovery and booking, customer onboarding, payments, and ongoing facility management (security, utilities, maintenance, and customer support). For business users, the chain extends into logistics interfaces such as pickup and delivery, courier handoffs, and basic inventory tracking to serve e-commerce micro-fulfillment needs; operators with in-house logistics capabilities can bundle transport with storage to increase revenue per customer. Industry coordination and standards development are supported by associations such as the Self Storage Association Korea (SSAK) and Self Storage Association Asia (SSAA), which provide training, networking, and advocacy that influence operating practices and customer trust.
Competitive Landscape
Industry structure is moderately fragmented, yet consolidation is accelerating as capitalized incumbents expand networks and integrate technology. Second Syndrome, the market’s largest pure-play operator, plans a KOSDAQ listing to finance service upgrades and international forays. IAMBOX Korea quadrupled its branch count to 50 within a year by combining mobile-first booking with in-house logistics, demonstrating how digital capabilities translate into rapid scale.
Strategic differentiation has shifted from price to value-added amenities such as climate control, IoT security, and coworking lounges. Global best practices flow into the market as members engage with the Self Storage Association Asia, lifting operational standards and customer expectations. Smaller independents face rising customer-acquisition costs and compliance burdens, nudging them toward mergers or franchise partnerships.
Automation partnerships also mark a competitive frontier. CJ Logistics’ installation of 140 AutoStore robots in Incheon showcases the synergy between automated retrieval and quick-turn e-commerce fulfillment. Forward-looking storage chains are evaluating similar systems to enhance throughput and reduce labor intensity, signaling a technology arms race.
South Korea Self-Storage Industry Leaders
-
Extra Space Asia
-
Boxful Korea
-
StoreHub Korea Co., Ltd.
-
QubizKorea Co.,Ltd (Q Storage)
-
Self Box
- *Disclaimer: Major Players sorted in no particular order
Market Opportunities and Future Outlook
A primary whitespace is legally clear, neighborhood-compatible deployments once shared storage classification is standardized, because many facilities have historically been pushed into industrial-like definitions that do not fit small-footprint urban demand. MSIT’s 2024 Industrial Convergence Regulatory Sandbox designations for self-storage-related operators indicate an active pathway for piloting unmanned, tech-enabled formats, creating room for scaled rollouts in high-density districts where 24-hour access and remote security reduce staffing constraints. That development also fits operators extending beyond Seoul-city into corridors such as Busan-Ulsan-Gyeongnam, where logistics activity and lower land costs support larger footprints and more automation-heavy layouts.
Another opportunity is integrating self-storage into residential and mixed-use complexes as an amenity layer, supported by the market’s shift toward smaller living spaces and the dominance of micro-units. Operators with high utilization in the Seoul area can build structured partnerships with property owners and residential managers, while associations such as SSAK support industry education and government engagement. On the commercial side, continued investment in fulfillment infrastructure by large e-commerce players reinforces the small-merchant need for flexible, near-customer inventory storage, creating an opening to productize micro-fulfillment features (barcode tracking, courier interfaces, and climate-controlled zones) without competing directly with long-term warehouse leases.
Recent Industry Developments
- July 2026: IAMBOX Korea reached 270 locations nationwide. The expansion indicates rapid footprint scale in the Korea self-storage market, and it reinforces the competitive moat through network density and digital-enabled operations.
- June 2026: IAMBOX Korea surpassed 250 locations nationwide. The expansion supports a market leadership position and points to operational scale benefits and pricing flexibility.
- April 2026: SecondSyndrome (Mini Storage Dalock brand) reached 100,000 cumulative members nationwide. This milestone reflects demand and customer adoption that contribute to revenue stability and stronger network effects.
Research Methodology Framework and Report Scope
Market Definition and Coverage
For this study, the market covers revenues earned in South Korea from renting self-storage space and closely related facility services that are sold with the unit (for example, access, security, and basic administration), counted in USD for the stated year.
Scope exclusions: This sizing excludes upstream real estate development values, pure moving services, and general warehousing that is not sold as self-storage units.
Segmentation Overview
-
By End-user
- Personal
- Business
-
By Storage Unit Size
- XXS/XS (<1 m²)
- Small (1–3 m²)
- Medium (3–6 m²)
- Large (>6 m²)
-
By Service Type
- Standard Self-Storage
- Full-Service / Valet
-
By Application
- Household Goods and Seasonal Items
- Furniture and Appliances
- Documents and Archives
- E-commerce and Micro-fulfilment Inventory
- Others (Sports, Hobby, Wine)
-
By Region
-
Seoul Capital Area
- Seoul-city
- Gyeonggi-do
- Busan-Ulsan-Gyeongnam
-
Non-Capital Metro
- Daegu-Gyeongbuk
- Daejeon-Chungcheong
- Gwangju-Jeolla
- Gangwon
- Jeju
-
Seoul Capital Area
Data Sources, Market Sizing, and Validation
Desk Research
Desk work started by mapping space pressure signals in major metros and how quickly small households are changing, since those two signals often appear before storage demand shows up in consistent operator data. We relied on public statistics and official publications such as Statistics Korea (KOSIS), the Ministry of Land, Infrastructure and Transport (MOLIT), the Bank of Korea, and Korea's population and housing census releases for household size and relocation patterns.
We also reviewed public building and safety related information that shapes facility economics, including local fire safety rules and municipal permitting guidance published by city and district offices. On the demand and pricing side, we used public real estate transaction and rent indicators. Next, we checked operator websites and posted price tables, and we complemented those with corporate filings, investor presentations, and reputable Korean business press to understand unit sizes, promotions, and service fees that affect realized revenue. Paid subscriptions were used selectively for company financials and intelligence, news and financials tracking, and patent databases for access-control and security feature trends. The sources listed here are illustrative only, and many other public and paid references were used to collect data, confirm assumptions, and clarify open questions.
Primary Interviews and Surveys
Primary work focused on validating items that desk sources cannot show consistently, such as utilization ranges by city, discounting behavior, and how often customers resize units mid-contract. We spoke with a mix of facility operators, property managers, channel partners, and commercial users, and then checked alignment across Seoul metro and other key cities before finalizing the inputs used in the model.
These discussions were also used to confirm pricing ladders by unit size, the share of demand for climate-controlled units, and the typical time lag between a new opening and stabilized occupancy. Those observations are later reflected in the forecast path.
Distribution of primary research fieldwork respondents
| Company type | Respondent position |
|---|---|
| Top tier: 34% | CXOs: 13% |
| Mid tier: 52% | Functional/Unit leaders: 43% |
| Smaller Players: 14% | Managers: 44% |
Market-Sizing & Forecasting
The core build uses top-down and bottom-up methods. We start with a top-down demand pool where housing density and household mix are translated into addressable renters, then filter it through likely adoption rates for paid external storage. Revenue is then reconstructed using a practical chain of inputs such as facility capacity added, estimated occupied area, average rent per square meter by unit size, and the mix of paid features like climate control and extended access.
To keep totals grounded, we corroborated the output with selective bottom-up approximations, including sampled price checks across cities and a roll-up of visible facility counts and capacity signals, then adjusted when the two views drifted. Key model drivers used as inputs (illustrative) include single-person household growth, new facility openings and conversion activity, occupancy stabilization curves, KRW to USD conversion timing for the base year, and observed rent steps between small, medium, and large units. For forecasting, scenario analysis was applied around new supply pipelines and rent growth, and then reconciled with expert views on utilization and competitive pricing so the final curve does not assume straight-line expansion. When data gaps appeared (for example, missing capacity for smaller sites), we filled them using conservative ranges validated through interviews, then blended those into the national totals.
Data Validation & Update Cycle
Outputs are checked in layers so obvious inconsistencies get caught early, and subtle ones are flagged before sign-off. Our team compares implied revenue per facility and per square meter against independent signals such as advertised price bands, observed unit-size mix, and plausible occupancy ranges shared by operators.
If large variances show up by city or by year, the assumptions are revisited, and we re-contact respondents when a specific input looks unstable, such as a sudden rent jump that is not reflected in listings. Reports are refreshed annually, and interim updates are made when material events occur, such as major openings, regulatory changes affecting operating costs, or a clear shift in demand from business users. Before delivery, a final analyst pass is completed so clients receive the latest updated view.
Mordor Intelligence's South Korea Self Storage Market Size Versus Other Published Estimates
Published values for self-storage can differ by a lot because the counted revenue pool is not always the same, and the assumed occupancy and rent progression can be handled in different ways. Differences also come from which cities are covered, what year is treated as the base, and whether currency conversion is aligned to the pricing period.
Some outside figures lean toward a narrow lens that focuses mainly on Seoul and a limited set of facilities, and they often treat pricing as a single national average without clear steps by unit size. For Mordor Intelligence, totals are built from self-storage service revenue across South Korea using unit-size rent ladders and utilization ramp profiles, and general warehousing and pure moving revenue sit outside scope.
Benchmark comparison
| Source | Market Size | Gaps in Research Methodology |
|---|---|---|
| Mordor Intelligence | USD 2.28 B (2025) | |
| Global Consultancy A | USD 1.21 B (2024) | Uses metro-heavy coverage and a simplified scaling method, which can miss capacity additions outside Seoul and understate utilization ramp-ups in newer facilities. |
| Industry Journal B | USD 1.50 B (2024) | Builds the value mainly from historic occupancy trends with one average rent assumption, and it does not explicitly model unit-size pricing steps or premium-feature uplift. |
The gap across sources is mainly explained by national versus metro coverage, plus whether rent is stepped by unit size and adjusted for feature mix. When inputs are tied back to observable capacity signals, pricing ladders, and realistic occupancy ramps, the resulting market value is easier to reproduce and update as conditions change.
Key Questions Answered in the Report
What is the current size of the South Korea self-storage market?
The market generated USD 2.44 billion in 2026 and is forecast to reach USD 3.43 billion by 2031, growing at a 7.03% CAGR.
Which user segment dominates demand?
Personal users held 70.35% revenue share in 2025, reflecting widespread household adoption for managing space constraints.
Why is Busan-Ulsan-Gyeongnam the fastest-growing region?
Port logistics expansion, diversified manufacturing, and government decentralization initiatives are driving an 8.08% CAGR in that corridor.
How are e-commerce trends influencing facility design?
Operators are adding barcode-based inventory tools, climate zones, and same-day courier interfaces to serve small merchants needing micro-fulfillment capabilities.
What barriers deter new market entrants?
High urban land costs, stringent fire-safety retrofits, and the capital required for digital platforms collectively elevate entry thresholds.
Are valet storage services gaining traction?
Yes, full-service valet offerings are projected to grow at a 7.82% CAGR as busy professionals prioritize convenience over traditional do-it-yourself access.