
Laser Capture Microdissection Market Size and Share
Market Overview
| Study Period | 2020 - 2031 |
|---|---|
| Market Size (2026) | USD 223.17 Million |
| Market Size (2031) | USD 358.43 Million |
| Growth Rate (2026 - 2031) | 9.94 % |
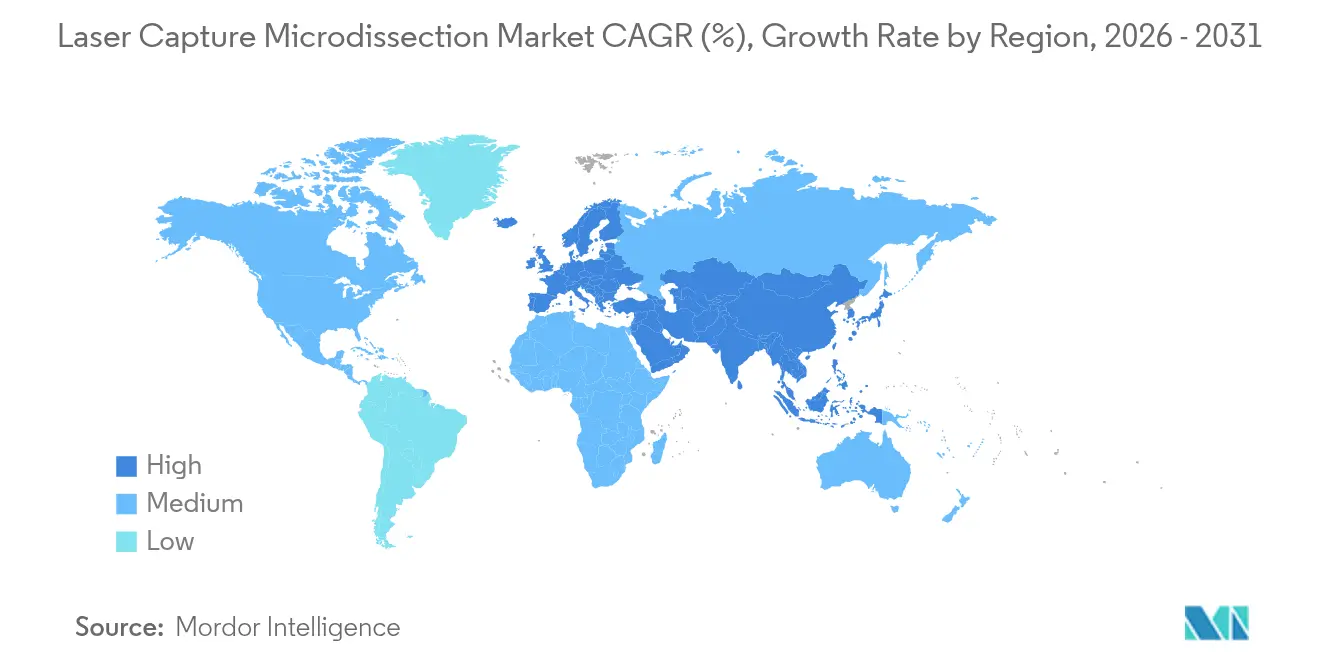
| Fastest Growing Market | Asia Pacific |
| Largest Market | North America |
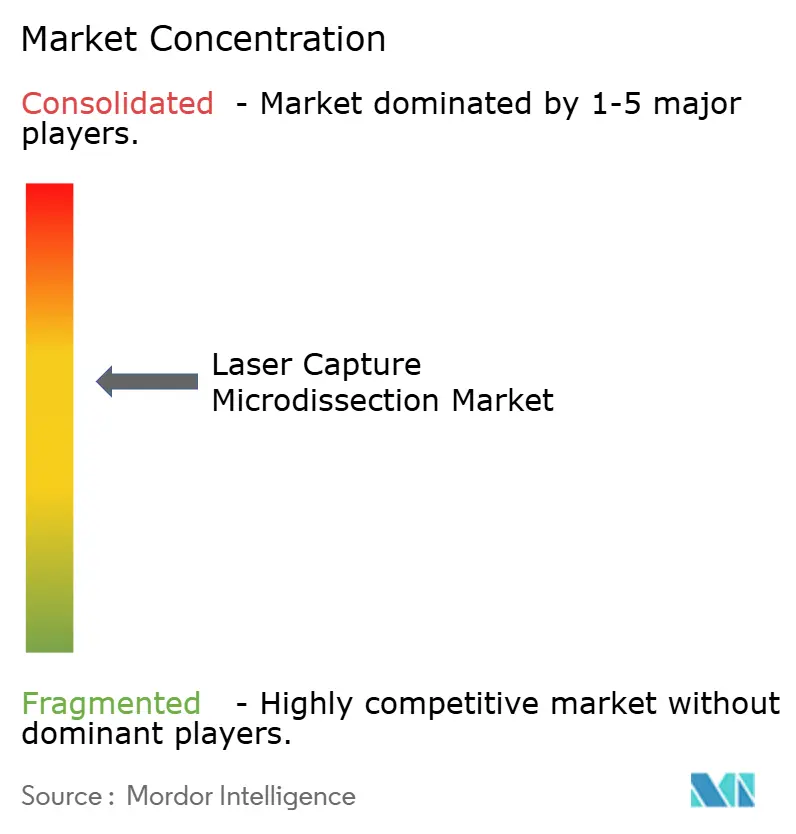
| Market Concentration | Medium |
Major Players *Disclaimer: Major Players sorted in no particular order Image © Mordor Intelligence. Reuse requires attribution under CC BY 4.0. | |
Laser Capture Microdissection Market Analysis by Mordor Intelligence
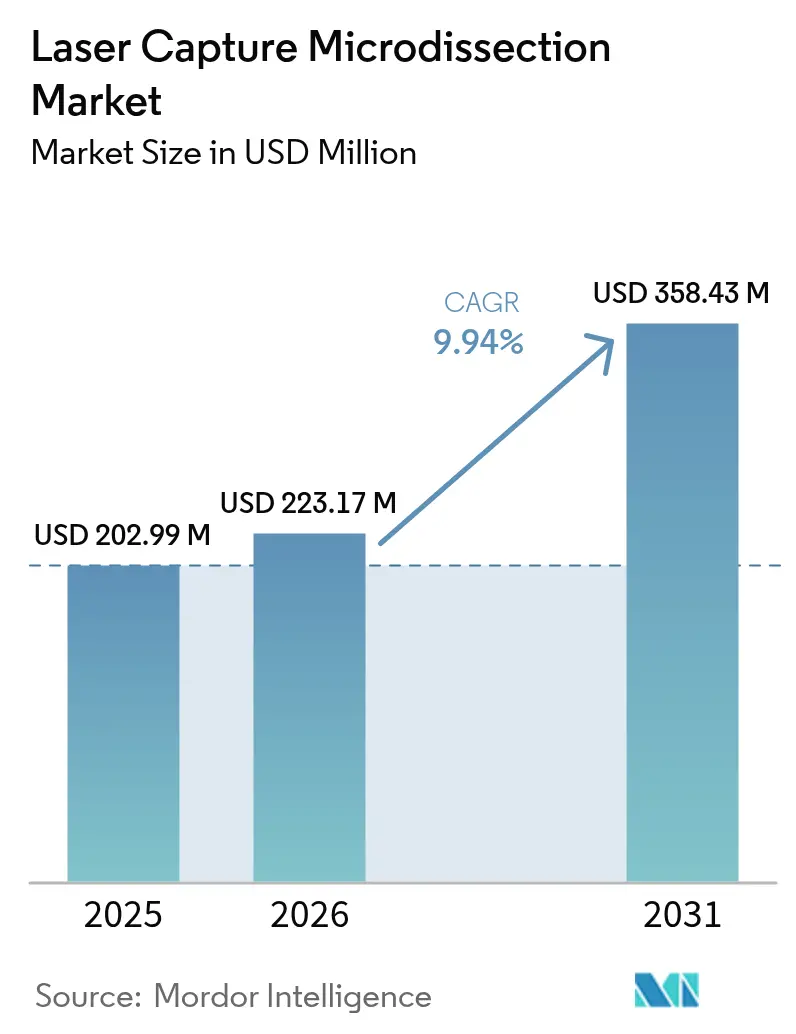
The Laser Capture Microdissection market size is expected to grow from USD 202.99 million in 2025 to USD 223.17 million in 2026 and is forecast to reach USD 358.43 million by 2031 at 9.94% CAGR over 2026-2031.
Demand surges as the technology links histopathology to molecular biology, allowing scientists to extract precise cell groups while safeguarding spatial context for multi-omics studies. Artificial intelligence is now stitched into spatial biology workflows, helping laboratories automate target recognition and shorten analysis cycles. Pharmaceutical and biotechnology firms deploy laser capture microdissection platforms to isolate tumor cells from mixed tissue sections, accelerating biomarker discovery and drug-response profiling. Consumables gain traction because recurring purchases of capture films and reagents support high-throughput studies, while infrared systems win favor for gentler DNA and protein handling. Asia-Pacific records the fastest expansion as government programs in China, Japan, and India build new spatial-omics research centers, even as North America retains leadership through mature research funding and early AI adoption.
Key Report Takeaways
- By product, instruments held 44.05% of laser capture microdissection market share in 2025, whereas consumables are projected to rise at a 13.03% CAGR through 2031.
- By system type, ultraviolet platforms led with 51.51% revenue share in 2025; infrared systems are anticipated to post the fastest 15.17% CAGR to 2031.
- By application, research & development accounted for 60.61% of the laser capture microdissection market size in 2025, while diagnostics is expected to expand at an 11.12% CAGR over the same period.
- By end user, academic & government institutes dominated with 43.13% share of the laser capture microdissection market size in 2025, yet pharmaceutical, biotechnology companies & CROs show an 11.66% CAGR outlook.
- By geography, North America commanded 42.42% of laser capture microdissection market share in 2025, whereas Asia-Pacific is predicted to grow at a 13.19% CAGR to 2031.
Note: Market size and forecast figures in this report are generated using Mordor Intelligence’s proprietary estimation framework, updated with the latest available data and insights as of 2026.
Market Trends and Insights
Drivers Impact Analysis of Laser Capture Microdissection Market*
| Driver | (~) % Impact on CAGR Forecast | Geographic Relevance | Impact Timeline |
|---|---|---|---|
| R&D outlays in oncology & neurology | +2.1% | Global, concentrated in North America & Europe | Medium term (2-4 years) |
| Technical advantages over manual microdissection | +1.8% | Global | Short term (≤ 2 years) |
| Surge in spatial-omics workflows | +2.5% | North America, Europe, Asia-Pacific | Long term (≥ 4 years) |
| Precision-medicine biomarker programs | +1.9% | Global | Medium term (2-4 years) |
| AI-guided automation | +1.4% | North America & EU | Long term (≥ 4 years) |
| Microfluidic-LCM hybrids | +1.2% | North America, Europe, Asia-Pacific | Long term (≥ 4 years) |
| Source: Mordor Intelligence | |||
Rising Public & Private-Sector R&D Outlays in Oncology & Neurology
Cancer and neurodegenerative disease burdens spur funding streams that make laser capture microdissection a staple in academic and commercial labs. Chinese and Japanese grants bankroll national spatial-omics hubs that rely on the technique for single-cell genomics. Each oncology project typically loops laser capture microdissection into several stages, from tumor microenvironment mapping to therapy monitoring. The requirement now reads as table stakes for competitive drug pipelines, causing pharmaceutical sponsors to specify laser capture microdissection in research contracts. This steady cash flow underpins long-term growth prospects in every major region.
Technical Advantages Vs. Manual Microdissection
Laser capture microdissection produces contamination-free sections with consistent success, unlike manual scalpel methods that risk cross-talk between adjacent cells.[1]Molecular Machines & Industries, “CellCut Plus Product Overview,” molecular-machines.com Preservation of RNA integrity matters when labs shift toward single-cell transcriptomics requiring intact molecules. Automation removes operator bias and improves reproducibility, reducing costly re-runs. Imaging modules help scientists identify cell clusters by morphology or fluorescence at sub-cellular resolution, enabling studies in developmental biology and disease progression once impossible with manual extraction. These combined benefits shorten workflow times and raise confidence in downstream analytics.
Surge in Spatial-Omics & Single-Cell Multi-Omics Workflows
Marrying laser capture microdissection with spatial transcriptomics lets researchers chart gene expression against native tissue architecture. Multi-omics designs can profile up to five molecular layers in situ, with laser capture microdissection preserving spatial fidelity throughout processing. The LCM-seq approach reconstructs tumor expression patterns that reveal interactions driving metastasis. Drug developers embed spatial omics into discovery programs to locate actionable biomarkers and study mechanism-of-action. Compatibility with both fresh-frozen and formalin-fixed tissues also broadens use in clinical studies that mine archived specimens for retrospective insights.
Growth in Precision-Medicine Biomarker Discovery Programs
Regulators now emphasize companion diagnostics, nudging firms to use laser capture microdissection so biomarker assays start with pure cell populations. The technology slots into clinical trial protocols for retrospective analyses that correlate biomarker status with treatment outcomes.[2]U.S. Food & Drug Administration, “Companion Diagnostic Guidance,” fda.gov Liquid biopsy research further fuels tissue-based validation using laser capture microdissection to confirm circulating markers. Hospitals launch core facilities that reduce per-study costs for investigators, deepening institutional adoption across oncology, neurology, and immunology pipelines.
Restraints Impact Analysis of Laser Capture Microdissection Market*
| Restraint | (~) % Impact on CAGR Forecast | Geographic Relevance | Impact Timeline |
|---|---|---|---|
| Capital & maintenance costs | -1.8% | Global, harder on emerging markets | Short term (≤ 2 years) |
| Shortage of pathologists & technologists | -2.2% | Global, acute in low-income regions | Medium term (2-4 years) |
| Thermal/UV-induced nucleic acid damage | -0.9% | Global | Short term (≤ 2 years) |
| Rival droplet-based single-cell platforms | -1.5% | North America & Europe, spreading to Asia-Pacific | Long term (≥ 4 years) |
| Source: Mordor Intelligence | |||
High Capital & Maintenance Cost of Integrated Systems
Full laser capture microdissection workstations often top USD 500,000, placing them beyond reach for many mid-tier labs. Annual service contracts reach 15-20% of purchase value, covering laser calibration and optics replacement. Limited budgets force institutions to share core facilities, stretching booking schedules and lowering throughput. Emerging-market universities find procurement cycles lengthy, delaying installations that could support grant competitiveness. Even in wealthier regions, budget reallocations toward consumables and data analysis sometimes slow new equipment orders.
Shortage of Pathologists & Trained Technologists in Histology Labs
Some regions list fewer than 3 pathologists per million citizens, while advanced economies have 65 per million, creating a talent gap.[3]Anil V. Parwani, “Digital Pathology Adoption in North America,” cap.org Vacancy rates exceed 18% in specialized histology departments, making it hard to staff laser capture microdissection suites. Seasoned staff already review over 4,000 cases each year, leaving little time for labor-intensive microdissection protocols. Training programs that merge histology with molecular biology remain scarce, extending onboarding timelines. Under-staffed facilities operate below capacity, inflating per-sample costs and delaying research milestones.
*Our forecasts treat driver/restraint impacts as directional, not additive. The impact forecasts reflect baseline growth, mix effects, and variable interactions.
Laser Capture Microdissection Market Segment Analysis
By Product:
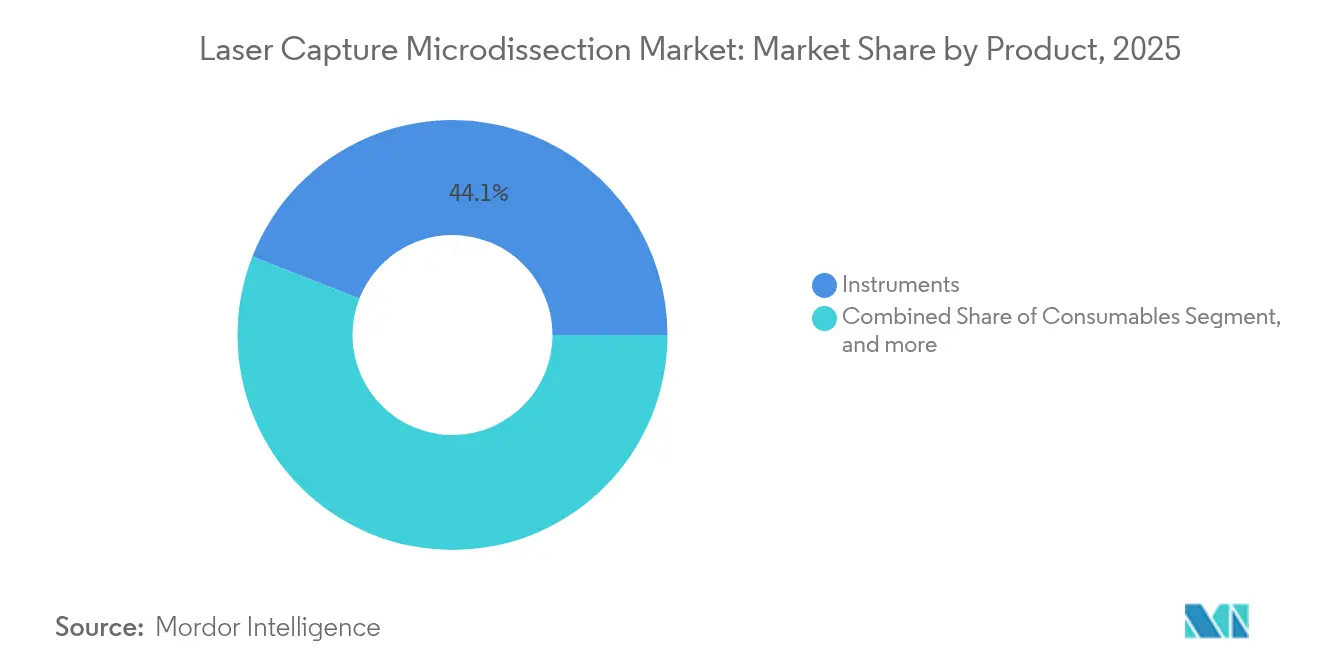
Consumables Drive Recurring Revenue GrowthConsumables are the fastest rising category, projected to climb at a 13.03% CAGR through 2031 as high-throughput pipelines require continuous supplies of capture films, slides, and reagents. Instruments retained a 44.05% laser capture microdissection market share in 2025, yet the shift to subscription-style ordering models signals a maturing buyer base focused on long-term workflow consistency. Software & services, though smaller in sales, gain relevance as buyers seek turnkey ecosystems that link microdissection hardware to downstream sequencing and bioinformatics.
This transition widens profit pools by anchoring vendors to installed bases through steady consumable demand. Novel polymer membranes now tailor adhesion and thickness to specific tissue classes, improving capture efficiency. Suppliers add RFID tags to consumables so laboratories can track batch usage and automate re-ordering. As microfluidic-LCM hybrids reach market, entirely new cartridge formats could deliver combined isolation and lysis, enabling bundled revenue streams that blur the boundary between hardware and consumables.



By System Type:
Infrared Technology Gains Market ShareUltraviolet systems owned 51.51% revenue in 2025, yet infrared platforms are forecast to expand 15.17% yearly thanks to milder thermal signatures that protect DNA and proteins for downstream omics. Infrared devices also capture cells more cleanly, which suits single-cell pipelines seeking error-free libraries. UV systems remain popular where morphological preservation is essential, such as teaching hospitals that pair microdissection with conventional histology.
Vendors differentiate through automation depth, sample navigation speed, and compatibility with high-content image analysis. Infrared platforms operate at lower power thresholds that cut edge carbonization, enhancing capture yield. Meanwhile, laser microdissection pressure-catapulting systems find niche demand in forensic science, where non-contact ejection eliminates contamination risk in trace DNA work. Together these advances keep the laser capture microdissection market responsive to shifting research priorities.
By Application:
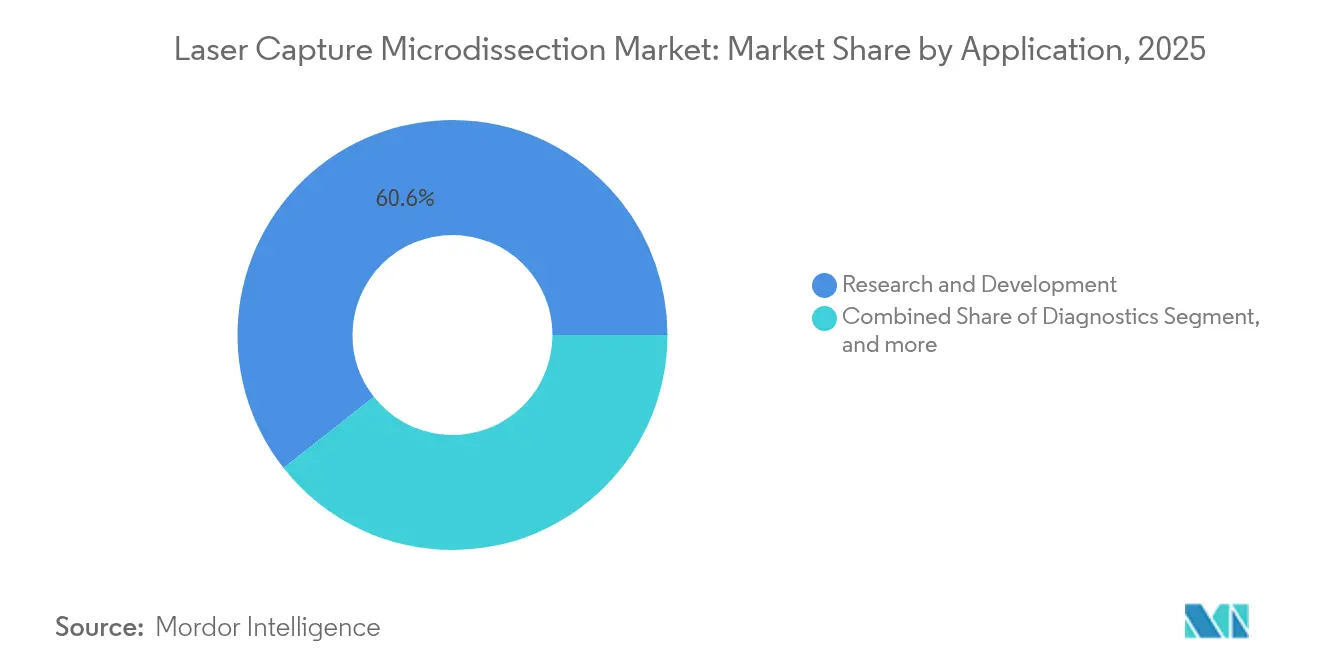
Diagnostics Accelerate Clinical TranslationResearch & development led with 60.61% of the overall laser capture microdissection market size in 2025, yet diagnostic use cases display an 11.12% CAGR as pathology labs integrate spatial biology into routine workflows. Companion diagnostic development steers demand from pharmaceutical sponsors that co-fund equipment installations. Oncology pathology dominates diagnostic installations because tumor heterogeneity obscures biomarkers unless pure cell populations are evaluated.
Digital pathology now guides real-time microdissection by overlaying AI-derived heat maps onto tissue, letting technologists isolate regions of interest within seconds. Proteomics and metabolomics, though smaller today, benefit from the same sample purity promise and are positioned for future expansion as mass-spectrometry sensitivity improves. Laboratories leveraging laser capture microdissection validate liquid biopsy markers by matching them to tissue origin, linking circulating DNA fragments to precise tumor zones for treatment selection.
By End User:
Pharmaceutical Sector Drives Commercial AdoptionAcademic & government centers held 43.13% share in 2025, reflecting grant-funded purchases and open-access core facilities. However, pharmaceutical, biotechnology companies & CROs are expected to register an 11.66% CAGR, propelled by regulatory pressure to include spatially resolved biomarkers in submission packages. Hospitals remain a moderate contributor, primarily in cancer diagnostics and transplant immunology.
Commercial players favor integrated platforms that connect laser capture microdissection to sequencing lanes and cloud analytics, reducing turnaround time from sample to insight. CROs market laser capture microdissection-enabled services to small biotechs lacking capital budgets, widening global access. The resulting ecosystem funnels data into precision medicine pipelines, amplifying demand for validated consumables and service contracts.
Geography Analysis
North America Laser Capture Microdissection Market
North America retained 42.42% of laser capture microdissection market share in 2025, supported by sustained National Institutes of Health funding and mature pharmaceutical R&D clusters. Widespread adoption of digital pathology simplifies workflow integration, while AI-assisted microdissection reduces labor bottlenecks. Nevertheless, staffing shortages and reimbursement pressures temper near-term growth.
Europe Laser Capture Microdissection Market
Europe follows as the second-largest region through concerted public-private programs that back precision-medicine research. Germany, the United Kingdom, and France house multiple laser capture microdissection core facilities that operate as shared hubs, improving equipment utilization. Harmonized companion diagnostic regulations encourage device makers to partner with local biopharma companies. Still, funding variability among EU states and post-Brexit research uncertainties create uneven adoption rates across the continent.
APAC Laser Capture Microdissection Market
Asia-Pacific posts the fastest 13.19% CAGR to 2031. China’s Five-Year Plan prioritizes spatial biology, prompting large-scale laboratory construction and bulk purchasing agreements. Japanese institutes pursue oncology and neurodegeneration studies that depend on high-fidelity infrared microdissection. India’s contract research organizations add laser capture microdissection to service menus for global drug sponsors, yet infrastructure gaps and talent shortages may slow rollout outside tier-one cities. Collective investment across the region points to sustained, above-average expansion.

Competitive Landscape
The laser capture microdissection market shows moderate concentration. Carl Zeiss Meditec and Danaher’s Leica Microsystems leverage deep microscopy expertise and worldwide support networks to keep installed bases high. Thermo Fisher Scientific bundles microdissection with downstream sequencing kits, offering end-to-end workflows. Molecular Machines & Industries and Fluidigm carve out specialized niches, focusing on automation depth and multi-omic compatibility.
Competition now centers on software, image analytics, and workflow orchestration rather than laser wattage alone. Danaher’s partnership with Stanford University on smart microscopy exemplifies strategic collaboration aimed at integrating AI for real-time decision support. Meanwhile, regional distributors in Asia-Pacific secure early-stage market footholds by coupling technical support with locally relevant training.
Vendor roadmaps converge on microfluidic integration, cloud-connected analytics, and modular consumable ecosystems. Firms race to certify platforms for diagnostic use, anticipating regulatory approval that could shift revenue toward clinical labs. Price competition remains secondary because researchers value throughput, sample integrity, and informatics compatibility over upfront cost.
Laser Capture Microdissection Industry Leaders
Thermo Fisher Scientific
Danaher Corporation (Leica Microsystems)
Molecular Machines and Industries GmbH
Carl Zeiss Meditec AG
Fluidgm Corporation
- *Disclaimer: Major Players sorted in no particular order
Laser Capture Microdissection Market Companies Covered in this Report
- Carl Zeiss
- Danaher Corp (Leica Microsystems)
- Thermo Fisher Scientific
- Molecular Machines & Industries
- Fluidigm Corp.
- LLS Rowiak LaserLabSolutions GmbH
- Molecular Devices
- Hamilton Thorne
- Motic Instruments Inc.
- MicroSupport Co. Ltd.
- Epistem Ltd.
- VitroVivo Biotech LLC
- Caresbio Laboratory
- GnomeDX LLC
- Biogenity Ltd.
- PALM MicroBeam
- Tecan Group
- Omnit Labs
- AvanSci Bio
- NIKON Instruments Inc.

Market Opportunities and Future Outlook
White-space in laser capture microdissection (LCM) is increasingly defined by end-to-end workflow integration rather than incremental hardware changes. With instruments often priced above USD 500,000 and annual service contracts running about 15-20% of purchase value, many labs shift activity toward shared core facilities and service providers. This creates room for vendors to package validated, repeatable workflows along with recurring consumables (capture films, slides, reagents) and tighter software interoperability.
Clinical translation is another opportunity area, particularly when precision-medicine biomarker programs need purer cell populations from heterogeneous tissues and where retrospective studies use archived specimens. Demand is also shifting toward lower-damage capture approaches, which supports growth in infrared systems for DNA and protein preservation, and it motivates work on methods and protocols that reduce UV-related nucleic-acid damage in delicate samples. At the same time, expanding spatial-omics and single-cell multi-omics pipelines, including workflows that link immunohistochemistry-defined targets with sequencing readouts, keep pressure on LCM solutions that can handle both fresh-frozen and FFPE tissues while maintaining metadata traceability and fitting downstream sequencing and bioinformatics environments.
Recent Industry Developments in Laser Capture Microdissection Market
- February 2026: Leica Microsystems laser microdissection systems were cited in newly published peer-reviewed research that used Leica LMD platforms in an LCM workflow. The publication added fresh third-party validation for LCM use in advanced molecular analyses, supporting ongoing adoption of integrated microdissection-to-omics workflows in research settings.
- January 2025: Leica Biosystems and Indica Labs announced a strategic investment to build an integrated digital pathology platform combining Leica Aperio scanning with Indica HALO AP software. The combined workflow strengthens AI-assisted tissue analysis and companion diagnostic development, increasing demand for precise region selection and downstream sample preparation steps where LCM is used.
- July 2024: Danaher launched a research collaboration with Stanford University via its Beacons program to develop next-generation smart microscopy technologies for cancer drug screening. The initiative advanced AI-enabled spatial biology capabilities that align with more automated identification of regions of interest and higher-throughput microdissection workflows.


Laser Capture Microdissection Market Report Scope and Research Methodology
Market Definition and Coverage
This market is measured as the revenue generated from laser capture microdissection (LCM) solutions used to isolate specific cells or tissue regions for downstream molecular analysis in research and clinical workflows.
Scope exclusions: It does not count LCM capability that is only embedded inside broader sequencing or imaging workstations when it is not sold and priced as a stand-alone or bundled LCM solution.
Segments Covered in This Report
- By Product
- Instruments
- Consumables
- Software & Services
- By System Type
- Ultraviolet LCM
- Infrared LCM
- Immunofluorescence-guided LCM
- LMPC (Laser Microdissection Pressure-Catapulting)
- By Application
- Research & Development
- Genomics
- Proteomics
- Diagnostics
- Oncology
- Pathology and Cytopathology
- Forensics & Others
- Research & Development
- By End User
- Academic & Government Research Institutes
- Hospitals
- Pharmaceutical, Biotechnology Companies & CROs
- Forensic Science Laboratories
- By Geography
- North America
- United States
- Canada
- Mexico
- Europe
- Germany
- United Kingdom
- France
- Italy
- Spain
- Rest of Europe
- Asia-Pacific
- China
- Japan
- India
- Australia
- South Korea
- Rest of Asia-Pacific
- Middle East & Africa
- GCC
- South Africa
- Rest of Middle East & Africa
- South America
- Brazil
- Argentina
- Rest of South America
- North America
Data Sources, Market Sizing, and Validation
Desk Research
Desk work starts by fixing the boundaries and the unit economics, so we do not mix LCM revenues with adjacent sample prep or analysis steps. Public sources used for context and guardrails include, such as National Institutes of Health funding data, OECD health and R&D statistics, WHO cancer burden indicators, US FDA databases for related clinical testing context, and publications indexed in PubMed for adoption trends in pathology and omics workflows.
We then layer in company filings, investor presentations, product documentation, and reputable press coverage to understand how instruments, software, and consumables are packaged and priced across regions. Where needed, paid subscriptions for company financials and news intelligence, patent databases, and shipment-level import or export data are used to sanity check vendor presence and demand signals. These examples are not exhaustive, and we also referred to other public and paid sources for data collection, validation, and research clarification.
Primary Interviews and Surveys
Primary work is used to confirm what is actually being purchased, how often instruments are replaced, and how consumables attach to installed systems in real labs. Interviews and surveys typically cover instrument suppliers, distributors, and end users like academic labs, hospital pathology teams, and biopharma research groups, with coverage spread across APAC, EMEA, and the Americas to reflect differences in research funding and clinical adoption.
Distribution of primary research fieldwork respondents
| Company type | Respondent position | Region |
|---|---|---|
| Top tier: 36% | CXOs: 16% | APAC: 42% |
| Mid tier: 42% | Functional/Unit leaders: 28% | EMEA: 31% |
| Smaller Players: 22% | Managers: 56% | Americas: 27% |
Market-Sizing & Forecasting
Market sizing is built using a top-down approach where research and clinical demand pools are reconstructed from lab activity signals, research spending direction, and the expected penetration of LCM within tissue analysis workflows. To keep the output practical, we track a small set of inputs that can be refreshed each year, such as life-science R&D funding trends, oncology and pathology testing volumes as demand proxies, installed base replacement cycles for capital instruments, average consumables per instrument per year, and region-wise pricing differences for systems and capture kits.
The total is then cross-checked using selective bottom-up approximations, such as rolling up a sample of supplier revenues, using channel checks to validate instrument unit volumes, and applying sampled ASP times volume where public pricing is visible. When vendor revenue splits are not disclosed, gaps are handled through ratio assumptions tied to product mix and validated through interviews, followed by sensitivity checks so the final number does not swing on one weak input.
For forecasting, scenario analysis is used so the model can reflect different adoption speeds in academic labs versus clinical settings, and then the selected path is aligned to what experts expect for procurement cycles and funding stability. Growth is expressed in constant currency first and then converted using the relevant year exchange rate assumptions to reduce noise from short-term currency moves.
Data Validation & Update Cycle
Validation is done in layers, starting with unit and pricing reasonableness checks and then moving to region-level consistency tests against research activity signals. Any large variance versus prior-year values triggers a deeper review of drivers, after which we re-contact interviewees to confirm whether the change is real or driven by one-off purchasing cycles.
Before sign-off, the model and its assumptions are reviewed by another analyst to catch logic breaks, double counting, and scope drift. Reports are refreshed annually, and interim updates are made when material events occur, such as major product launches, regulatory changes affecting clinical use, or sharp shifts in research funding. Right before delivery, the full dataset is scanned again so clients receive the most current view available.
Mordor Intelligence's Laser Capture Micro Dissection Market Sizing Compared With Other Published Estimates
Published market values for LCM can look inconsistent because different teams draw the market boundary in their own way and also pick different base years. The spread can also come from how consumables and software are treated, how regions are converted into USD, and whether clinical use is counted broadly or only where it is clearly documented.
By tracking the instrument installed base and refresh cycles, and then attaching consumables with validated usage rates, Mordor Intelligence keeps the 2025 value tied to what labs can reasonably consume rather than letting bundled adjacent tools inflate the total. Another frequent gap driver is the forecast stance, where some estimates bake in aggressive adoption of LCM in routine diagnostics, while others stay closer to research-led demand until reimbursement and workflow standards are clearer.
Benchmark comparison
| Source | Market Size | Gaps in Research Methodology |
|---|---|---|
| Mordor Intelligence | USD 202.99 M (2025) | |
| Global Consultancy A | USD 218.47 M (2025) | Uses a broader product basket that can include services and software beyond stand-alone LCM bundles, and it may apply faster ASP uplift assumptions into 2025 that raise the total even if unit growth is moderate. |
| Industry Publisher B | USD 193.80 M (2025) | Tends to anchor closer to supplier-side reported revenues and can undercount consumables attachment where purchasing is fragmented across distributors, which pulls the 2025 total down versus a demand-linked usage model. |
The table shows that most of the difference is explained by what gets counted as in-scope LCM revenue and how recurring consumables are attached to instruments over time. Our approach stays traceable to a few repeatable inputs, so buyers can see what moved the market and stress-test the assumptions without needing hard-to-access datasets.


Key Questions Answered in the Report
What is driving demand in the laser capture microdissection market?
High R&D spending in oncology and neurology, together with AI-enhanced spatial-omics workflows, is boosting equipment and consumables sales worldwide.
Which region leads the laser capture microdissection market?
North America leads with 42.42% share in 2025, thanks to strong NIH funding and mature pharmaceutical activity.
How fast is the Asia-Pacific laser capture microdissection market growing?
Asia-Pacific is projected to post a 13.19% CAGR between 2026 and 2031 due to national precision-medicine initiatives in China, Japan, and India.
Which product segment is expanding quickest?
Consumables are growing at 13.03% CAGR as high-throughput protocols raise recurring demand for capture films and reagents.
Why are infrared systems gaining traction?
Infrared platforms minimize thermal damage, improving DNA and protein preservation for downstream multi-omics, leading to a forecast 15.17% CAGR through 2031.
What is the main restraint holding back adoption?
High capital and maintenance costs, often exceeding USD 500,000 per system, delay procurement for smaller or emerging-market laboratories.
Page last updated on:





