Market Overview
| Study Period | 2020 - 2031 |
|---|---|
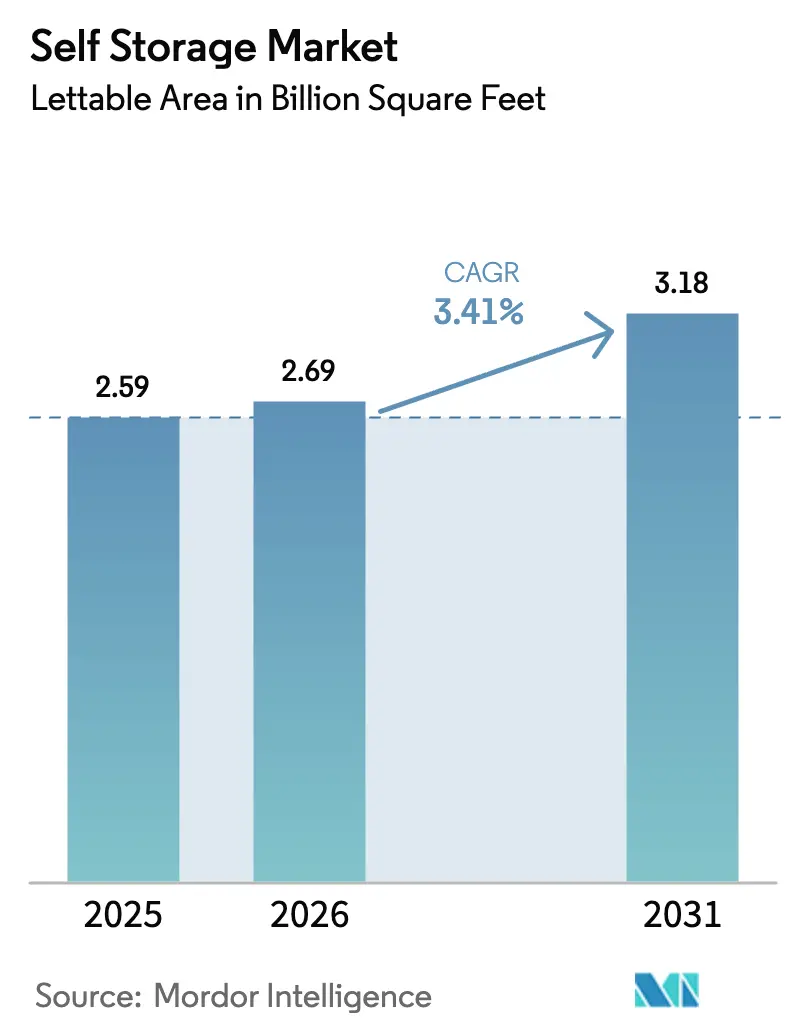
| Market Volume (2026) | 2.69 Billion square feet |
| Market Volume (2031) | 3.18 Billion square feet |
| Growth Rate (2026 - 2031) | 3.41% CAGR |
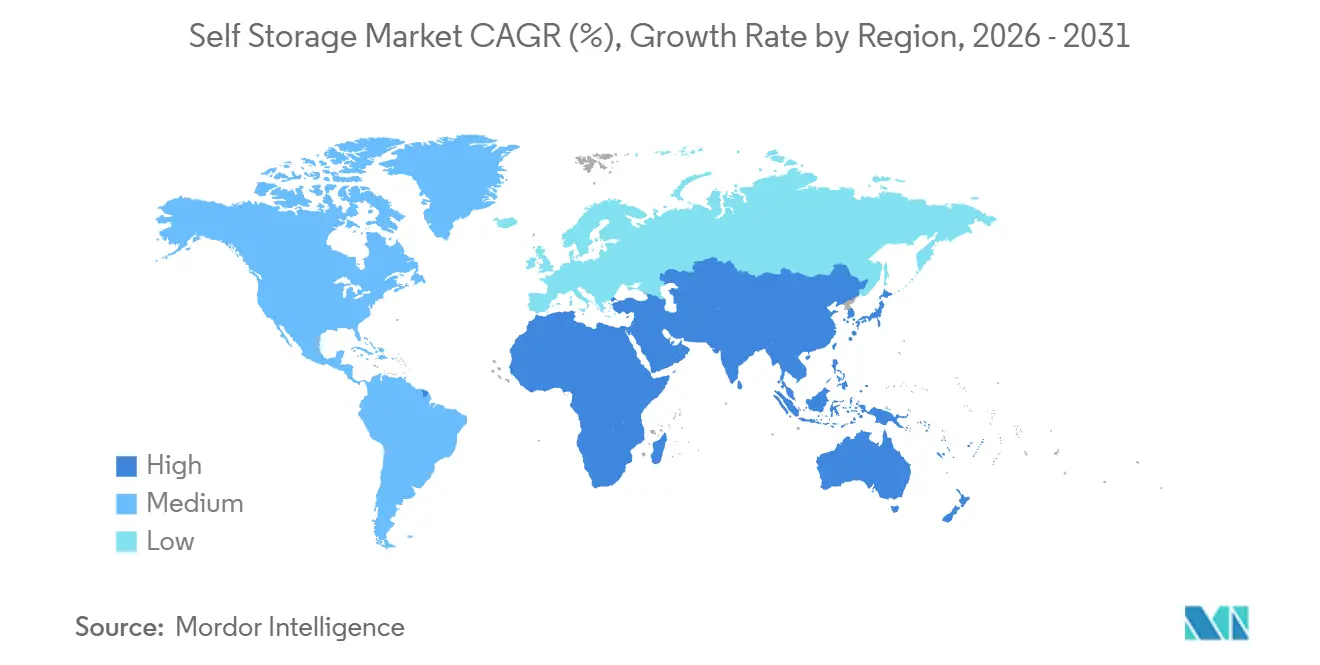
| Fastest Growing Market | Asia Pacific |
| Largest Market | North America |
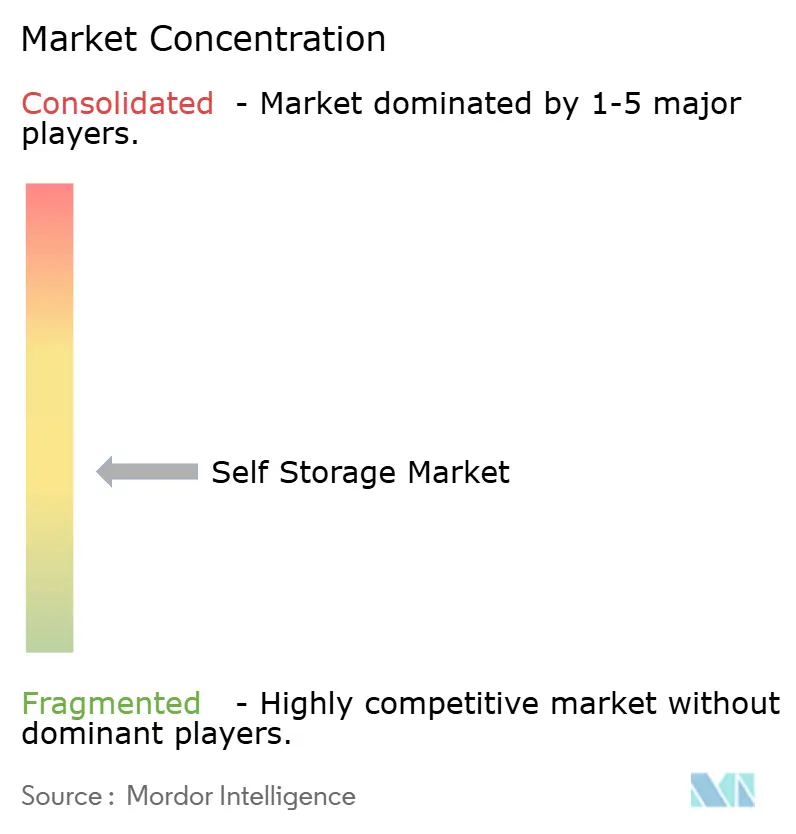
| Market Concentration | Medium |
Major Players *Disclaimer: Major Players sorted in no particular order Image © Mordor Intelligence. Reuse requires attribution under CC BY 4.0. | |
Self Storage Market Analysis by Mordor Intelligence
The Self Storage Market size in terms of lettable area is expected to increase from 2.59 Billion square feet in 2025 to 2.69 Billion square feet in 2026 and reach 3.18 Billion square feet by 2031, growing at a CAGR of 3.41% over 2026-2031. This moderate expansion conceals a shift toward premium monetization, as climate-controlled facilities, business tenants, and technology-enabled leasing models lift revenue per occupied square foot. Operators retrofit older assets with HVAC systems that double unit revenue and meet corporate cold-chain needs. Contact-free leasing platforms reduce staffing expenses, extend selling hours, and enable algorithmic price adjustments. Geographic momentum shifts to the Asia Pacific, where shrinking urban apartments, rising disposable income, and e-commerce adoption combine to increase paid-storage adoption. Large United States REITs pursue scale advantages, yet fragmentation leaves room for regional specialists who leverage zoning familiarity and micro-market pricing power.
Key Report Takeaways
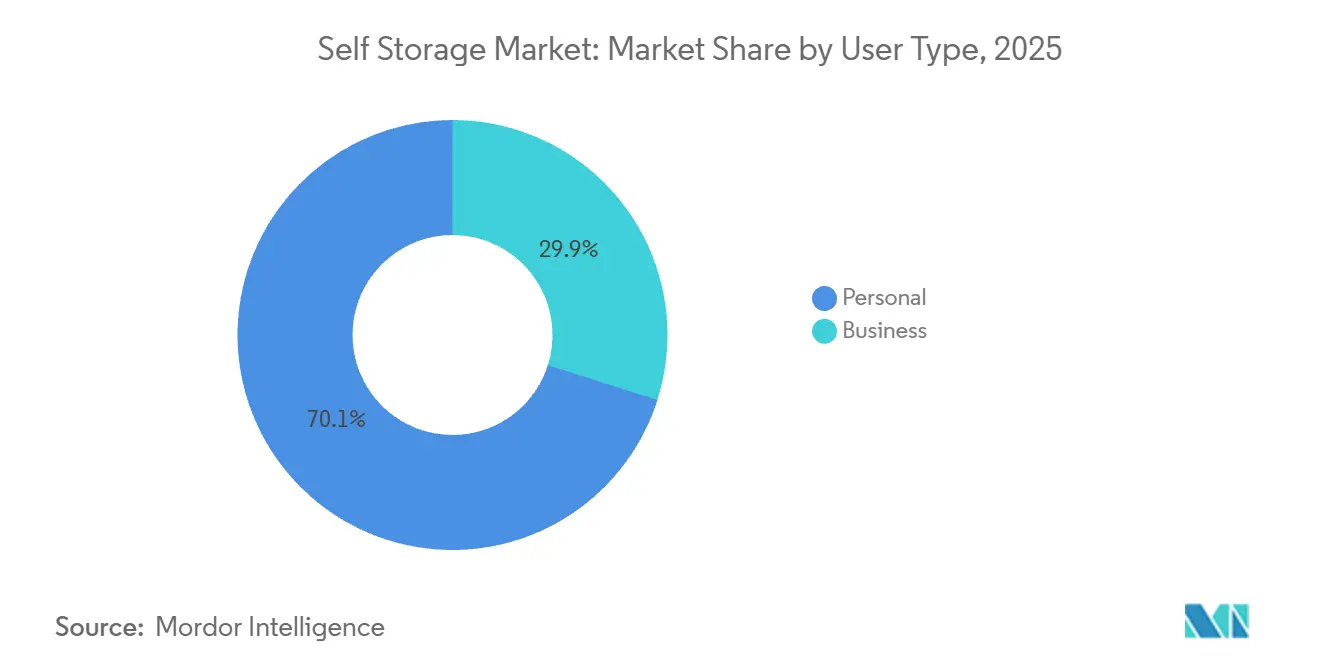
- By user type, personal users held a 70.12% share in 2025, while business tenants are expected to advance at a 5.81% CAGR through 2031.
- By storage type, climate-controlled units captured 54.64% of the self storage market size in 2025 and are expanding at a 6.71% CAGR through 2031.
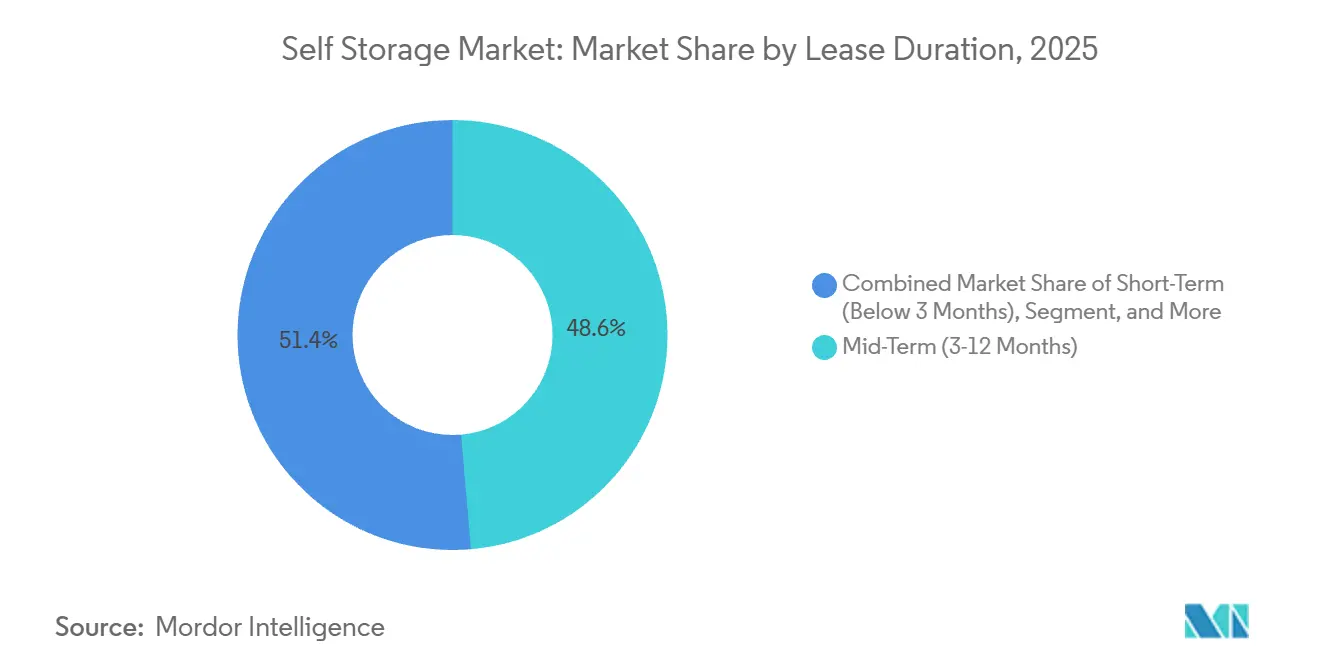
- By lease duration, mid-term contracts held 48.63% of the self storage market share in 2025, whereas short-term leases are growing at a 5.32% CAGR through 2031.
- By unit size, medium (50-100 sq ft) held 40.32% of the self storage market share in 2025, while small units under 50 square feet are expected to grow at a 6.12% CAGR through 2031 and command the highest revenue per square foot.
- By geography, North America retained 52.48% of global capacity in 2025; however, the Asia Pacific is projected to deliver a 5.09% CAGR through 2031.
- By company presence, Public Storage, Extra Space Storage, and CubeSmart together managed roughly 15% of North American capacity in 2025.
Note: Market size and forecast figures in this report are generated using Mordor Intelligence’s proprietary estimation framework, updated with the latest available data and insights as of January 2026.
Market Trends and Insights
Drivers Impact Analysis of Self Storage Market*
| Driver | (~) % Impact on CAGR Forecast | Geographic Relevance | Impact Timeline |
|---|---|---|---|
| Urbanization and Shrinking Living Spaces | +1.2% | Global, concentrated in Asia Pacific tier-1 cities, North America urban cores | Long term (≥ 4 years) |
| Proliferation of E-commerce Micro-Merchants | +0.9% | North America and Europe, expanding to Asia Pacific | Medium term (2-4 years) |
| Rising Residential Real-Estate Costs | +0.7% | North America, Europe, Asia Pacific metros | Long term (≥ 4 years) |
| Digitized, Contact-Free Leasing Platforms | +0.5% | Global, early adoption in North America and Europe | Short term (≤ 2 years) |
| Self-Storage as Micro-Fulfillment Hubs | +0.8% | North America and Europe, pilot projects in Asia Pacific | Medium term (2-4 years) |
| Climate-Resilient Asset Preservation Demand | +1.0% | Global, acute in coastal North America, Europe, Asia Pacific | Medium term (2-4 years) |
| Source: Mordor Intelligence | |||
Urbanization and Shrinking Living Spaces
Apartment footprints in Tokyo, Hong Kong, and Shanghai dropped below 500 square feet in 2025, forcing residents to externalize bulky possessions.[1]U.S. Census Bureau, “American Housing Survey 2025,” CENSUS.GOV Penetration climbed to 1.5 square feet per capita in these cities, triple rates in suburban locations with garage space. Developers in Singapore and Mumbai incorporate onsite storage into mixed-use towers that command an 8% rent premium. As Asia Pacific urbanization tops 65%, self storage becomes a structural need rather than a discretionary choice. North American downtowns follow a similar path, sustaining demand even when macro conditions soften.
Proliferation of E-commerce Micro-Merchants
A 2025 survey found 38% of online sellers under USD 500,000 annual revenue stage inventory in self storage rather than warehouses. These tenants stay 40% longer and pay 25%-35% premiums for drive-up loading and parcel acceptance. Climate control is essential for electronics and cosmetics, enabling operators to charge rates 50%-80% above ambient space. Micro-merchants offer counter-cyclical resilience because layoffs prompt side-hustle formation that inflates storage demand during downturns.
Climate-Resilient Asset Preservation Demand
Heat waves topping 110 °F in Phoenix and humid spikes above 80% in Houston damaged goods in conventional units and pushed insurers to raise premiums 15%-25%.[2]Insurance Information Institute, “Commercial Property Insurance Trends 2025,” III.ORG Operators responded by converting ambient buildings to HVAC-equipped facilities that double revenue per square foot. Pharmaceutical distributors and wine collectors now require strict temperature bands, and their willingness to pay sustains investment returns even in slow-growth metros. Regulators increasingly view climate resilience as a public-safety concern, creating a compliance moat for early adopters.
Digitized, Contact-Free Leasing Platforms
Smart-lock and mobile-app leasing captured more than 20% of new rentals at Extra Space Storage in 2025. Automation cut per-facility labor costs 30% and lifted revenue per available square foot by up to 12% through real-time surge pricing. Digital-native renters aged 25-35 adopted app-based contracts at a 60% higher rate than walk-in customers. Cyber-insurance carriers now demand two-factor authentication, adding USD 200-USD 400 per unit in retrofit costs. Operators able to absorb that expense gain a durable acquisition-cost advantage over small independents.
Restraints Impact Analysis of Self Storage Market*
| Restraint | ~ (%) Impact on CAGR Forecast | Geographic Relevance | Impact Timeline |
|---|---|---|---|
| Stringent Zoning and Land-Use Regulations | -0.6% | North America urban cores, Europe metro areas | Medium term (2-4 years) |
| Oversupply Pockets in Mature Metros | -0.4% | North America Sunbelt cities, select European markets | Short term (≤ 2 years) |
| Escalating Insurance Premiums from Extreme Weather | -0.3% | Coastal North America, flood-prone Europe and Asia Pacific | Medium term (2-4 years) |
| Cyber-Security Risks for Smart Facilities | -0.2% | Global, acute in North America and Europe with high IoT adoption | Short term (≤ 2 years) |
| Source: Mordor Intelligence | |||
Stringent Zoning and Land-Use Regulations
Portland, Seattle, and San Francisco reclassified self storage as industrial in 2025, imposing setbacks, parking mandates, and design reviews that delay approvals 18-36 months. European councils in London and Paris cap storage growth below 2% even as demand climbs 5%-7%. Incumbents with grandfathered sites obtain pricing power, but new entrants face steep legal and holding costs that deter capacity additions, shaving roughly 0.6 percentage points from the global CAGR.
Oversupply Pockets in Mature Metros
United States Sunbelt cities added 15%-25% new capacity between 2022 and 2024, resulting in occupancy rates near 82% and forcing 10%-15% rate cuts. Large REITs acquired distressed assets at discounts and shuttered surplus space to stabilize rents, yet recovery in the most saturated submarkets may not arrive before 2027. The divergence creates a two-speed landscape where coastal constraints enable a 4%-6% rate growth while oversupplied interiors lag.
*Our forecasts treat driver/restraint impacts as directional, not additive. The impact forecasts reflect baseline growth, mix effects, and variable interactions.
Self Storage Market Segment Analysis
By User Type:
Business Tenants Drive Premium RevenueBusiness tenants occupied 29.88% of capacity in 2025 and were advancing at a 5.81% CAGR through 2031, yet generated more than 40% of total revenue, as their average lease term exceeded two years. These customers pay 25%-35% premiums for 24-hour access, package handling, and reinforced floors, lifting the self storage market size for commercial users faster than the headline rate. E-commerce sellers, contractors, and seasonal retailers prefer month-to-month contracts that avoid multi-year warehouse leases. Personal customers account for 70.12% of the share, but their churn raises cleaning and remarketing costs, which dilute margins.
Operators now design mixed-use layouts where ground-floor commercial units cross-subsidize upper-floor personal lockers. In logistics hubs such as New Jersey and Southern California, business tenants already control 50%-60% of climate-controlled inventory, underscoring the profitability gap with personal users. As more REITs court corporate accounts, competitive emphasis shifts from price to workflow integration, deepening the value pool inside the self storage market.


By Storage Type:
Climate Control Commands Premium GrowthClimate-controlled facilities, which represented 54.64% of the total capacity, captured an outsized share of revenue in 2025 and are expected to expand at a 6.71% CAGR through 2031. Extreme weather losses and rising insurer requirements accelerate conversions, expanding the self storage market share for conditioned space each year. Operators charge premiums of 50%-80% over ambient units, and business tenants willingly pay to protect their high-value inventory.
Conversely, non-climate stock thrives in temperate or rural settings where upgrade costs would not be recouped. Portable container services remain a niche due to logistical complexity, and vehicle storage experiences regional strength in states with strict homeowner association rules against driveway parking. Execution focus, therefore, revolves around matching micro-climate risk to asset mix in order to maximize the self-storage market size captured per location.
By Lease Duration:
Short-Term Flexibility Gains TractionMid-term agreements between 3-12 months still hold 48.63% of contracts, but month-to-month rentals are the fastest climber as gig-economy workers and project-based companies avoid commitment. Each new short-term lease generates ancillary move-in fees and insurance sales, resulting in monthly revenue 20%-30% higher than that of long-term tenants. Short-term leases are growing at a 5.32% CAGR through 2031. Operators respond by eliminating annual-contract discounts and applying 8%-12% rate escalators, lifting the self storage market size attributed to short-stay users.
Long-duration customers provide occupancy stability but constrain the ability to implement dynamic pricing. As digital channels reduce acquisition costs, operators willingly trade vacancy risk for higher effective rates, a pivot expected to keep reshaping the self storage market through 2031.

By Unit Size:
Small Units Capture Urban DensityUnits under 50 square feet achieve 95% occupancy in New York, San Francisco, and London, and earn 40%-60% more revenue per square foot than larger units. Micro-entrepreneurs and urban minimalists value central locations over size, and operators monetize scarcity by charging USD 1.50-USD 2.50 per square foot on compact lockers. Small units under 50 square feet accounted for a 6.12% CAGR through 2031.
Medium sizes between 50-100 square feet serve mainstream residential moves but face margin pressure from both ends of the spectrum. Medium (50-100 sq ft) unit size held 40.32% of the self storage market share in 2025. Large units above 100 square feet attract contractors and downsizers in suburban corridors, while mega units double as low-cost warehouses for e-commerce sellers. Optimal development strategy now skews toward bifurcation, dense-city infill sites favor micro-lockers, whereas suburban parcels emphasize drive-up bays, balancing the self storage market share across formats.
Geography Analysis
North America Self Storage Market
North America held 52.48% of the global capacity in 2025, with a per-capita penetration of 9.5 square feet.[3]Self Storage Association, “Industry Data Report 2025,” SELFSTORAGE.ORG Occupancy gaps emerged between saturated Sunbelt metros, such as Phoenix and Dallas, which hovered near 82%, and coastal cities, where zoning barriers keep facilities full at 95% and allow for 4%-6% annual rent increases. Canada mirrors the United States profile, while Mexico advances quickly as middle-class consumers embrace external storage.
APAC Self Storage Market
The Asia Pacific region posts the fastest growth rate of 5.09%, driven by Chinese and Indian cities where apartment sizes typically fall below 500 square feet, and urbanization surpasses 60%. Japan continues to expand steadily amid an aging population and a climate-controlled demand for humidity protection. Australia and New Zealand focus on consolidating existing facilities rather than undertaking greenfield builds, resulting in a moderate 2.8% growth.
EMEA and LATAM Self Storage Market
Europe growth rate is 3.6%, although disparities persist. The United Kingdom resembles a mid-maturity North American market, with 4.5 square feet per capita, whereas Germany, France, and Spain have lower figures, offering a runway for Shurgard and Safestore. Central Europe, highlighted by recent Polish acquisitions, unlocks incremental demand among e-commerce merchants. Beyond the core regions, Latin America, the Middle East, and Africa together account for less than 8% of supply but expand 6%-8% as expatriate populations and e-commerce adoption scale in cities such as São Paulo and Dubai.

Regulatory Landscape
Self storage regulation remains decentralized, with operating requirements set mainly through local land-use and building approvals and state or provincial lien and consumer-protection rules rather than a single global licensing regime. In the United States, zoning is still a binding constraint in dense metros. Portland, Seattle, and San Francisco reclassified self storage as industrial in 2025, extending entitlement timelines, while New York City advanced a more direct operator-compliance model when the Department of Consumer and Worker Protection published proposed rules in April 2026 for licensing, fee disclosure, and penalty schedules for self-storage facilities and storage warehouses under 2025 local laws.
Outside North America, formal operating standards are emerging alongside rapid adoption in Asia Pacific. China issued GB/T 47529-2026 for operation and management of self-storage, and Vietnam introduced TCVN 14317:2025 covering technical specifications for logistics and self-storage services. Alongside these standards, industry bodies such as the Self Storage Association highlighted lien-law modernization as a 2026 policy focus across multiple US states, reinforcing the shift toward documented notifications, auditable records, and tighter process discipline in delinquency and auction workflows.
Value Chain Analysis
The self storage value chain starts with site sourcing and entitlement (zoning, permitting, building code, and fire-safety signoffs), followed by facility development or retrofit, and then ongoing operations that combine property management, security and access control, utilities (notably HVAC for climate-controlled units), and tenant-facing sales and service. Operators increasingly run a technology-led operating stack to drive delivery: cloud property-management systems (PMS) manage unit inventory, leasing, billing, and revenue management, while IoT components (smart locks, gate controllers, cameras, and environmental sensors) enable contact-free move-ins, remote monitoring, and exception-based staffing models.
Upstream suppliers include builders and MEP contractors (HVAC and electrical), security hardware vendors, and software providers integrating data across the portfolio. Recent ecosystem moves point to greater open integration and analytics-led decisioning: Tenant Inc. opened its Nectar API in July 2026 to connect tools directly with operator PMS data, and CRED iQ expanded its partnership with TractIQ in June 2026 to bring a large pool of CMBS-financed self-storage performance data into AI underwriting workflows. On the demand and distribution side, online booking and digital leasing have become primary acquisition channels, while third-party management platforms and centralized call centers increasingly help brands extend into smaller markets without proportional on-site staffing.
Competitive Landscape
The three largest United States REITs controlled roughly 15% of North American square footage in 2025, leaving a fragmented tail of regional chains and independents. North America retained 52.48% of global capacity in 2025. Consolidation accelerated when Extra Space Storage acquired Life Storage in November 2025, creating a leader with 3,800 facilities across the country. Technology is the chief battleground; smart-lock systems and pricing algorithms cut labor costs 30% and raise revenue 8%-12%.
Door-to-door startups, such as Clutter and MakeSpace, pursue logistics-bundled models that circumvent facility visits; however, fleet and labor costs require high density to break even. Established operators can counter by adding last-mile delivery partnerships or purchasing portable container firms. In Europe, Shurgard and Safestore invest in Central European roll-ups while Big Yellow targets London infill sites with ESG-rated new builds. The Asia Pacific features a mix of domestic champions and REIT entrants. Storefriendly leverages brand localization in tier-1 Chinese cities, whereas National Storage REIT consolidates Australia and New Zealand through discounted buyouts. Asia Pacific posts a 5.09% CAGR through 2031.
Competitive intensity hinges on technology adoption rather than price wars. Operators owning the data advantage maximize yield management and cross-sell insurance. Smaller independents rely on neighborhood knowledge but risk margin squeeze without capital to digitize. The market’s middle tier is likely to shrink through takeovers by scale players or capital exits by 2028.
Self Storage Industry Leaders
Public Storage
Extra Space Storage Inc.
U-Haul International Inc.
CubeSmart LP
National Storage Affiliates Trust
- *Disclaimer: Major Players sorted in no particular order
Self Storage Market Companies Covered in this Report
- Public Storage
- Extra Space Storage Inc.
- U-Haul International Inc.
- CubeSmart LP
- National Storage Affiliates Trust
- Life Storage Inc.
- Safestore Holdings PLC
- StorageMart
- Shurgard Self-Storage SA
- Big Yellow Group PLC
- Prime Storage Group
- Metro Storage LLC
- SmartStop Asset Management LLC
- Clutter Inc.
- MakeSpace Inc.
- Kennards Self Storage
- Access Self Storage Ltd.
- Urban Self Storage Inc.
- Global Self Storage Inc.
- World Class Capital Group LLC (Great Value Storage)
- Amsdell Cos./Compass Self Storage
- All Storage
- Storage King Pty Ltd.
- Storefriendly Self Storage Group

Market Opportunities and Future Outlook
One major opportunity is compliance-linked digitization, where lien-law modernization and city-level disclosure regimes elevate the value of auditable workflows. April 2026 rulemaking by New York City Department of Consumer and Worker Protection on licensing and fee transparency, together with the Self Storage Association 2026 legislative agenda focused on lien updates across multiple states, increases operator demand for integrated PMS, digital notice delivery, payment automation, and event logs that support defensible auctions and dispute handling. Vendors and operators that package these capabilities with standardized operating procedures can differentiate, especially among regional and independent facilities facing rising legal and administrative complexity.
Another opportunity is the build-out of connected, remotely managed facility operations using AI, open APIs, and unit-level sensing, which supports premium monetization in climate-controlled and business-tenant segments. 2026 activity shows operators and managers shifting from point tools to unified platforms: Storage Asset Management partnered with StorageDefender in March 2026 to standardize unit-level monitoring across a multi-state portfolio, and OpenTech Alliance deployments such as Here Self Storage in Parla, Madrid (June 2026) illustrate demand for integrated access control and wireless infrastructure as part of new facility openings. In parallel, the emergence of national standards in Asia (including China GB/T 47529-2026 and Vietnam TCVN 14317:2025) creates whitespace for standardized operating playbooks and technology stacks that can be replicated across newer self-storage markets where modern, compliance-ready facilities compete against informal storage alternatives.
Recent Industry Developments in Self Storage Market
- July 2026: Public Storage priced a USD 900 million senior notes offering to fund its pending acquisition of National Storage Affiliates Trust. The financing move underlined continued consolidation in North American self storage and supported balance-sheet capacity for platform-scale integration.
- June 2026: Public Storage entered an agreement to acquire Public Storage Canada, marking a strategic entry into major Canadian markets. The transaction broadened geographic exposure beyond the United States and created a larger cross-border operating footprint for standardized pricing, marketing, and technology practices.
- December 2025: Extra Space Storage closed its USD 12.7 billion acquisition of Life Storage, adding about 1,300 facilities across 36 states. The combination expanded scale advantages in revenue management, technology deployment, and procurement, while tightening competitive pressure on smaller regional operators.


Self Storage Market Report Scope and Research Methodology
Market Definition and Coverage
This market is defined as the supply and demand for self-storage space offered through purpose-built facilities, where individuals or businesses rent a secured unit for their own access and control. Sizing is expressed in lettable area (square feet) across major regions.
Scope exclusions: It excludes informal storage arrangements like private garage rentals and managed valet storage models where items are picked up, inventoried, and stored without the renter controlling a dedicated unit.
Segments Covered in This Report
- By User Type
- Personal
- Business
- By Storage Type
- Climate-Controlled
- Non-Climate-Controlled
- Portable / Container-Based
- Vehicle and Specialty (RV, Boat, Wine)
- By Lease Duration
- Short-Term (Below 3 Months)
- Mid-Term (3-12 Months)
- Long-Term (Above 12 Months)
- By Unit Size
- Small (Below 50 sq ft)
- Medium (50-100 sq ft)
- Large (100-200 sq ft)
- Mega (Above 200 sq ft)
- By Geography
- North America
- United States
- Canada
- Mexico
- South America
- Brazil
- Argentina
- Rest of South America
- Europe
- Germany
- United Kingdom
- France
- Italy
- Spain
- Russia
- Rest of Europe
- Asia Pacific
- China
- Japan
- South Korea
- India
- Australia
- New Zealand
- Rest of Asia Pacific
- Middle East
- United Arab Emirates
- Saudi Arabia
- Turkey
- Rest of Middle East
- Africa
- South Africa
- Nigeria
- Kenya
- Rest of Africa
- North America
Data Sources, Market Sizing, and Validation
Desk Research
Desk work starts with mapping how capacity is created and consumed, since most public data talks about real estate supply rather than a simple product shipment count. We relied on non-paywalled references such as government census and housing mobility statistics, commercial building and construction permit releases, central bank interest rate series, and macro indicators from sources such as the World Bank and OECD for population, urbanization, and small business trends.
We also reviewed operator websites for facility footprints and service definitions, along with investor presentations and annual filings where available to understand occupancy, rent per square foot, and expansion plans. To keep assumptions grounded, we cross-checked expansion signals using an import and export shipment-level database for selected build-out materials where it was relevant, and a news and financials subscription for deal and pipeline tracking. This list is illustrative, and many other public sources were also consulted for data collection, validation, and clarification.
Primary Interviews and Surveys
Primary work focused on validating what drives occupied space and pricing in each region, including facility operators, real estate advisors, and service providers linked to development and operations. We also spoke with business users and moving-related ecosystem participants so demand shifts, lease duration patterns, and climate-controlled adoption could be checked against what was visible in desk findings.
Distribution of primary research fieldwork respondents
| Company type | Respondent position | Region |
|---|---|---|
| Top tier: 25% | CXOs: 13% | APAC: 41% |
| Mid tier: 58% | Functional/Unit leaders: 30% | EMEA: 34% |
| Smaller Players: 17% | Managers: 57% | Americas: 25% |
Market-Sizing & Forecasting
The core model uses a top-down approach where regional self-storage capacity is reconstructed from facility counts, average rentable square feet, and changes in new supply over time, and then it is adjusted for occupancy to keep the demand side realistic. To pressure-test totals, we also build selective bottom-up approximations using sampled facility size distributions, advertised unit mixes, and rent-per-square-foot ranges, which helps us correct outliers before finalizing.
Inputs used in the model include lettable area growth, occupancy trends by maturity of the local market, share of climate-controlled space, average achieved rent per square foot, and the pace of new facility additions relative to population growth and residential moves. Where direct capacity additions were not clear, gaps were handled using construction pipeline signals and expert checks on typical ramp-up periods, and then results were re-balanced at the regional level. Forecasting is done using scenario analysis supported by simple multivariate regression, where drivers like housing turnover, small business formation, and the interest rate environment inform expansion and pricing, and then assumptions are aligned to what primary respondents see as a reasonable base case.
Data Validation & Update Cycle
Outputs are validated by comparing implied space per capita, occupancy stability, and rent intensity trends against independent signals gathered in research. If a region shows an unexpected jump, the underlying drivers are reviewed again, and follow-up calls are triggered to confirm whether it was a short-term pricing event, a supply spike, or a definition mismatch.
Before sign-off, the model and assumptions go through multiple analyst reviews, including checks for currency timing where needed and consistency across years and regions. The report is refreshed annually, and interim updates are made when material events occur, including major capacity additions, sharp interest rate changes, or visible demand shocks. Right before delivery, a final pass is completed so clients receive the most current view available.
Mordor Intelligence's Self Storage Market Size Compared With Other Published Estimates
Published market sizes for self storage often do not match because the underlying unit of measurement is not always the same, and the definition of what counts as self-storage can shift between sources. Differences also show up when one publisher prioritizes revenue totals while another tracks physical capacity, which then changes how growth is interpreted.
The main spread comes from whether the study tracks lettable area (square feet) versus revenue, and whether managed valet storage or general warehousing is blended into the count. A second driver is how occupancy and rent progression are treated over the forecast period, since small changes in assumed stabilization time and pricing per square foot can move the total meaningfully. Keeping the scope tied to tenant-controlled units and using capacity, occupancy, and expansion checks is the approach applied here, and it is also why the headline figure is stated in area terms near the end of the sizing discussion, consistent with Mordor Intelligence.
Benchmark comparison
| Source | Market Size | Gaps in Research Methodology |
|---|---|---|
| Mordor Intelligence | USD 2.59 B (2025) | |
| Global Consultancy A | USD 59.08 B (2024) | This estimate is revenue-based and uses a different time window, which can include pricing and occupancy effects that are not directly comparable to a lettable-area sizing framework. |
| Industry Research Group B | USD 63.98 B (2025) | This figure is stated as global revenue and can be influenced by assumed rent growth and currency timing, and it may also fold adjacent storage models into the revenue pool depending on definitions. |
The table shows that the widest gaps come from mixing revenue metrics with physical capacity measures, and from small assumption differences around rent and occupancy dynamics. By keeping the measurement consistent and checking it against observable capacity and utilization signals, we aim to provide a transparent number that can be rechecked and updated with clear steps each year.


Key Questions Answered in the Report
How large is the self storage market in 2026?
The market encompasses 2.69 billion square feet in 2026 and is projected to reach 3.18 billion square feet by 2031.
Which segment is growing fastest within self storage?
Climate-controlled units lead with a 6.71% CAGR because tenants pay premiums to protect temperature-sensitive goods.
Why are business tenants important for operators?
Business users stay longer and pay 25%-35% premiums for features like 24-hour access, lifting revenue density.
Which region shows the highest growth momentum?
Asia Pacific posts a 5.09% CAGR through 2031 as urbanization and small apartment sizes boost paid-storage adoption.
How are technology platforms changing the sector?
Contact-free leasing and smart-lock systems cut labor costs 30% and enable dynamic pricing that raises yield per square foot.
What risks could slow industry growth?
Zoning restrictions in dense cities and oversupply pockets in Sunbelt metros can suppress new construction and pricing power.
Page last updated on:


