Market Overview
| Study Period | 2021 - 2031 |
|---|---|
| Forecast Data Period | 2026 - 2031 |
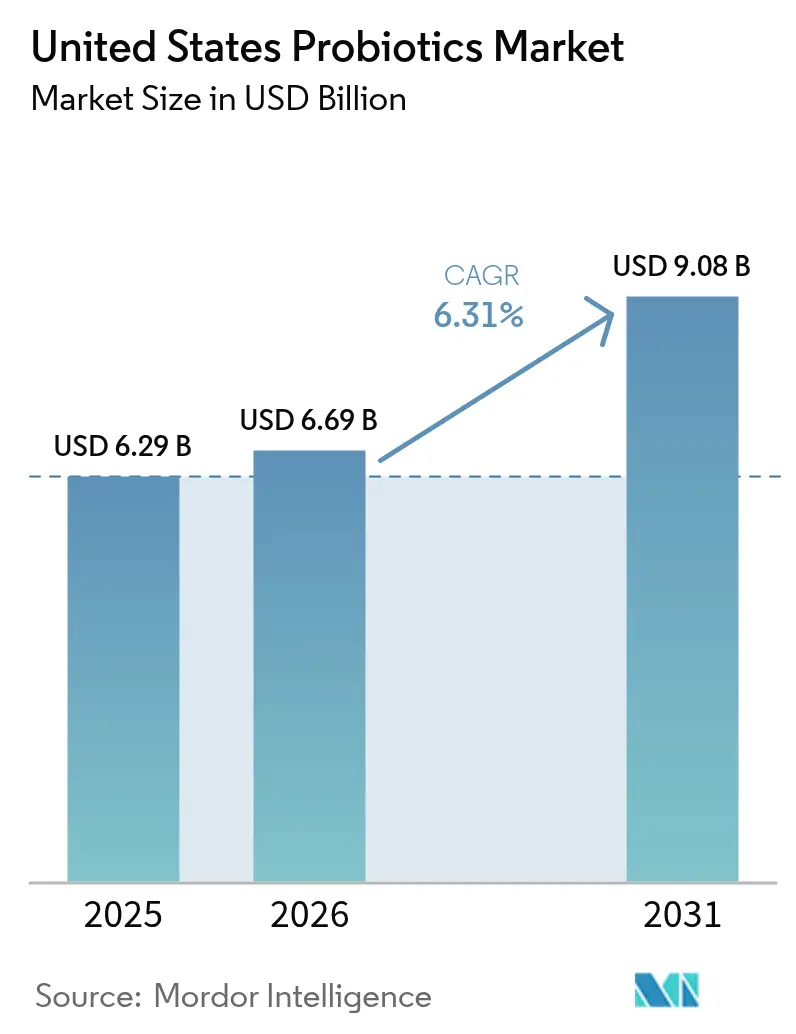
| Base Year Market Size (2025) | USD 6.29 Billion |
| Market Size (2026) | USD 6.69 Billion |
| Market Size (2031) | USD 9.08 Billion |
| Growth Rate (2026 - 2031) | 6.31% CAGR |
| Market Concentration | Medium |
Major Players
*Disclaimer: Major Players sorted in no particular order Image © Mordor Intelligence. Reuse requires attribution under CC BY 4.0. |
|
United States Probiotics Market Analysis by Mordor Intelligence
The United States probiotics market size in 2026 is estimated at USD 6.69 billion, growing from 2025 value of USD 6.29 billion with 2031 projections showing USD 9.08 billion, growing at 6.31% CAGR over 2026-2031. Over the medium term, increasing health consciousness and the consumers' preference for nutritious foods are expected to drive the market. Probiotics are a driving force within the booming digestive health supplement category, and they are being consumed by people of all age groups. However, the major consumption is observed among the millennials, due to the growing awareness about health and wellness through multi-channel publicity, which has influenced their consumption pattern to a large extent. The healthcare expenditure pattern in the country is rising with the growing geriatric population, advanced technology, better medical facilities, and a rise in the number of insured people. These factors are, in turn, driving the overall sale of probiotics in the country.
Key Report Takeaways
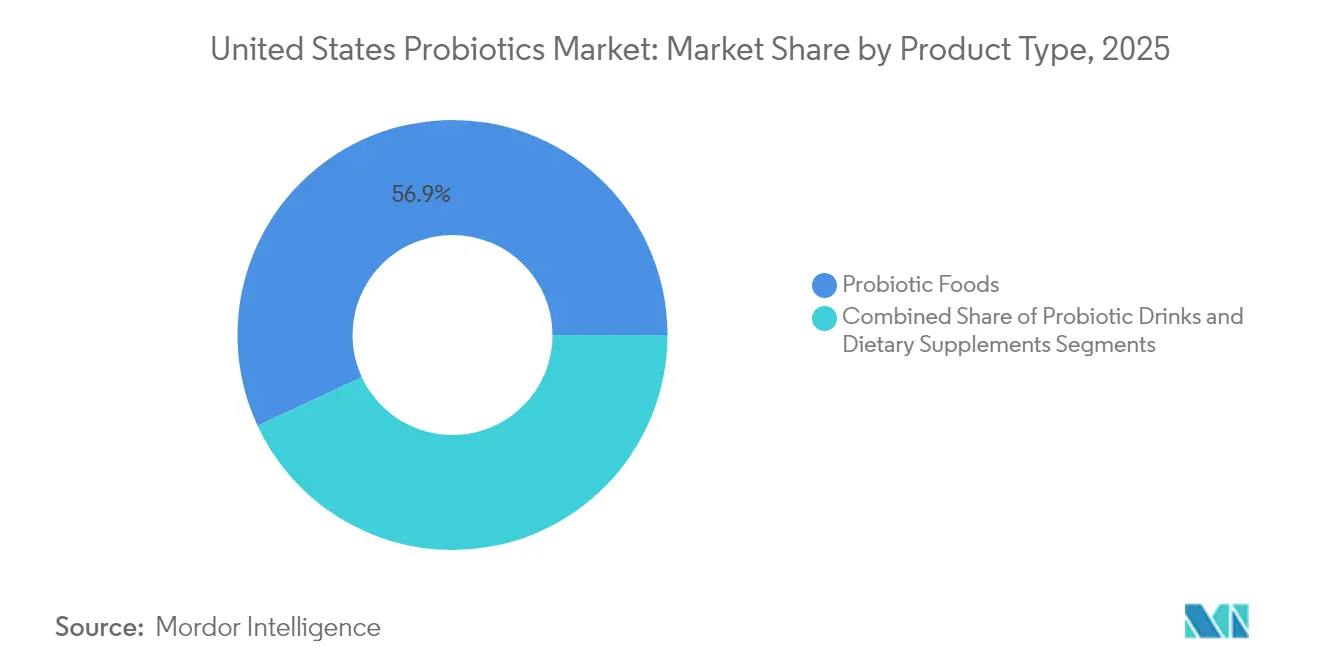
- By product type, probiotic foods held 56.93% of the United States probiotics market share in 2025, while probiotic drinks are poised to register the fastest 8.05% CAGR from 2026-2031.
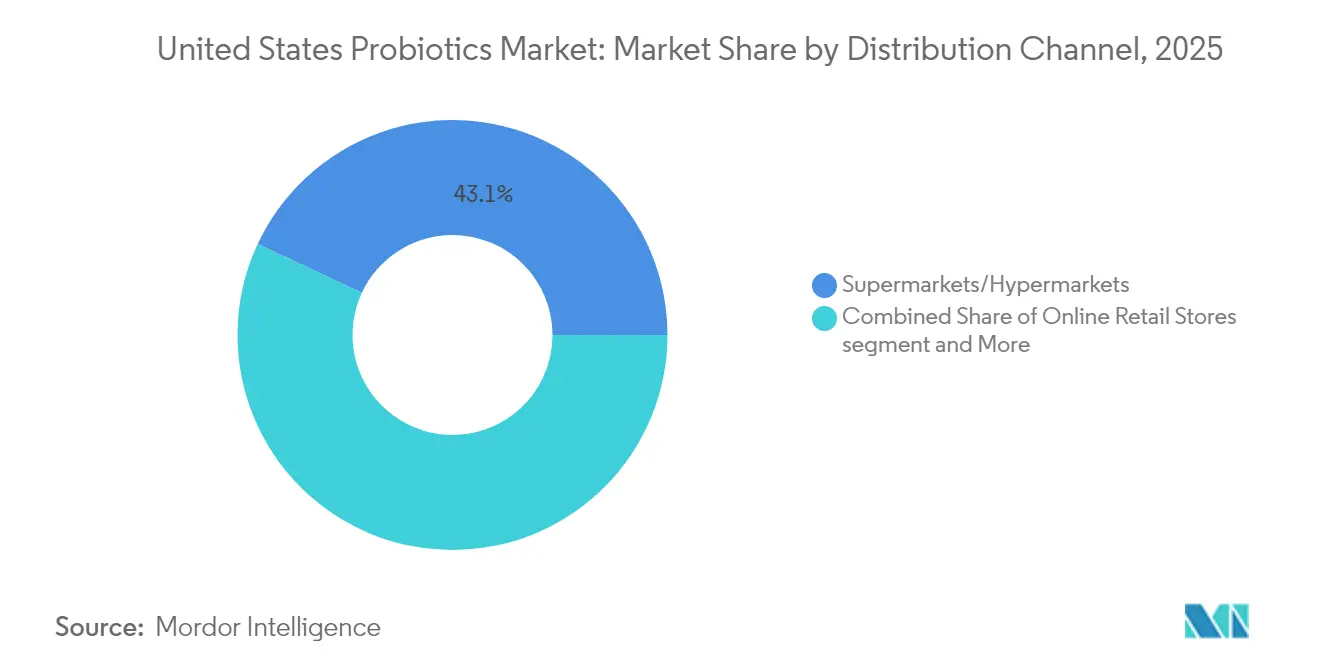
- By distribution channel, supermarkets/hypermarkets captured 43.05% of the United States probiotics market share in 2025; online retail stores are projected to expand at a 6.52% CAGR through 2031.
Note: Market size and forecast figures in this report are generated using Mordor Intelligence’s proprietary estimation framework, updated with the latest available data and insights as of 2026.
United States Probiotics Market Trends and Insights
Drivers Impact Analysis*
| Driver | (~) % Impact on CAGR Forecast | Geographic Relevance | Impact Timeline |
|---|---|---|---|
| Growing understanding of gut health benefits drives increased probiotic consumption | + 1.8% | Nationwide, with strongest adoption in urban centers | Medium term (2-4 years) |
| Preventive healthcare trends encourage regular probiotic supplementation | + 1.5% | Nationwide, particularly among Gen Z and Millennials | Long term (≥ 4 years) |
| Development of dairy-free and vegan probiotic options expands consumer reach | + 1.2% | United States West Coast and metropolitan areas | Medium term (2-4 years) |
| E-commerce growth improves access to premium probiotic products | + 1.0% | Nationwide, with rural areas showing highest growth rates | Short term (≤ 2 years) |
| Recognition of probiotics' immune system benefits strengthens market demand | + 0.9% | Nationwide, accelerated by post-COVID health awareness | Short term (≤ 2 years) |
| Rising demand for functional and fermented foods increases probiotic consumption | + 0.7% | Nationwide, concentrated in health-conscious demographics | Long term (≥ 4 years) |
| Source: Mordor Intelligence | |||
Growing understanding of gut health benefits drives increased probiotic consumption
Growing consumer awareness of the gut-brain connection and microbiome health has established probiotics as essential supplements for wellness. Research demonstrating the influence of probiotics on neurotransmitter production and cognitive function has expanded their applications beyond digestive health. Consumers now recognize gut health as fundamental to overall wellness, leading to increased adoption of probiotic supplements across various delivery formats. The transition from treating symptoms to preventive health care indicates a broader understanding of how microbiome health affects chronic conditions, increasing probiotic demand across all age groups. According to the American Medical Association's data from 2023, health spending in the United States increased by 7.5% to USD 4.9 trillion or USD 14,570 per capita [1]Source: American Medical Association, "Trends in Health Care Spending", ama-assn.org . This shift has particularly resonated with health-conscious consumers seeking natural solutions for mental and physical well-being. The informed approach to consumption indicates continued market growth as consumers incorporate probiotics into their daily health routines, supported by ongoing scientific research validating their benefits. The market has responded with diverse product offerings, including specialized strains targeting specific health concerns and innovative delivery systems to enhance efficacy and convenience.
Preventive healthcare trends encourage regular probiotic supplementation
Healthcare cost inflation and insurance coverage limitations have shifted consumer focus toward preventive strategies that reduce long-term medical expenses. Probiotics align with this preventive approach by supporting immune function and potentially reducing infection risk, appealing to cost-conscious consumers seeking to avoid expensive treatments. The trend is particularly pronounced among younger generations who prioritize wellness investments over traditional healthcare spending, viewing probiotics as insurance against future health problems. In addition, corporate wellness programs increasingly recognize probiotics' potential to reduce employee sick days and healthcare claims, creating institutional demand that supplements individual consumer purchases. This preventive mindset creates sticky consumption patterns where users maintain regular probiotic intake regardless of immediate health status, providing revenue stability for manufacturers.
Development of dairy-free and vegan probiotic options expands consumer reach
The demand for plant-based and dairy-free food products is growing in the country due to the increasing number of lactose-intolerant consumers. This has led to higher demand for lactose-free probiotics. Advanced fermentation techniques using lactic acid bacteria enhance nutritional functionality while reducing anti-nutritional factors in plant-based ingredients, improving product efficacy and consumer acceptance. These fermentation processes also help develop better taste profiles and texture in plant-based products, making them more appealing to mainstream consumers. The expansion beyond dairy products has created new distribution channels, particularly in natural food stores and specialty retailers. Health food stores, online marketplaces, and conventional supermarkets have also increased their shelf space for these products to meet growing consumer demand. Additionally, the rise of direct-to-consumer channels has made these products more accessible to health-conscious consumers.
E-commerce growth improves access to premium probiotic products
According to a 2023 survey by DHL Group, approximately 40% of online consumers in the United States maintained supplement subscriptions [2]Source: DHL Group, “Global Online Shopper Survey 2023”, dhl.com. E-commerce platforms have established direct-to-consumer distribution channels, eliminating traditional retail markups. These platforms integrate educational resources to increase consumer awareness of probiotic benefits. The subscription model generates recurring revenue for manufacturers while ensuring consistent product usage, which addresses adherence challenges affecting probiotic effectiveness. E-commerce also facilitates personalized nutrition approaches, with companies offering microbiome testing and customized probiotic formulations based on individual bacterial profiles. The digital shift particularly benefits smaller, specialized probiotic companies that lack resources for extensive retail distribution but can compete effectively through targeted online marketing and superior product education.
Restraints Impact Analysis*
| Restraint | (~) % Impact on CAGR Forecast | Geographic Relevance | Impact Timeline |
|---|---|---|---|
| Consumer shift toward natural and fresh food alternatives | -0.8% | Nationwide, particularly among health-conscious millennials | Medium term (2-4 years) |
| Inconsistent labeling standards affecting market transparency | -0.6% | Nationwide, impacting consumer trust | Short term (≤ 2 years) |
| Technical limitations in probiotic preservation and formulation hinders growth | -0.5% | Nationwide, affecting product quality and shelf life | Long term (≥ 4 years) |
| Regional regulatory barriers delaying new product introductions | -0.4% | United States-Canada border trade, Mexico regulatory complexity | Medium term (2-4 years) |
| Source: Mordor Intelligence | |||
Consumer shift toward natural and fresh food alternatives
Health-conscious consumers increasingly question the necessity of processed probiotic supplements when natural fermented foods provide similar benefits with additional nutritional value. This skepticism toward manufactured products reflects broader clean eating trends where consumers prefer whole food sources over isolated compounds, potentially limiting supplement market growth. The farm-to-table movement and increased awareness of food processing impacts have elevated fresh, minimally processed alternatives in consumer preference hierarchies. However, this trend also creates opportunities for companies that can bridge the gap between natural and convenient, such as fresh probiotic beverages with shorter shelf lives but higher perceived authenticity. The challenge for manufacturers lies in communicating the specific advantages of standardized probiotic doses and targeted strain selection compared to variable bacterial content in traditional fermented foods.
Inconsistent labeling standards affect market transparency
The absence of mandatory probiotic labeling standards creates consumer confusion about bacterial strain identity, viable cell counts, and expiration dating, undermining confidence in product efficacy. Unlike pharmaceuticals, probiotic supplements can make structure-function claims without pre-market approval, leading to inconsistent quality and misleading marketing that damages category credibility. The Food and Drug Administration’s current framework under DSHEA allows significant variation in manufacturing standards and quality control, creating a race-to-the-bottom dynamic where inferior products undercut premium offerings in February 2024. International regulatory divergence complicates global supply chains and creates barriers for companies seeking to standardize products across United States markets. Industry self-regulation through organizations like the International Probiotics Association provides guidance but lacks enforcement mechanisms, requiring voluntary compliance that not all manufacturers embrace.
*Our forecasts treat driver/restraint impacts as directional, not additive. The impact forecasts reflect baseline growth, mix effects, and variable interactions.
Segment Analysis
By Product Type: Probiotic Foods Dominate While Drinks Accelerate Innovation
Probiotic Foods held a 56.93% market share in 2025, primarily due to consumer familiarity with yogurt-based products and robust dairy industry infrastructure supporting production and distribution. The segment's strength comes from yogurt's fermentation process, which provides optimal conditions for probiotic survival, supported by established cold-chain logistics. In addition, bakery products and breakfast cereals present new opportunities within this segment, using microencapsulation technology to protect probiotics during production while offering functional benefits in common food formats. Baby food and infant formula segments command premium prices as parents prioritize children's health, though Food and Drug Administration data from 2025 indicates regulatory requirements create development barriers.
While food products lead the market, probiotic drinks show the highest growth potential with an 8.05% CAGR projected through 2031, driven by convenience and innovative formulations targeting younger consumers. Kombucha and fermented tea products in the "Others" category demonstrate significant growth, combining traditional fermentation with modern flavoring and packaging that attracts health-conscious millennials and Gen Z consumers. The drinks segment's expansion aligns with beverage industry trends toward functional hydration and portable consumption, establishing probiotics as lifestyle products.


By Distribution Channel: Traditional Retail Leads While Digital Channels Transform Access
Supermarkets/hypermarkets hold a dominant 43.05% market share in 2025. Their success stems from extensive refrigerated display space and consumer preferences for examining health products in person. These retail formats enable effective cross-merchandising of probiotics with complementary items such as yogurt and organic foods. However, they face challenges from limited shelf space and inventory management priorities that favor fast-moving products over specialized probiotic items with slower sales cycles. While pharmacies and health stores offer valuable healthcare professional guidance and product expertise, their limited locations restrict broader market reach.
Online retail stores show the highest growth rate with a 6.52% CAGR through 2031. This growth is supported by subscription services that promote regular product consumption and direct consumer relationships, enabling personalized nutrition solutions. E-commerce platforms effectively deliver educational content about probiotic benefits, while user reviews provide valuable consumer validation. The online channel particularly resonates with younger consumers who conduct thorough product research and value home delivery for regular supplement purchases. Convenience stores serve immediate purchase needs but face limitations in product range due to restricted refrigeration capacity, primarily offering shelf-stable options that may have reduced bacterial viability compared to refrigerated products.
Geography Analysis
The United States demonstrates increasing adoption of probiotic products, with the Council for Responsible Nutrition reporting that 74% of Americans used dietary supplements, including probiotic supplements, in 2023 . This trend indicates the integration of probiotics into daily wellness protocols. Consumer understanding of strain-specific benefits has increased, resulting in selective probiotic utilization for distinct health objectives. The acceptance of premium pricing for clinically validated products has created an environment conducive to continuous market growth and product development.
Owing to the rising demand, the market players are launching new and innovative probiotic products in the market. For instance, in March 2023, Dairy Farmers of America and Good Culture introduced probiotic milk to the market. The Good Culture Probiotic Milk combined lactose-free milk with a patented probiotic that supported digestive and immune system health. The product came in whole and 2% reduced-fat varieties with extended shelf life (ESL). Each 12-fluid-ounce serving contained 1 billion probiotic cultures and provided vitamins A and D.
The market infrastructure in the United States features an extensive network of specialized health food stores and pharmacy chains equipped with dedicated probiotic sections. These retail establishments maintain proper refrigerated storage facilities to ensure product efficacy and quality. E-commerce has emerged as the fastest-growing distribution channel, particularly benefiting consumers in rural areas. Online platforms provide access to specialty health products that may be unavailable through traditional local retail outlets.
Regulatory Landscape
In the United States, probiotics are regulated based on intended use and claims rather than as a standalone category. Products positioned as dietary supplements fall under the Dietary Supplement Health and Education Act (DSHEA) framework and must comply with FDA labeling rules, including 21 CFR 101.36 for supplement labeling, while probiotic organisms used in conventional foods commonly rely on food-safety pathways such as GRAS determinations. The FDA does not pre-approve dietary supplements before marketing, placing the onus on manufacturers to ensure product safety and truthful, non-misleading labeling and advertising.
Regulatory attention intensified in 2026. In March 2026, the FDA held a public meeting to clarify the scope of dietary ingredient definitions for microbial ingredients under the FD&C Act, including probiotics within the dietary ingredient framework. In parallel, FDA guidance has supported quantitative labeling approaches for live microbial products, such as potency expressed in colony-forming units (CFUs), making label substantiation and robust quality systems important differentiators as the category expands across foods, beverages, and supplements.
Competitive Landscape
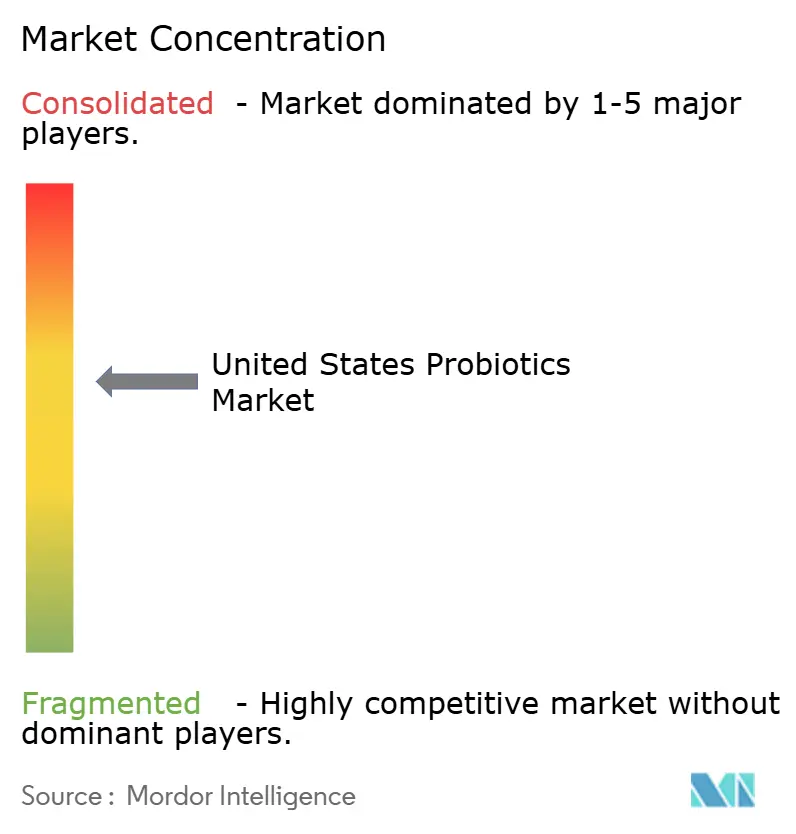
The United States probiotics market demonstrates moderate consolidation. The market comprises established food and pharmaceutical companies, specialized probiotic manufacturers, and biotechnology firms. Major players in the market include Danone SA, Nestle SA, BioGaia, Yakult Honsha, and Now Foods. Market leaders maintain their position through extensive distribution networks and brand recognition, while smaller companies focus on strain innovation, targeted health claims, and direct-to-consumer marketing approaches. Companies implement vertical integration strategies to control fermentation, manufacturing, and distribution processes, ensuring product quality and bacterial viability.
The industry's technological focus centers on microencapsulation techniques to enhance shelf life and bacterial survival rates, with companies developing proprietary coating technologies to gain competitive advantages. The market presents opportunities in personalized nutrition, where companies integrate microbiome testing with customized probiotic formulations to address individual bacterial profiles.
Biotechnology companies are developing next-generation probiotics using genetically modified organisms and postbiotic products that deliver bacterial metabolites without live organisms. These innovations address regulatory and stability challenges in current probiotic applications. Companies are expanding into new delivery formats, including probiotic-infused beauty products and pet health applications, broadening the market beyond human consumption.
United States Probiotics Industry Leaders
-
Danone SA
-
Yakult Honsha
-
Nestle SA
-
Now Foods
-
BioGaia AB
- *Disclaimer: Major Players sorted in no particular order

Market Opportunities and Future Outlook
Manufacturing and supply-chain investments highlight whitespace in high-quality, strain-stable production and differentiated formats across foods, drinks, and supplements. February 2026 VitaQuest opened a probiotics manufacturing suite at its Parsippany, New Jersey site, adding blending and encapsulation capacity and reporting a 100% capacity increase, reinforcing demand from brands that outsource encapsulated and gummy probiotic formats. In April 2026, Vidya opened a 28,750-square-foot probiotic manufacturing facility in Bunnell, Florida, designed with segregated lines for spore-forming versus non-spore-forming strains, aligning with customer needs for contamination control, strain handling, and repeatable quality. On the dairy side, Lifeway Foods scheduled completion (Q3 2026) of the final stages of its project to double kefir and fermented probiotic production capacity at its Waukesha, Wisconsin facility, signaling continued scale-up in refrigerated probiotic dairy.
Opportunity is also visible in product positioning and channel execution, especially symptom-specific and personalized propositions delivered through mass retail and subscription-friendly online models. The March 2026 FDA public meeting on dietary supplement ingredient scope elevated industry focus on clearer recognition of microbials, which supports companies investing in next-generation and precision approaches while staying within compliant structure-function messaging. At the same time, the market is broadening beyond traditional capsules and yogurts into daily-consumption formats that blend probiotics with complementary ingredients (for example, synbiotics combining probiotics and prebiotics, or functional beverages and snacks), providing room for brands that can validate strain identity, potency at expiration, and stability across non-traditional delivery systems.
Recent Industry Developments
- June 2026: NurtureBio announced a strategic collaboration with Lallemand Health Solutions to co-develop a breast milk-inspired synbiotic platform integrating proprietary strains with healthcare programs, expanding infant microbiome capabilities across channels.
- September 2025: Danone announced the acquisition of The Akkermansia Company to deepen its capabilities in next-generation biotics and microbiome science, strengthening access to proprietary strains and clinical know-how.
- September 2024: ZBiotics announced the launch of its Sugar-to-Fiber Probiotic Drink Mix as the company's second product, illustrating continued innovation in engineered probiotic formats beyond traditional digestive health.


Research Methodology Framework and Report Scope
Market Definition and Coverage
This market counts revenues earned in the United States from finished probiotic foods, beverages, and dietary supplements that contain viable strains and are sold for human consumption through retail, e-commerce, and healthcare-linked channels.
Scope exclusions: Animal feed additives, veterinary probiotic products, and non-viable cultures that are not sold as probiotics are excluded.
Segmentation Overview
-
By Product Type
-
Probiotic Foods
- Yogurt
- Bakery/Breakfast Cereals
- Baby Food and Infant Formula
- Other Probiotic Foods
-
Probiotic Drinks
- Dairy-based Drinks
- Fruit/Plant-based Drinks
- Others (Kombucha and Fermented Tea)
-
Dietary Supplements
- Capsules
- Tablets
- Powders
- Gummies
- Others
-
Probiotic Foods
-
By Distribution Channel
- Supermarkets/Hypermarkets
- Pharmacies/Health Stores
- Convenience Stores
- Online Retail Stores
- Other Distribution Channels
Data Sources, Market Sizing, and Validation
Desk Research
Desk work starts by locking a clear definition of what is sold as a probiotic in the United States, and how it shows up across food, beverage, and supplement aisles. We reference public sources such as the US Food and Drug Administration for dietary supplement and labeling guidance, the National Institutes of Health Office of Dietary Supplements for ingredient context, the US Department of Agriculture for food category references, and the Centers for Disease Control and Prevention for broad health indicators that influence demand.
To keep assumptions realistic, we also use peer-reviewed nutrition and microbiome journals for strain and usage evidence, and trade association websites for category language and market context where available. For company-side signals, we use filings, investor presentations, press releases, and product catalogs to understand launch cadence and pack formats, and then use a paid subscription for company financials and a patent database selectively to confirm activity levels. These sources are not exhaustive, and we consult additional public references for data collection, cross-checking, and clarification.
Primary Interviews and Surveys
Primary interviews and surveys are used to confirm what actually drives sales in the US, especially the split between probiotic supplements versus probiotic foods and drinks, and how pricing shifts by form factor. We speak with brand and channel stakeholders, ingredient-side experts, and domain specialists across major US regions so assumptions on penetration, repeat purchase, and on-pack probiotic claims can be stress-tested before finalizing the model.
Distribution of primary research fieldwork respondents
| Company type | Respondent position | Region |
|---|---|---|
| Top tier: 35% | CXOs: 12% | |
| Mid tier: 43% | Functional/Unit leaders: 39% | |
| Smaller Players: 22% | Managers: 49% |
Market-Sizing & Forecasting
Sizing is built using a top-down and bottom-up approach where US demand is reconstructed from the addressable consumer pool and how often probiotic products are bought, and then translated into value using observed price bands by format. To keep the math grounded, we corroborate with selective bottom-up approximations, such as sampling key brands by channel, using pack sizes and price points, and sense-checking supplier activity and shelf presence where data is available.
The model uses practical inputs that can be verified and updated, including probiotic supplement adoption trends, functional yogurt and fermented drink volumes, average retail pricing by format (capsules, gummies, powders, and cultured dairy), share shift toward e-commerce, and the pace of new product claims tied to specific strains. Where the bottom-up view is incomplete, we handle gaps by applying conservative channel coverage factors and validating them through interviews, then adjusting totals only when multiple signals point in the same direction.
For forecasting, scenario analysis is used, supported by a light multivariate regression that links demand growth to wellness spend direction, channel mix changes, and pricing inflation expectations. Assumptions are reviewed with industry respondents so the base case reflects how quickly consumers trade up, how repeat purchase holds, and how new launches translate into shelf sales.
Data Validation & Update Cycle
Validation is done by checking whether the final market value aligns with independent signals, such as category growth rates in supplements and cultured dairy, channel mix movement, and typical price ranges seen in retail and online. When the model shows sharp jumps, we re-check the underlying drivers, and we trace outliers back to inputs like pricing, penetration, or channel assumptions.
Before sign-off, the work is reviewed in steps, first at the assumption level and then at the total market level, so calculation errors and logic gaps are caught early. The report is refreshed annually, and interim updates are triggered when material events occur, such as meaningful regulatory changes, large inflation shifts, or major portfolio moves. Right before delivery, we run a final pass to ensure the numbers reflect the latest available public information.
Mordor Intelligence's United States Probiotics Market Market Size Compared With Other Published Estimates
Published market values for US probiotics often vary because the market can be defined in different ways, and because companies do not always align on what is included across foods, beverages, and supplements. Differences also come from the base year chosen, how pricing is handled, and how fast assumptions get refreshed when new products and channels shift.
A common gap driver is scope, where some estimates bundle animal nutrition or feed applications into the same total, which can raise the reported value for a consumer-focused view. Another driver is how the model moves from units to dollars, since using optimistic price progression or aggressive online growth can lift the forecast quickly. The spread in the table is largely explained by keeping the count limited to finished human-consumption probiotic foods, drinks, and dietary supplements, and excluding animal feed and veterinary products, a scope treatment that is kept consistent in Mordor Intelligence.
Benchmark comparison
| Source | Market Size | Gaps in Research Methodology |
|---|---|---|
| Mordor Intelligence | USD 6.69 B (2026) | |
| Industry Publisher A | USD 16.30 B (2025) | Uses a broader application scope that explicitly includes animal feed alongside food and beverages and dietary supplements, which expands the addressable revenue pool relative to a human-consumption-only definition. |
| Global Publisher B | USD 8.50 B (2024) | Uses an earlier base year and a wider application frame that includes animal nutrition, and it can also differ on whether products are counted based on general ingredient presence versus explicit probiotic positioning on-pack. |
Across the three values, most of the gap is explained by what gets counted and when it gets counted, followed by how pricing and channel mix are projected forward. When scope is kept consistent and inputs are tied to observable purchase behavior, the resulting market value becomes easier to track and update year after year. We use this same logic so clients can map the number back to clear demand indicators and repeatable steps.


Key Questions Answered in the Report
How big is the United States probiotic products market in 2026?
The United States probiotic products market size is USD 6.69 billion in 2026 and is set to reach USD 9.08 billion by 2031 at a 6.31% CAGR.
Which product type accounts for the largest revenue?
Probiotic foods lead with 56.93% of the United States probiotic products market share in 2025, owing to established yogurt consumption and dairy supply chains.
What is the fastest-growing category?
Probiotic drinks are forecast to expand at an 8.05% CAGR through 2031, driven by on-the-go lifestyles and innovative plant-based formulations.
Which sales channel is growing quickest?
Online retail stores are projected to post a 6.52% CAGR, fueled by subscription models, microbiome personalization, and cold-chain logistics.
Page last updated on:


