Quartz Market Size and Share
Market Overview
| Study Period | 2020 - 2031 |
|---|---|
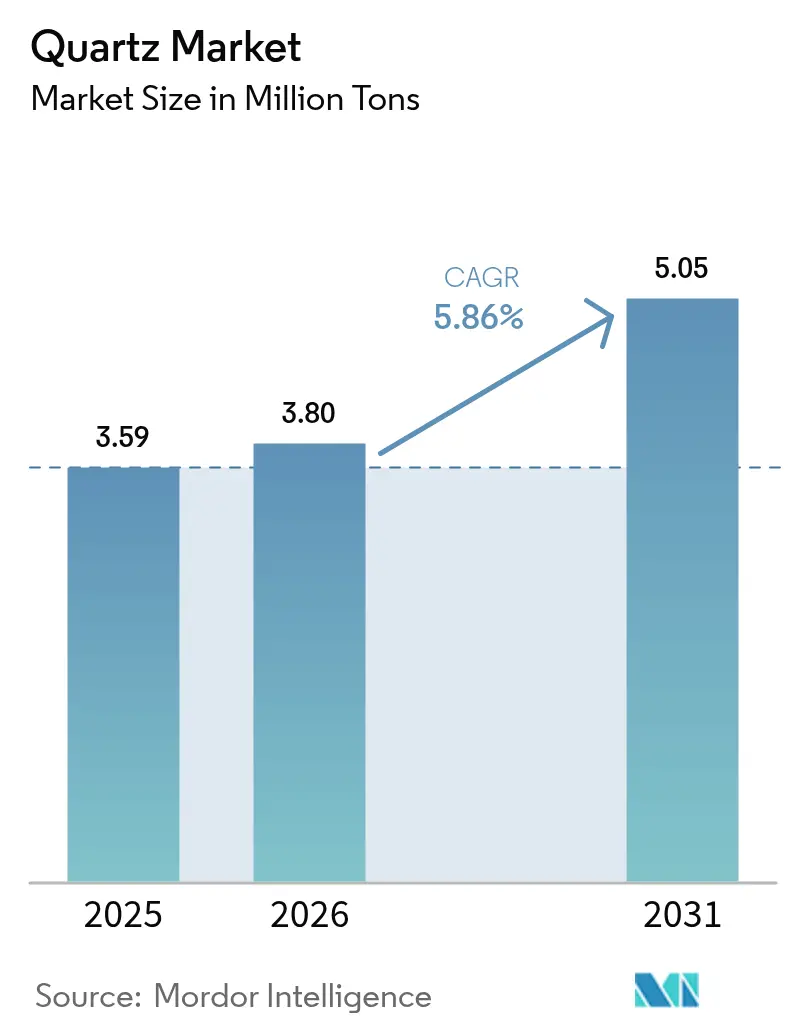
| Market Volume (2026) | 3.8 Million tons |
| Market Volume (2031) | 5.05 Million tons |
| Growth Rate (2026 - 2031) | 5.86% CAGR |
| Fastest Growing Market | Asia Pacific |
| Largest Market | Asia Pacific |
| Market Concentration | Medium |
Major Players *Disclaimer: Major Players sorted in no particular order Image © Mordor Intelligence. Reuse requires attribution under CC BY 4.0. | |
Quartz Market Analysis by Mordor Intelligence
Quartz Market size in 2026 is estimated at 3.8 million tons, growing from 2025 value of 3.59 million tons with 2031 projections showing 5.05 million tons, growing at 5.86% CAGR over 2026-2031. This steady expansion reflects the mineral’s irreplaceable role in semiconductor lithography, photovoltaic ingot growth, optical fibers, and engineered surfaces. As node geometries shrink below 7 nm, chip fabs elevate impurity thresholds to parts-per-billion, forcing suppliers to invest in advanced purification assets. Solar ingot pullers are simultaneously scaling crucible diameters for larger wafers, multiplying baseline quartz volumes. Climate-related supply shocks—most recently Hurricane Helene’s disruption of Spruce Pine—have propelled diversification efforts into Norway, Brazil, and Africa while sustaining premium pricing for ultra-high-purity grades. Finally, a wave of consolidation and capacity additions signals confidence that the quartz market will remain a cornerstone of high-tech manufacturing ecosystems through the end of the decade.
Key Report Takeaways
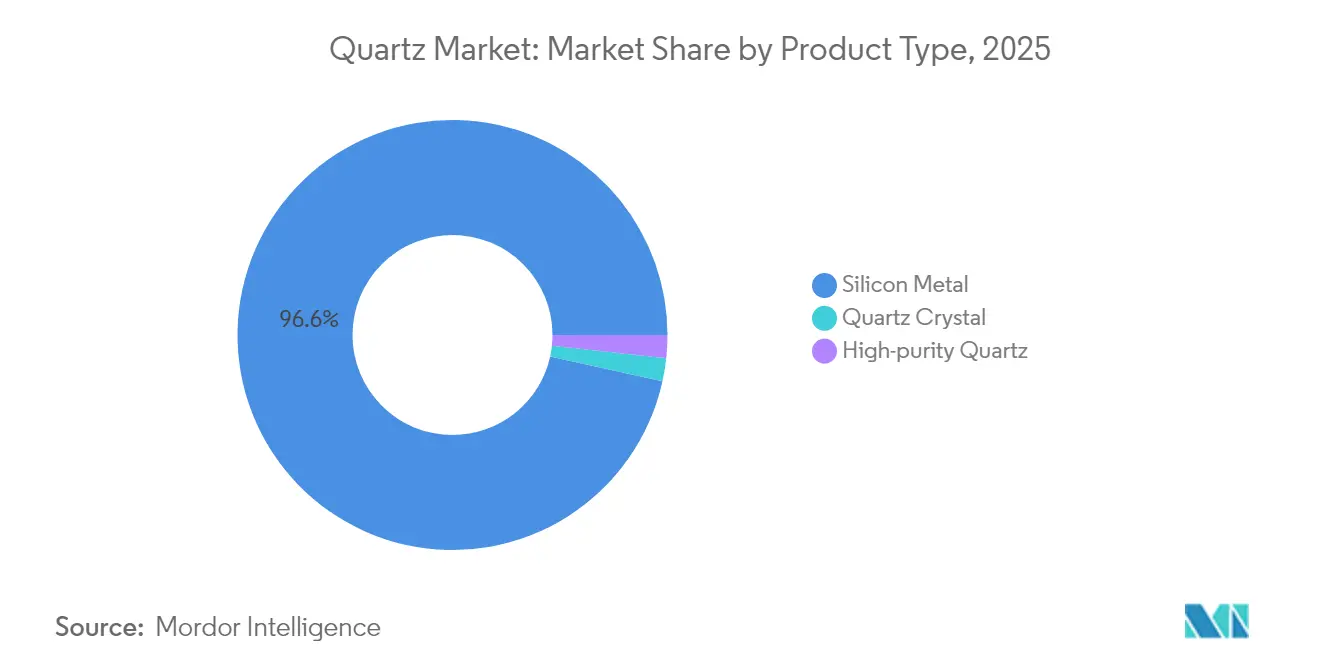
- By product type, silicon metal led with 96.55% of quartz market share in 2025; high-purity quartz is projected to expand at a 7.18% CAGR through 2031.
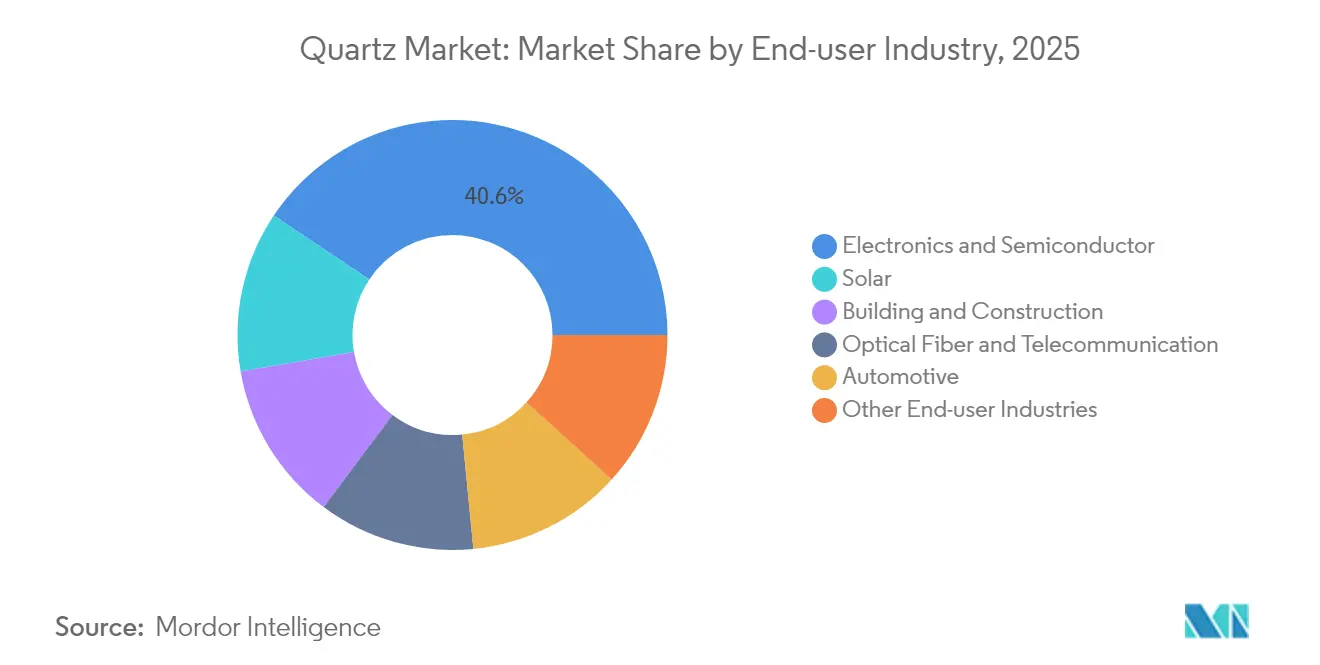
- By end-user industry, electronics and semiconductor accounted for 40.62% of the quartz market size in 2025, and the same segment is advancing at the fastest 6.48% CAGR to 2031.
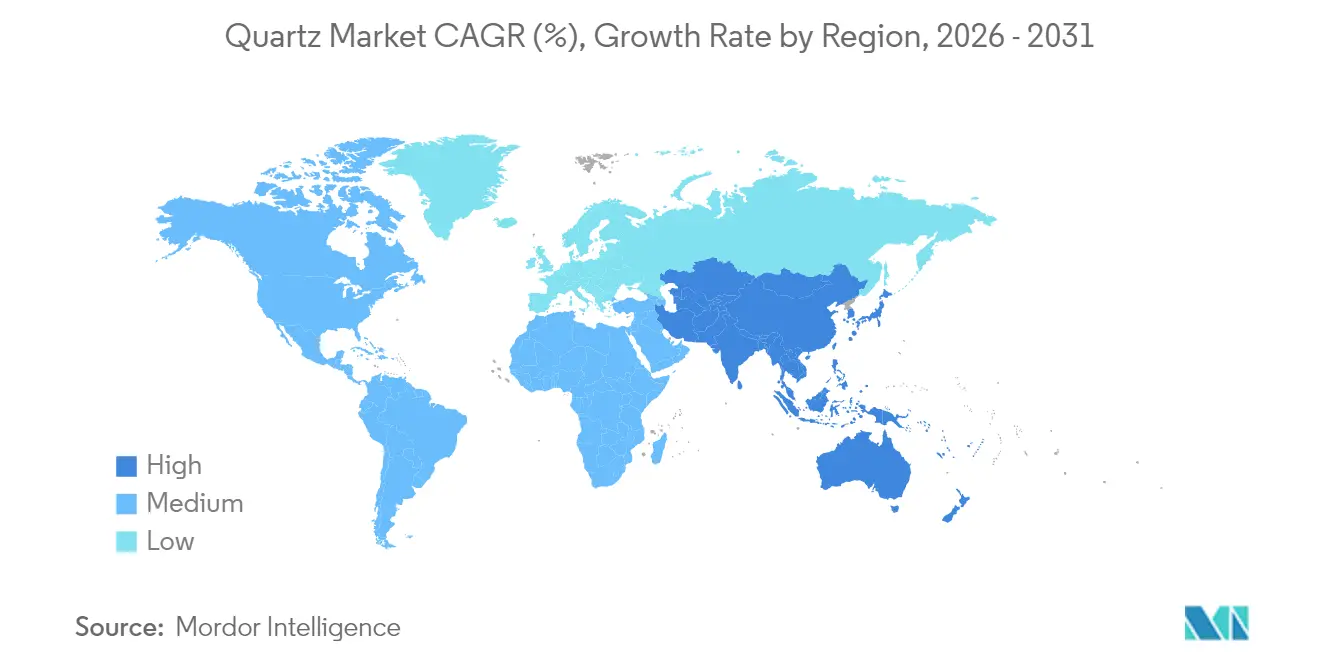
- By geography, Asia-Pacific held 55.01% of quartz market share in 2025 while also recording the highest 6.27% CAGR toward 2031.
Note: Market size and forecast figures in this report are generated using Mordor Intelligence’s proprietary estimation framework, updated with the latest available data and insights as of 2026.
Global Quartz Market Trends and Insights
Driver Impact Analysis*
| Drivers | (~) % Impact on CAGR Forecast | Geographic Relevance | Impact Timeline |
|---|---|---|---|
| Growing solar-PV capacity surge | +1.5% | Global, with APAC core leadership | Medium term (2-4 years) |
| Semiconductor node-shrink drives ultra-high-purity demand | +1.2% | APAC manufacturing hubs, North America research and development centers | Long term (≥ 4 years) |
| Boom in engineered-quartz interior surfaces | +0.8% | North America and EU residential markets | Short term (≤ 2 years) |
| Fibre-optic rollout in 5G/FTTx | +0.6% | Global infrastructure deployment | Medium term (2-4 years) |
| Tailings-derived HPQ lowers cost curve | +0.3% | Mining regions with existing tailings infrastructure | Long term (≥ 4 years) |
| Source: Mordor Intelligence | |||
Growing Solar-PV Capacity Surge
Global photovoltaic build-outs require ultra-pure quartz crucibles capable of withstanding 1,723 °C during Czochralski silicon ingot growth[1]The Quartz Corp., “High Purity Quartz,” thequartzcorp.com. Larger wafer formats, such as M12, amplify volume per line, forcing crucible producers to scale both diameter and wall uniformity. Suppliers with track records in more than 99.999% SiO₂ grades secure long-term offtake agreements from wafer majors eager to derisk material availability. Asia-Pacific dominates demand, yet European and U.S. energy-transition incentives are creating incremental pull that helps regionalize processing footprints. As a result, solar applications are forecast to be a stabilizing pillar for the quartz market amid cyclical swings in electronics.
Semiconductor Node-Shrink Drives Ultra-High-Purity Demand
Leading-edge logic and memory fabs operating below 7 nm mandate impurity ceilings in the parts-per-billion range, raising the technical bar for fused silica and quartz ware suppliers. Proprietary processes. including synthetic route, fused silica, and multi-stage acid leaching, enable aluminum contents below 9 ppm and iron below 0.2 ppm. The capital intensity and qualification cycles involved effectively deter new entrants, allowing incumbents to negotiate multi-year pricing formulas tracking purity rather than tonnage. As chipmakers move toward 3 nm production and pilot 2 nm, demand for ultra-high-purity quartz is set to outpace broader quartz market growth through 2030.
Boom in Engineered-Quartz Interior Surfaces
Residential remodeling and commercial fit-outs increasingly favor engineered quartz over natural stone owing to color consistency, low porosity, and easier fabrication. Hyundai L&C’s Next Generation Quartz slashes crystalline silica content to 35% in select lines, addressing occupational exposure limits while reducing carbon intensity via on-site solar arrays. Design trends for veined aesthetics and matte textures push producers to refine pigments, resin systems, and polishing techniques, enhancing differentiation. Although purity demands are less stringent than electronics, high optical clarity in premium countertops still draws on mid-grade quartz feedstock, adding resilience to the quartz market during semiconductor downturns.
Tailings-Derived HPQ Lowers Cost Curve
Mining conglomerates are investigating high-purity quartz extraction from existing tailings, potentially shifting cost structures by eliminating primary ore mining. Vale’s pilot program reports Opex reductions of 40% versus traditional routes, with academic consortia refining selective leaching to remove transition metals[2]S. M. Heidari, “Carbon Footprint of Metallurgical Grade Silicon,” par.nsf.gov . If commercialized, tailings-sourced HPQ could unlock latent reserves in mature mining regions, improving supply security while reducing ecological footprints. Early adopters stand to reposition themselves on the global quartz cost curve, challenging incumbents reliant on virgin deposits.
Restraint Impact Analysis*
| Restraints | (~) % Impact on CAGR Forecast | Geographic Relevance | Impact Timeline |
|---|---|---|---|
| Ecological impact of quartz mining | -0.9% | Global mining regions, particularly North America | Medium term (2-4 years) |
| Energy-intensive purification process | -0.7% | Global manufacturing locations with high energy costs | Short term (≤ 2 years) |
| Climate-driven mine disruptions | -0.6% | North America mining regions, coastal operations globally | Short term (≤ 2 years) |
| Source: Mordor Intelligence | |||
Ecological Impact of Quartz Mining
Habitat disruption, water-table alteration, and particulate emissions are prompting stricter permitting regimes across North Carolina, Québec, and parts of Scandinavia. Restoration bonding, baseline biodiversity assessments, and community consultations now extend lead times by up to 24 months. Producers lacking credible ESG roadmaps face escalating capex, while recyclers and tailings-based initiatives gain regulatory goodwill. This environmental scrutiny places a measurable drag on the quartz market, although it simultaneously accelerates innovation in lower-impact sourcing models.
Energy-Intensive Purification Process
Thermal treatment above 1,700 °C and multi-stage chemical leaching drive electricity consumption to nearly 1 MWh per ton of high-purity quartz. In jurisdictions where industrial power costs exceed USD 0.10/kWh, energy outlays can eclipse 25% of cash-cost. Carbon-pricing schemes in the EU and select U.S. states further erode margins, incentivizing relocation to regions with renewable grids or subsidized rates. Until furnace efficiency or alternative chemistries mature, energy intensity will remain a structural headwind to quartz market expansion, particularly for greenfield HPQ projects.
*Our forecasts treat driver/restraint impacts as directional, not additive. The impact forecasts reflect baseline growth, mix effects, and variable interactions.
Segment Analysis
By Product Type: High-Purity Upswing Within a Silicon-Metal Stronghold
Silicon metal dominated tonnage with a 96.55% quartz market share in 2025, underscoring its indispensable role in aluminum alloys, silicones, and polysilicon. The quartz market size attributed to silicon metal processing is projected to expand steadily in line with light-weighting in transportation, and solar-grade polysilicon capacity adds in China and the U.S. Ferroglobe, Elkem, and Hoshine capitalize on large submerged-arc furnaces and captive quartzite mines to defend cost positions, while electricity availability remains a swing factor for new entrants.
High-purity quartz, though tiny in volume, captures a disproportionate value pool thanks to average selling prices exceeding USD 7,000 per ton. Its forecast 7.18% CAGR through 2031 reflects secular tailwinds from node migration and larger solar wafer formats. Qualification barriers such as ISO 9001:2000 and customer audits spanning 12-18 months cement long-term contracts once secured. Hurricane Helene’s interference with Spruce Pine shipments prompted chipmakers to dual-source from Norway and Asia, spotlighting the strategic leverage of certified HPQ suppliers. This dynamic positions HPQ as the fastest-rising slice of the quartz market, even as silicon metal maintains volume leadership.


By End-User Industry: Electronics and Semiconductor Anchors Demand Growth
Electronics and semiconductor fabrication captured 40.62% of the quartz market size in 2025 and is on course for a 6.48% CAGR to 2031, mirroring capital expenditure cycles at TSMC, Samsung, and Intel. Fused silica chambers, quartz boats, and etching rings face stricter life-cycle particle specifications with every new node, bolstering replacement frequencies. The quartz industry also benefits from government-backed fab incentives such as the U.S. CHIPS Act, which embeds local sourcing clauses that could spur domestic HPQ investments.
Building and construction ranks second, propelled by the renaissance of engineered stone in residential renovations across the U.S. Sun-belt and EU refurbishment programs. Despite lower purity demands, margins remain healthy due to branding, design patents, and post-form finishing. Solar energy follows closely, as crucible suppliers ride the gigawatt-scale expansion of monocrystalline wafer lines. Optical fiber and automotive applications round out demand, offering volume stability and technology diversification, respectively. Collectively, the varied application base cushions the quartz market against cyclical slumps in any single sector.
Geography Analysis
Asia-Pacific accounted for 55.01% of the quartz market share in 2025, driven by China’s vertically integrated clusters that convert quartz ore into electronics, solar panels, and engineered surfaces within a few hundred kilometers. Regional regulators continue to streamline mine-to-fab logistics, further compressing working capital cycles. India and Vietnam are emerging as supplementary processing hubs, buoyed by favorable power tariffs and incentives to localize semiconductor back-end. The 6.27% regional CAGR through 2031 is underpinned by relentless smartphone adoption, rooftop solar policies, and middle-class home upgrades across ASEAN economies.
North America remains strategically vital owing to Spruce Pine’s ultra-pure vein—the bedrock for 80-90% of global HPQ feedstock before the 2024 hurricane event. Sibelco’s USD 700 million expansion and The Quartz Corp’s Norway commissioning reflect a dual-axis mitigation strategy that pairs geological excellence with geographic redundancy. U.S. fab build-outs in Arizona, Texas, and New York offer a downstream pull, yet higher energy costs and stringent environmental permitting temper capacity growth in commodity grades. Canada and Mexico serve regional construction markets with proximity advantages, while aiming to attract niche HPQ investments through renewable power corridors.
Europe leverages stringent ESG standards to carve out a premium niche in value-added quartz processing. Imerys operates deposits in Sweden and France, integrating them with fused silica plants adjacent to low-carbon hydro power. Germany supplies precision machinery for slurry-less sawing and hot-zone assembly, ensuring technological leadership despite modest ore endowment. South America, the Middle East, and Africa contribute incremental tonnage, particularly from Brazil’s Minas Gerais belt, yet infrastructure deficits and water scarcity cap near-term growth. These regions rely heavily on imports, reinforcing Asia-Pacific and North American suppliers’ influence over the global quartz market.

Competitive Landscape
The quartz market is moderately fragmented, with a handful of vertically integrated players controlling premium deposits, proprietary purification steps, and multi-year off-take contracts with semiconductor and solar heavyweights. Competitive intensity stays moderate due to high switching costs in semiconductor qualification and patent-protected purification chemistries. Yet, climate-related supply shocks have prompted chipmakers to adopt dual-sourcing, eroding the incumbents’ monopolistic hold on elite grades. Emerging Asian processors leverage government subsidies to scale mid-purity production, while European players bet on low-carbon attributes to justify premium prices. Overall, the interplay of deposit control, process patents, ESG credentials, and customer lock-ins will define the evolving hierarchy within the quartz market.
Quartz Industry Leaders
Australian Silica Quartz Group Ltd
Jiangsu Pacific Quartz Co., Ltd
NIHON DEMPA KOGYO CO., LTD.
Sibelco
The Quartz Corp
- *Disclaimer: Major Players sorted in no particular order

Recent Industry Developments
- July 2025: India’s quartz exports fell 34% YoY to 916 kilotons as Chinese demand evaporated, according to the Government of India trade statistics.
- August 2025: The United States imposed a 50% tariff on engineered quartz imports from India, prompting domestic producers to seek alternative markets while facing price competition from Chinese suppliers.


Global Quartz Market Report Scope
Quartz crystals possess piezoelectric properties. It is one of the hardest naturally occurring minerals that does not corrode easily. The market is segmented by type, end-user industry, and geography. The market is segmented by type: quartz surface and tile, high-purity quartz, fused quartz crucible, quartz glass, quartz crystal, quartz sand, plastic foam, and other types. By end-user industry, the market is segmented into electronics and semiconductors, solar, buildings and construction, medical, optics and telecommunication, and other end-user industries. The report also covers the market size and forecasts for the quartz market in 16 countries across major regions. For each segment, the market sizing and forecasts have been done based on revenue (USD million).
| High-purity Quartz | Quartz Surface and Tile |
| Fused Quartz Crucible | |
| Quartz Glass | |
| Quartz Crystal | |
| Silicon Metal |
| Electronics and Semiconductor |
| Solar |
| Building and Construction |
| Optical Fiber and Telecommunication |
| Automotive |
| Other End-user Industries |
| Asia-Pacific | China |
| India | |
| Japan | |
| South Korea | |
| Malaysia | |
| Thailand | |
| Indonesia | |
| Vietnam | |
| Rest of Asia-Pacific | |
| North America | United States |
| Canada | |
| Mexico | |
| Europe | Germany |
| United Kingdom | |
| France | |
| Italy | |
| Spain | |
| NORDIC Countries | |
| Turkey | |
| Russia | |
| Rest of Europe | |
| South America | Brazil |
| Argentina | |
| Colombia | |
| Rest of South America | |
| Middle-East and Africa | Saudi Arabia |
| Qatar | |
| United Arab Emirates | |
| Nigeria | |
| Egypt | |
| South Africa | |
| Rest of Middle-East and Africa |
| By Product Type | High-purity Quartz | Quartz Surface and Tile |
| Fused Quartz Crucible | ||
| Quartz Glass | ||
| Quartz Crystal | ||
| Silicon Metal | ||
| By End-user Industry | Electronics and Semiconductor | |
| Solar | ||
| Building and Construction | ||
| Optical Fiber and Telecommunication | ||
| Automotive | ||
| Other End-user Industries | ||
| By Geography | Asia-Pacific | China |
| India | ||
| Japan | ||
| South Korea | ||
| Malaysia | ||
| Thailand | ||
| Indonesia | ||
| Vietnam | ||
| Rest of Asia-Pacific | ||
| North America | United States | |
| Canada | ||
| Mexico | ||
| Europe | Germany | |
| United Kingdom | ||
| France | ||
| Italy | ||
| Spain | ||
| NORDIC Countries | ||
| Turkey | ||
| Russia | ||
| Rest of Europe | ||
| South America | Brazil | |
| Argentina | ||
| Colombia | ||
| Rest of South America | ||
| Middle-East and Africa | Saudi Arabia | |
| Qatar | ||
| United Arab Emirates | ||
| Nigeria | ||
| Egypt | ||
| South Africa | ||
| Rest of Middle-East and Africa | ||


Key Questions Answered in the Report
How large is the global quartz market in 2026?
The quartz market size reached 3.8 million tons in 2026 and is forecast to grow at a 5.86% CAGR to 5.05 million tons by 2031.
Which segment leads demand for high-purity quartz?
Electronics and semiconductor fabrication leads, holding 40.62% of overall volume in 2025 and expanding at a 6.48% CAGR toward 2031 as sub-7 nm nodes proliferate.
Why is Asia-Pacific the dominant region?
Asia-Pacific commands 55.01% of quartz market share due to China's integrated supply chain for semiconductors, solar panels, and engineered stone, alongside strong regional policy incentives.
What are the key growth drivers to 2031?
Solar-PV expansion, semiconductor node shrink, engineered-quartz interior design trends, and 5G fiber rollouts collectively add about 4% to the forecast CAGR.
How are environmental concerns affecting supply?
Stricter permitting and high energy costs are slowing mine expansions and pushing producers toward low-carbon power grids and tailings-based sourcing strategies.
Who are the major players in high-purity quartz?
Sibelco, The Quartz Corp., Heraeus Conamic, and Jiangsu Pacific Quartz dominate through deposit ownership, proprietary purification, and long-term qualification at leading chip fabs.
Page last updated on:


