South Korea Data Center Market Size and Share
Market Overview
| Study Period | 2020 - 2031 |
|---|---|
| Forecast Data Period | 2026 - 2031 |
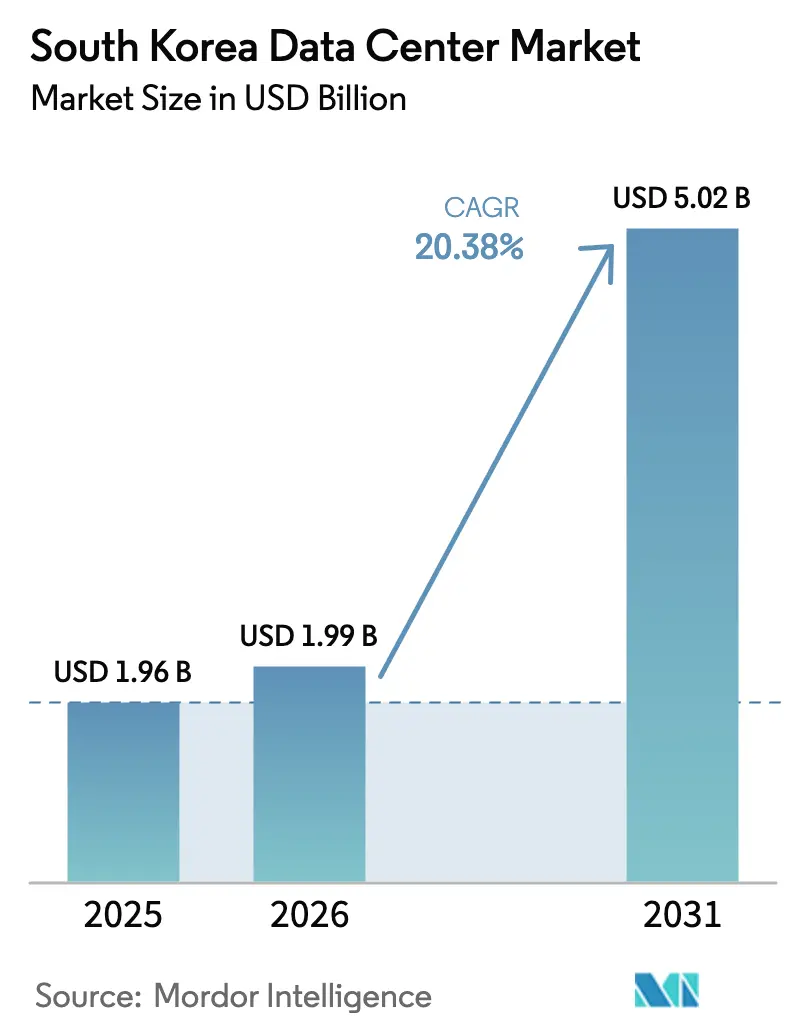
| Base Year Market Size (2025) | USD 1.96 Billion |
| Market Size (2026) | USD 1.99 Billion |
| Market Size (2031) | USD 5.02 Billion |
| Growth Rate (2026 - 2031) | 20.38% CAGR |
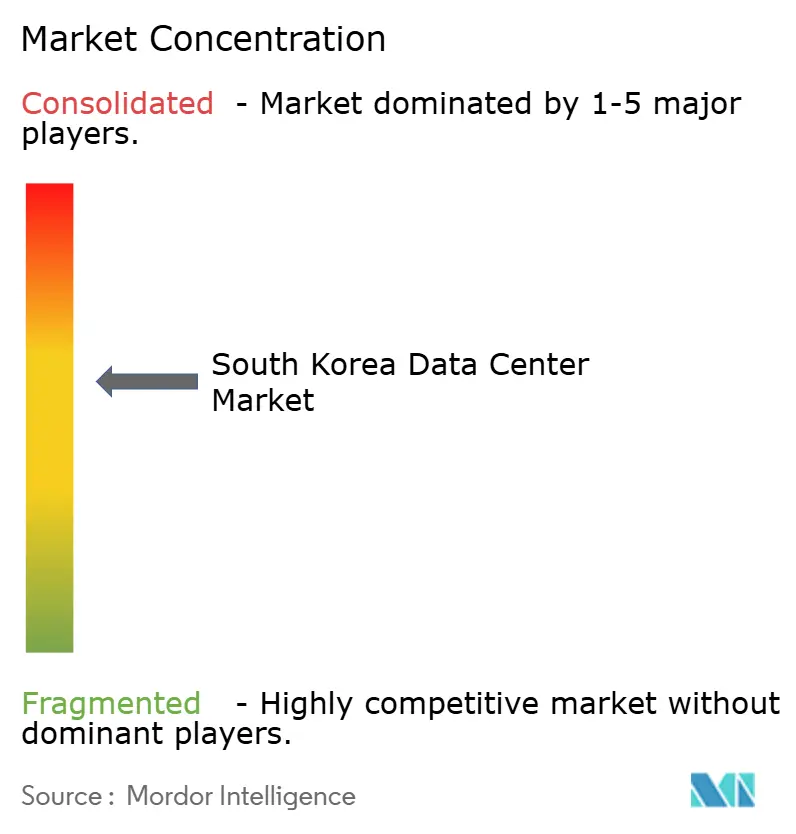
| Market Concentration | Medium |
Major Players *Disclaimer: Major Players sorted in no particular order Image © Mordor Intelligence. Reuse requires attribution under CC BY 4.0. | |
South Korea Data Center Market Analysis by Mordor Intelligence
The South Korea Data Center Market size was valued at USD 1.65 billion in 2025 and estimated to grow from USD 1.99 billion in 2026 to reach USD 5.02 billion by 2031, at a CAGR of 20.38% during the forecast period (2026-2031). In terms of IT load capacity, the market is expected to grow from 1.96 thousand megawatt in 2025 to 6.32 thousand megawatt by 2030, at a CAGR of 26.29% during the forecast period (2025-2030). The market segment shares and estimates are calculated and reported in terms of MW. Seoul’s role as Northeast Asia’s AI infrastructure hub, the government’s broad package of tax holidays and direct-PPA reforms, and multi-billion-dollar hyperscale announcements together accelerate capacity roll-outs. Operators are investing heavily in advanced cooling, high-density power delivery, and renewable-energy procurement to control operating expenditure. Demand is further amplified by nationwide 5G coverage, open-banking mandates, and Korea’s booming K-content exports, each of which pushes workloads toward compliant, latency-optimized facilities. The South Korea data center market is therefore expanding faster than most APAC peers as policy, capital, and technology converge to treat digital infrastructure as a strategic utility.
Key Report Takeaways
- By data center size, large facilities held 40.72% of the South Korea data center market size in 2025; medium facilities are projected to grow at a 26.95% CAGR to 2031.
- By tier standard, Tier 3 infrastructure accounted for a 52.15% share of the South Korea data center market size in 2025 and is advancing at a 27.15% CAGR through 2031.
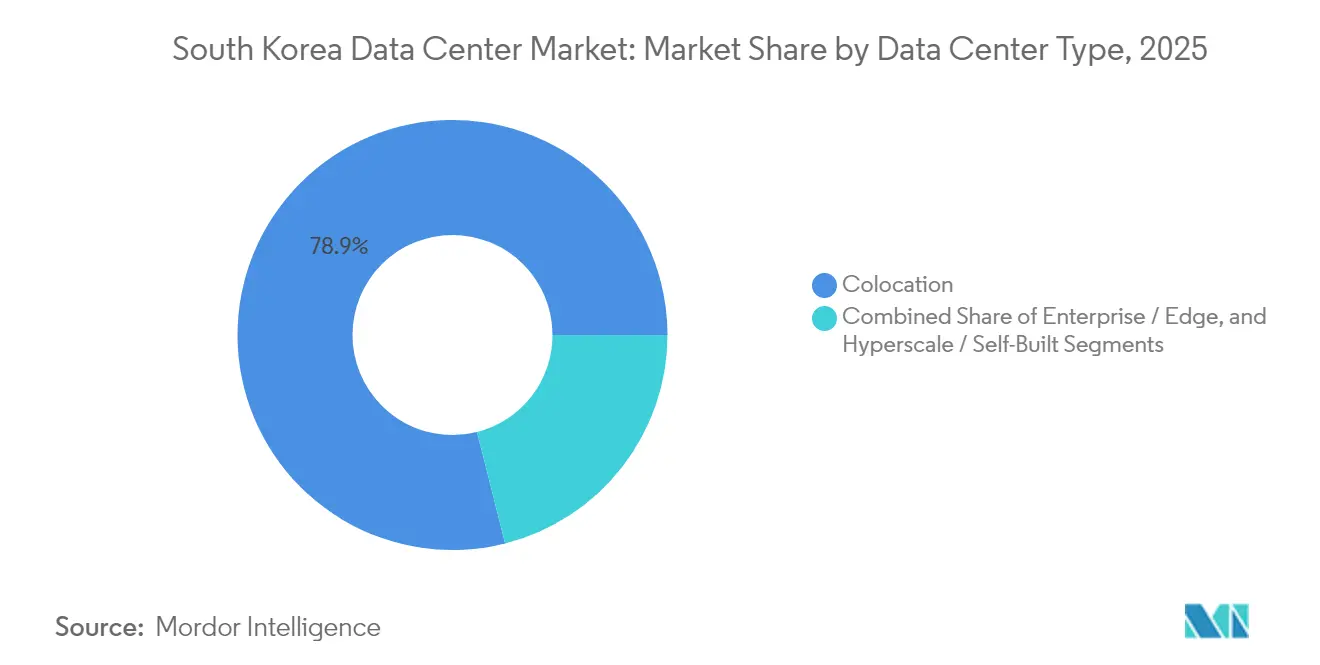
- By data center type, colocation led with 78.94% South Korea data center market share in 2025, while hyperscale deployments are forecast to expand at a 29.10% CAGR through 2031.
- By end user industry, IT and telecom controlled 49.10% revenue share in 2025 in the South Korea data center market; BFSI workloads are set to register the fastest 26.85% CAGR up to 2031.
- By hotspot, Seoul retained 52.10% South Korea data center market share in 2025, whereas Busan is forecast to post the highest 27.55% CAGR to 2031.
Note: Market size and forecast figures in this report are generated using Mordor Intelligence’s proprietary estimation framework, updated with the latest available data and insights as of 2026.
South Korea Data Center Market Trends and Insights
Drivers Impact Analysis*
| Driver | (~) % Impact on CAGR Forecast | Geographic Relevance | Impact Timeline |
|---|---|---|---|
| Surge in hyperscale cloud and AI build-outs | +8.2% | National, concentrated in Seoul and Busan | Medium term (2-4 years) |
| Government tax incentives and RE100 road-map support | +4.1% | National, enhanced in Free Economic Zones | Long term (≥ 4 years) |
| 5G-driven data traffic explosion | +3.8% | National, urban areas priority | Short term (≤ 2 years) |
| Accelerated digital-banking (open-banking) roll-outs | +2.9% | National, Seoul financial district core | Medium term (2-4 years) |
| Renewable-energy PPAs lowering OPEX | +2.7% | National, coastal areas preferred | Long term (≥ 4 years) |
| K-content (K-POP, gaming, OTT) traffic spikes | +2.1% | National, Seoul content hubs | Short term (≤ 2 years) |
| Source: Mordor Intelligence | |||


Surge in Hyperscale Cloud and AI Build-outs
Gigawatt-scale commitments from SK Telecom, Amazon Web Services, and Digital Realty are reshaping the South Korea data center market by favoring purpose-built AI campuses that can cool 70 kW racks and deliver triple-feed power resiliency. Capital allocations, such as a USD 35 billion pledge to deliver 3 GW of capacity, illustrate how AI is elevating data centers from commercial real-estate plays to core national infrastructure. Facilities outside Seoul, including Samsung SDS’s new GPU site in Gumi, signal an emerging distributed topology that reduces latency while bolstering national redundancy. Purpose-built AI halls increasingly incorporate liquid and rear-door immersion systems, which cut PUE targets below 1.2, aligning cost control with sustainability objectives. Collectively, these trends position the South Korea data center market as a key battleground in Asia’s AI compute race.
Government Tax Incentives and RE100 Road-map Support
Enhanced foreign-direct-investment rules provide cash grants of up to 75% and seven-year tax holidays to digital-infrastructure projects in designated zones. Simultaneously, 2022 amendments to the Electric Utility Act allow operators to sign direct renewable PPAs, bypassing KEPCO’s single-buyer model and locking in tariff predictability. The dual incentive of fiscal relief and green-energy access shortens payback periods on megawatt-scale builds. Multinationals view the framework as a credible hedge against the carbon-pricing trajectory that the national ETS is set to tighten after 2027. Combined, these measures are encouraging global hyperscalers to pre-commit capacity, accelerating the South Korea data center market’s supply pipeline.
5G-Driven Data Traffic Explosion
Nationwide 5G achieved 36.11 million live subscriptions by 2024, delivering average city-center speeds above 1 Gbps.[1]Tae-gyu Kim, “Korea rushes to construct AI data centers,” UPI, UPI.COMTraffic surges from high-definition streaming, AR/VR, and industrial private-5G networks are overwhelming legacy server halls, forcing carriers to push compute closer to the radio edge. SK Telecom’s own data-traffic growth now consumes 2.49 TWh annually, underlining the energy challenge. Edge-ready, 3-10 MW facilities positioned in provincial cities respond to strict round-trip latency expectations of under 10 milliseconds. As demand scales, the South Korea data center market benefits from a virtuous cycle: 5G services require more regional compute, which in turn fuels further data-centric application innovation.
Accelerated Digital-Banking Roll-outs
Open-banking regulations and amendments to the Electronic Financial Transactions Act require domestic hosting for core banking data, driving BFSI tenants toward ISMS-certified facilities. KakaoBank’s selection of Digital Realty’s ICN10 hall, chosen for 70 kW racks and liquid-assisted cooling, exemplifies how fintechs prize both density and compliance.[2]Editors, “KakaoBank Goes All-In on AI for Next-Gen Banking,” CDOTrends, CDOTRENDS.COM Transaction-per-second thresholds in digital-asset markets add synchronous-replication needs, further boosting Tier 3 demand. With over 97% internet penetration, incremental API traffic compounds compute volumes, ensuring that BFSI remains the fastest-growing workload vertical for the South Korea data center market.
Restraints Impact Analysis*
| Restraint | (~) % Impact on CAGR Forecast | Geographic Relevance | Impact Timeline |
|---|---|---|---|
| High electricity tariffs and carbon-pricing risks | -3.4% | National, industrial areas most affected | Medium term (2-4 years) |
| Scarcity of suitable land/power in Seoul metro | -2.8% | Seoul metropolitan area | Short term (≤ 2 years) |
| Grid-renewables bottleneck delaying new permits | -2.1% | National, coastal regions priority | Long term (≥ 4 years) |
| Stringent seismic/structural codes inflating CAPEX | -1.9% | National, higher impact in seismic zones | Long term (≥ 4 years) |
| Source: Mordor Intelligence | |||
High Electricity Tariffs and Carbon-Pricing Risks
Korea’s 63.6% fossil-fuel power mix exposed operators to KRW 22 trillion in additional costs during the 2022 LNG crisis.[3]Michelle Kim, “South Korea’s fossil fuel-oriented power mix cost an additional USD 17bn,” IEEFA, IEEFA.ORG KEPCO’s debt load surpassing KRW 202 trillion restricts grid-upgrade budgets, delaying high-amp feeder deployments needed for 100 MW campuses. Carbon surcharges climbed from KRW 7.3/kWh in 2022 to KRW 9/kWh in 2023, and the third-phase ETS tightening in 2026 will lift them again. While PPAs cut exposure, current rules prevent operators from retaining RECs when using direct contracts, weakening Scope 2 reporting benefits. These dynamics shave 340 basis points off the forecast CAGR for the South Korea data center market unless reforms allow bundled REC transfers.
Scarcity of Suitable Land and Power in Seoul
Vacancy in Seoul’s 520 MW live inventory fell below 6% in 2024, pushing land prices in Digital Media City to record highs. Transmission constraints mean new 80 MW substations require five-year lead times, delaying hyperscale projects that favor metro latency. Developers therefore pivot to Busan, Gimhae, and Gumi, where industrial estates offer lower land cost and simpler permitting. The re-weighting away from Seoul tempers near-term supply yet supports a healthier geographic distribution for the South Korea data center market.
*Our forecasts treat driver/restraint impacts as directional, not additive. The impact forecasts reflect baseline growth, mix effects, and variable interactions.
Segment Analysis
By Data Center Size: Medium Facilities Drive Edge Expansion
Medium-scale sites of 5-20 MW captured rising demand for low-latency connectivity, growing at a forecast 26.95% CAGR even though large halls retained 40.72% of the South Korea data center market share in 2025. Enterprises pursuing Industry 4.0, telemedicine, and AR applications now prioritize proximity over sheer scale, shifting capex toward provincial campuses.
The result is a two-tier supply strategy: massive campuses stay concentrated in Seoul’s metro ring for AI training, while medium sites populate Busan, Gyeonggi, and North Chungcheong to serve regional consumption. Government Free Economic Zone incentives and pre-approved land parcels accelerate build schedules. By 2031, medium facilities are expected to comprise 18.92% of the South Korea data center market size, providing an indispensable edge layer that complements hyperscale cores.


By Tier Standard: Tier 3 Dominance Reflects Availability Priorities
Tier 3 designs delivered 52.15% of the South Korea data center market size in 2025 and will lead growth at a 27.15% CAGR. Financial regulators, cloud-service providers, and gaming studios increasingly demand N+1 redundancy for both power and cooling.
Seismic-resilience mandates under KBC-2018 naturally align with Tier 3 fault-tolerance principles, making Tier 3 the default specification for new builds. Operators find that Tier 2 lacks the risk envelope to win BFSI or healthcare workloads, whereas Tier 4 premiums exceed most ROI hurdles. Consequently, Tier 3’s technical sweet spot underpins the reliability standards expected in the South Korea data center market.
By Data Center Type: Hyperscale Growth Challenges Colocation Leadership
Colocation retained a dominant 78.94% revenue contribution in 2025, yet hyperscale campuses are on track for the fastest 29.10% CAGR. Cloud providers are locking in multi-year land pipelines and 400 G inter-metropolitan dark-fiber routes to meet AI and analytics demand.
Retail colocation faces pricing pressure but defends share via compliance services, low-commit racks, and cross-connect ecosystems. Wholesale suites increasingly blur into build-to-suit hyperscale shells, reflecting the pivot toward vertically integrated models. The mixed profile ensures that the South Korea data center market maintains both a vibrant carrier-neutral layer and a growing roster of single-tenant AI campuses.
By End User Industry: BFSI Acceleration Drives Compliance Demand
IT and telecom workloads held 49.10% share in 2025, leveraging existing fibre backbones and network-operations expertise. However, open-banking regulations push BFSI applications toward a 26.85% CAGR as digital banks, securities firms, and crypto-custody services require certified, low-latency colocation.
Regulatory scrutiny around personal-data localization, disaster recovery, and zero-trust architectures positions compliant data centers as premium platforms. Media, manufacturing, and public-sector footprints all expand, yet BFSI sets the pace, reinforcing financial-centric positioning for the South Korea data center market.
Geography Analysis
Seoul continues to anchor the South Korea data center market with more than half of installed capacity, thanks to unrivalled fibre density and proximity to financial trading venues. Yet power caps and real-estate premiums now slow fresh builds, marking a structural ceiling on metro-core growth. Second-ring suburbs in Gyeonggi and Incheon offer modest relief but face identical high-voltage constraints in 2027 when aggregate feeder demand outstrips substation upgrades.
Busan’s rise reflects a conscious rebalancing strategy. The local FEZ streamlines permitting to under nine months, while port-adjacent industrial zones supply dual-feed substations capable of 150 MVA each. Planned offshore-wind PPAs of 1.2 GW align with hyperscale sustainability targets. The upcoming JAKO cable will trim trans-Pacific latency by up to 12 milliseconds for Busan-based tenants, providing a compelling alternative to Seoul.
Outside the two primary metros, provincial cities such as Gumi, Daejeon, and Ulsan host purpose-built edge nodes colocated with manufacturing clusters. These 3-10 MW deployments shorten PLC cycle times, support autonomous-vehicle V2X trials, and serve smart-port analytics. Collectively, this distributed topology enhances national resilience and underpins a diversified demand picture for the South Korea data center market.
Competitive Landscape
South Korea’s data center arena displays moderate consolidation: the top five operators account for roughly 44% of active IT load. Incumbent telcos, KT Corporation, SK Telecom, and LG Uplus, monetize legacy dark fibre and regulatory familiarity, while global hyperscalers accelerate organic builds and joint ventures. SK Telecom’s 2024 merger of SAPEON with Rebellions underscores vertical integration aimed at securing AI chips domestically, cutting supply-chain risk.
Digital Realty, Equinix, and Naver Cloud pursue carrier-neutral strategies centered on open peering and compliance certifications, differentiating against single-tenant hyperscale campuses. MegazoneCloud’s planned USD 7 billion IPO illustrates investor appetite for cloud-managed-service bridges that optimize multi-cloud workloads. Technology differentiation increasingly revolves around advanced cooling: Digital Realty’s ICN10 introduced air-assisted liquid loops to support 70 kW racks, while KT deploys rear-door immersion for AI inference clusters.
Partnerships dominate go-to-market tactics. KT’s alliance with Palantir adds data-analytics services for defense and financial customers. LG Uplus collaborates with K-content studios to embed edge nodes within production campuses, capturing media traffic before it hits public exchanges. As capital intensity rises, smaller players seek M&A exits or niche compliance plays, reinforcing a barbell competitive structure in the South Korea data center market.
South Korea Data Center Industry Leaders
LG Uplus Corp
KT Corporation
Naver Corporation
Amazon Web Services, Inc.
Google LLC
- *Disclaimer: Major Players sorted in no particular order

Recent Industry Developments
- June 2025: Korea accelerated AI data-center construction nationwide, coupling renewable-energy PPAs with streamlined permitting to fast-track GPU campuses.
- March 2025: KT Corporation joined Palantir’s Worldwide Partner Ecosystem, planning Q2 2025 launch of secure cloud solutions for finance and defense.
- February 2025: KakaoBank opened an AI lab in Digital Realty’s ICN10 hall to exploit 70 kW racks and liquid cooling for language-model training.
- November 2024: SK Telecom unveiled plans for gigawatt-scale AI data centers, marking Korea’s largest single-operator commitment to GPU infrastructure.


South Korea Data Center Market Report Scope
Busan, Greater Seoul are covered as segments by Hotspot. Large, Massive, Medium, Mega, Small are covered as segments by Data Center Size. Tier 1 and 2, Tier 3, Tier 4 are covered as segments by Tier Type. Non-Utilized, Utilized are covered as segments by Absorption.| Large |
| Massive |
| Medium |
| Mega |
| Small |
| Tier 1 and 2 |
| Tier 3 |
| Tier 4 |
| Hyperscale / Self-Built | ||
| Enterprise / Edge | ||
| Colocation | Non-Utilized | |
| Utilized | Retail Colocation | |
| Wholesale Colocation | ||
| BFSI |
| IT and ITES |
| E-Commerce |
| Government |
| Manufacturing |
| Media and Entertainment |
| Telecom |
| Other End Users |
| Seoul |
| Busan |
| Rest of South Korea |
| By Data Center Size | Large | ||
| Massive | |||
| Medium | |||
| Mega | |||
| Small | |||
| By Tier Standard | Tier 1 and 2 | ||
| Tier 3 | |||
| Tier 4 | |||
| By Data Center Type | Hyperscale / Self-Built | ||
| Enterprise / Edge | |||
| Colocation | Non-Utilized | ||
| Utilized | Retail Colocation | ||
| Wholesale Colocation | |||
| By End User Industry | BFSI | ||
| IT and ITES | |||
| E-Commerce | |||
| Government | |||
| Manufacturing | |||
| Media and Entertainment | |||
| Telecom | |||
| Other End Users | |||
| By Hotspot | Seoul | ||
| Busan | |||
| Rest of South Korea | |||


Market Definition
- IT LOAD CAPACITY - The IT load capacity or installed capacity, refers to the amount of energy consumed by servers and network equipments placed in a rack installed. It is measured in megawatt (MW).
- ABSORPTION RATE - It denotes the extend to which the data center capacity has been leased out. For instance, a 100 MW DC has leased out 75 MW, then absorption rate would be 75%. It is also referred as utilization rate and leased-out capacity.
- RAISED FLOOR SPACE - It is an elevated space build over the floor. This gap between the original floor and the elevated floor is used to accommodate wiring, cooling, and other data center equipment. This arrangement assist in having proper wiring and cooling infrastructure. It is measured in square feet (ft^2).
- DATA CENTER SIZE - Data Center Size is segmented based on the raised floor space allocated to the data center facilities. Mega DC - # of Racks must be more than 9000 or RFS (raised floor space) must be more than 225001 Sq. ft; Massive DC - # of Racks must be in between 9000 and 3001 or RFS must be in between 225000 Sq. ft and 75001 Sq. ft; Large DC - # of Racks must be in between 3000 and 801 or RFS must be in between 75000 Sq. ft and 20001 Sq. ft; Medium DC # of Racks must be in between 800 and 201 or RFS must be in between 20000 Sq. ft and 5001 Sq. ft; Small DC - # of Racks must be less than 200 or RFS must be less than 5000 Sq. ft.
- TIER TYPE - According to Uptime Institute the data centers are classified into four tiers based on the proficiencies of redundant equipment of the data center infrastructure. In this segment the data center are segmented as Tier 1,Tier 2, Tier 3 and Tier 4.
- COLOCATION TYPE - The segment is segregated into 3 categories namely Retail, Wholesale and Hyperscale Colocation service. The categorization is done based on the amount of IT load leased out to potential customers. Retail colocation service has leased capacity less than 250 kW; Wholesale colocation services has leased capacity between 251 kW and 4 MW and Hyperscale colocation services has leased capacity more than 4 MW.
- END CONSUMERS - The Data Center Market operates on a B2B basis. BFSI, Government, Cloud Operators, Media and Entertainment, E-Commerce, Telecom and Manufacturing are the major end-consumers in the market studied. The scope only includes colocation service operators catering to the increasing digitalization of the end-user industries.
| Keyword | Definition |
|---|---|
| Rack Unit | Generally referred as U or RU, it is the unit of measurement for the server unit housed in the racks in the data center. 1U is equal to 1.75 inches. |
| Rack Density | It defines the amount of power consumed by the equipment and server housed in a rack. It is measured in kilowatt (kW). This factor plays a critical role in data center design and, cooling and power planning. |
| IT Load Capacity | The IT load capacity or installed capacity, refers to the amount of energy consumed by servers and network equipment placed in a rack installed. It is measured in megawatt (MW). |
| Absorption Rate | It denotes how much of the data center capacity has been leased out. For instance, if a 100 MW DC has leased out 75 MW, then the absorption rate would be 75%. It is also referred to as utilization rate and leased-out capacity. |
| Raised Floor Space | It is an elevated space built over the floor. This gap between the original floor and the elevated floor is used to accommodate wiring, cooling, and other data center equipment. This arrangement assists in having proper wiring and cooling infrastructure. It is measured in square feet/meter. |
| Computer Room Air Conditioner (CRAC) | It is a device used to monitor and maintain the temperature, air circulation, and humidity inside the server room in the data center. |
| Aisle | It is the open space between the rows of racks. This open space is critical for maintaining the optimal temperature (20-25 °C) in the server room. There are primarily two aisles inside the server room, a hot aisle and a cold aisle. |
| Cold Aisle | It is the aisle wherein the front of the rack faces the aisle. Here, chilled air is directed into the aisle so that it can enter the front of the racks and maintain the temperature. |
| Hot Aisle | It is the aisle where the back of the racks faces the aisle. Here, the heat dissipated from the equipment’s in the rack is directed to the outlet vent of the CRAC. |
| Critical Load | It includes the servers and other computer equipment whose uptime is critical for data center operation. |
| Power Usage Effectiveness (PUE) | It is a metric which defines the efficiency of a data center. It is calculated by: (𝑇𝑜𝑡𝑎𝑙 𝐷𝑎𝑡𝑎 𝐶𝑒𝑛𝑡𝑒𝑟 𝐸𝑛𝑒𝑟𝑔𝑦 𝐶𝑜𝑛𝑠𝑢𝑚𝑝𝑡𝑖𝑜𝑛)/(𝑇𝑜𝑡𝑎𝑙 𝐼𝑇 𝐸𝑞𝑢𝑖𝑝𝑚𝑒𝑛𝑡 𝐸𝑛𝑒𝑟𝑔𝑦 𝐶𝑜𝑛𝑠𝑢𝑚𝑝𝑡𝑖𝑜𝑛). Further, a data center with a PUE of 1.2-1.5 is considered highly efficient, whereas, a data center with a PUE >2 is considered highly inefficient. |
| Redundancy | It is defined as a system design wherein additional component (UPS, generators, CRAC) is added so that in case of power outage, equipment failure, the IT equipment should not be affected. |
| Uninterruptible Power Supply (UPS) | It is a device that is connected in series with the utility power supply, storing energy in batteries such that the supply from UPS is continuous to IT equipment even during utility power is snapped. The UPS primarily supports the IT equipment only. |
| Generators | Just like UPS, generators are placed in the data center to ensure an uninterrupted power supply, avoiding downtime. Data center facilities have diesel generators and commonly, 48-hour diesel is stored in the facility to prevent disruption. |
| N | It denotes the tools and equipment required for a data center to function at full load. Only "N" indicates that there is no backup to the equipment in the event of any failure. |
| N+1 | Referred to as 'Need plus one', it denotes the additional equipment setup available to avoid downtime in case of failure. A data center is considered N+1 when there is one additional unit for every 4 components. For instance, if a data center has 4 UPS systems, then for to achieve N+1, an additional UPS system would be required. |
| 2N | It refers to fully redundant design wherein two independent power distribution system is deployed. Therefore, in the event of a complete failure of one distribution system, the other system will still supply power to the data center. |
| In-Row Cooling | It is the cooling design system installed between racks in a row where it draws warm air from the hot aisle and supplies cool air to the cold aisle, thereby maintaining the temperature. |
| Tier 1 | Tier classification determines the preparedness of a data center facility to sustain data center operation. A data center is classified as Tier 1 data center when it has a non-redundant (N) power component (UPS, generators), cooling components, and power distribution system (from utility power grids). The Tier 1 data center has an uptime of 99.67% and an annual downtime of <28.8 hours. |
| Tier 2 | A data center is classified as Tier 2 data center when it has a redundant power and cooling components (N+1) and a single non-redundant distribution system. Redundant components include extra generators, UPS, chillers, heat rejection equipment, and fuel tanks. The Tier 2 data center has an uptime of 99.74% and an annual downtime of <22 hours. |
| Tier 3 | A data center having redundant power and cooling components and multiple power distribution systems is referred to as a Tier 3 data center. The facility is resistant to planned (facility maintenance) and unplanned (power outage, cooling failure) disruption. The Tier 3 data center has an uptime of 99.98% and an annual downtime of <1.6 hours. |
| Tier 4 | It is the most tolerant type of data center. A Tier 4 data center has multiple, independent redundant power and cooling components and multiple power distribution paths. All IT equipment are dual powered, making them fault tolerant in case of any disruption, thereby ensuring interrupted operation. The Tier 4 data center has an uptime of 99.74% and an annual downtime of <26.3 minutes. |
| Small Data Center | Data center that has floor space area of ≤ 5,000 Sq. ft or the number of racks that can be installed is ≤ 200 is classified as a small data center. |
| Medium Data Center | Data center which has floor space area between 5,001-20,000 Sq. ft, or the number of racks that can be installed is between 201-800, is classified as a medium data center. |
| Large Data Center | Data center which has floor space area between 20,001-75,000 Sq. ft, or the number of racks that can be installed is between 801-3,000, is classified as a large data center. |
| Massive Data Center | Data center which has floor space area between 75,001-225,000 Sq. ft, or the number of racks that can be installed is between 3001-9,000, is classified as a massive data center. |
| Mega Data Center | Data center that has a floor space area of ≥ 225,001 Sq. ft or the number of racks that can be installed is ≥ 9001 is classified as a mega data center. |
| Retail Colocation | It refers to those customers who have a capacity requirement of 250 kW or less. These services are majorly opted by small and medium enterprises (SMEs). |
| Wholesale Colocation | It refers to those customers who have a capacity requirement between 250 kW to 4 MW. These services are majorly opted by medium to large enterprises. |
| Hyperscale Colocation | It refers to those customers who have a capacity requirement greater than 4 MW. The hyperscale demand primarily originates from large-scale cloud players, IT companies, BFSI, and OTT players (like Netflix, Hulu, and HBO+). |
| Mobile Data Speed | It is the mobile internet speed a user experiences via their smartphones. This speed is primarily dependent on the carrier technology being used in the smartphone. The carrier technologies available in the market are 2G, 3G, 4G, and 5G, where 2G provides the slowest speed while 5G is the fastest. |
| Fiber Connectivity Network | It is a network of optical fiber cables deployed across the country, connecting rural and urban regions with high-speed internet connection. It is measured in kilometer (km). |
| Data Traffic per Smartphone | It is a measure of average data consumption by a smartphone user in a month. It is measured in gigabyte (GB). |
| Broadband Data Speed | It is the internet speed that is supplied over the fixed cable connection. Commonly, copper cable and optic fiber cable are used in both residential and commercial use. Here, optic cable fiber provides faster internet speed than copper cable. |
| Submarine Cable | A submarine cable is a fiber optic cable laid down at two or more landing points. Through this cable, communication and internet connectivity between countries across the globe is established. These cables can transmit 100-200 terabits per second (Tbps) from one point to another. |
| Carbon Footprint | It is the measure of carbon dioxide generated during the regular operation of a data center. Since, coal, and oil & gas are the primary source of power generation, consumption of this power contributes to carbon emissions. Data center operators are incorporating renewable energy sources to curb the carbon footprint emerging in their facilities. |


Research Methodology
Mordor Intelligence follows a four-step methodology in all our reports.
- Step-1: Identify Key Variables: In order to build a robust forecasting methodology, the variables and factors identified in Step-1 are tested against available historical market numbers. Through an iterative process, the variables required for market forecast are set and the model is built on the basis of these variables.
- Step-2: Build a Market Model: Market-size estimations for the forecast years are in nominal terms. Inflation is not a part of the pricing, and the average selling price (ASP) is kept constant throughout the forecast period for each country.
- Step-3: Validate and Finalize: In this important step, all market numbers, variables and analyst calls are validated through an extensive network of primary research experts from the market studied. The respondents are selected across levels and functions to generate a holistic picture of the market studied.
- Step-4: Research Outputs: Syndicated Reports, Custom Consulting Assignments, Databases & Subscription Platforms


