South Africa Hyperscale Data Center Market Size and Share
Market Overview
| Study Period | 2025 - 2031 |
|---|---|
| Forecast Data Period | 2025 - 2031 |
| Historical Data Period | |
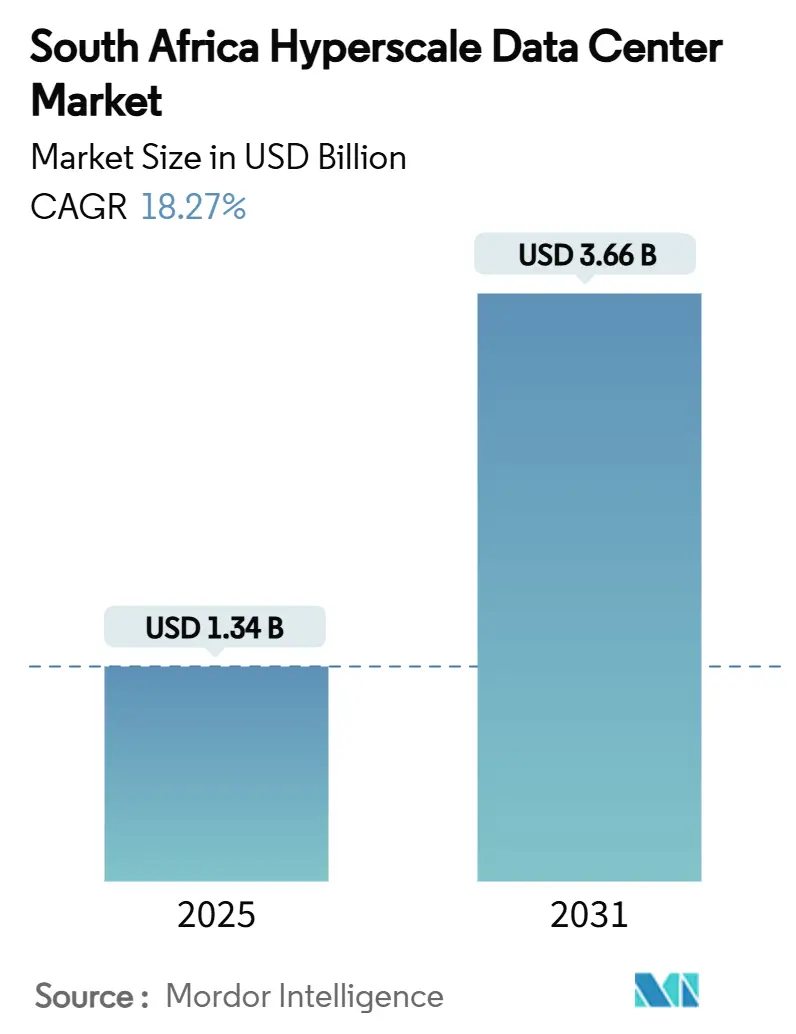
| Market Size (2025) | USD 1.34 Billion |
| Market Size (2031) | USD 3.66 Billion |
| Growth Rate (2025 - 2031) | 18.27% CAGR |
| Market Concentration | Medium |
Major Players *Disclaimer: Major Players sorted in no particular order Image © Mordor Intelligence. Reuse requires attribution under CC BY 4.0. | |
South Africa Hyperscale Data Center Market Analysis by Mordor Intelligence
The South Africa hyperscale data center market size stands at USD 1,339.26 million in 2025 and is forecast to reach USD 3,664.79 million by 2031, advancing at an 18.27% CAGR over the period. Accelerated capital expenditure by global cloud providers, the arrival of high-capacity submarine cables, and strict data-sovereignty mandates combine to keep the growth curve steep, while IT load capacity climbs from 626.07 MW to 971.97 MW at a 7.61% CAGR a spread that signals greater rack-level density, premium pricing for AI-ready halls, and widening margins for operators able to deliver liquid-cooled environments. Strategic landings of the Equiano and 2Africa cables have turned the country into a continental traffic hub, reducing international bandwidth costs by up to 70% and encouraging content providers to localize latency-sensitive workloads. Simultaneously, renewable power purchase agreements (PPAs) and on-site solar projects cushion operators from Eskom’s grid instability, while regulatory incentives tied to the National Data and Cloud Policy guarantee baseline demand for in-country hosting. The combination of hyperscaler self-build momentum, a maturing colocation ecosystem, and sustained fintech digitization ensures that the South Africa hyperscale data center market remains on a long-term capacity expansion path.
Key Report Takeaways
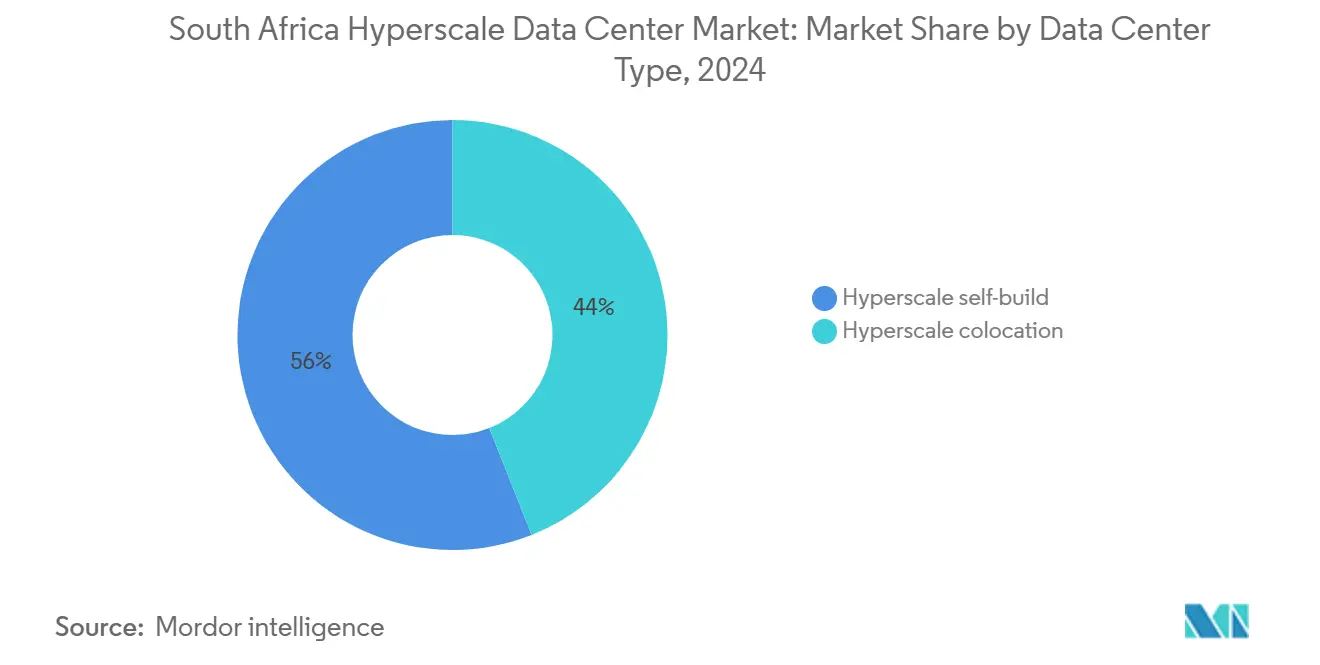
- By data center type, hyperscale colocation led with 56% revenue share in 2024; hyperscaler self-build facilities are projected to grow at an 18.2% CAGR through 2031.
- By component, IT infrastructure commanded 40.5% of 2024 spending, while cooling systems are advancing at a 16.7% CAGR on the back of AI-driven liquid-cooling retrofits.
- By tier standard, Tier III captured 69% of 2024 capacity, whereas Tier IV facilities are set to post a 15.1% CAGR to 2031.
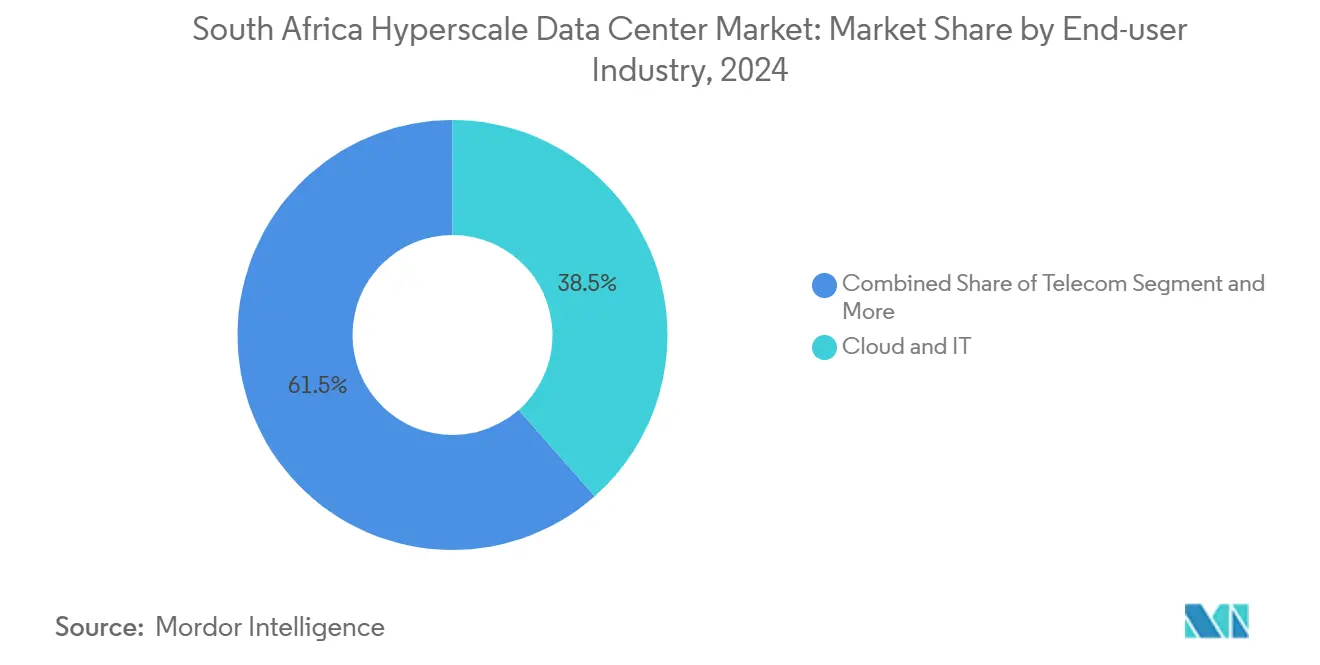
- By end-user industry, cloud and IT applications held 38.5% share of the South Africa hyperscale data center market size in 2024 and will maintain an 18.3% CAGR to 2031.
- By data center size, massive sites represented 40.2% of installed load in 2024, but mega sites are forecast to expand at a 19.8% CAGR over the outlook period.
The contribution of South africa may read different when placed against the full pool of global outputs. The worldwide hyperscale data center market shares by Mordor Intelligence reflect that proportional balance.
South Africa Hyperscale Data Center Market Trends and Insights
Drivers Impact Analysis*
| Driver | (~) % Impact on CAGR Forecast | Geographic Relevance | Impact Timeline |
|---|---|---|---|
| Surge in hyperscaler cloud-region launches | +3.20% | Gauteng, Western Cape | Medium term (2-4 years) |
| Sub-sea cable landings (2Africa, Equiano) | +2.80% | Western Cape, KwaZulu-Natal | Long term (≥ 4 years) |
| Digital-sovereignty laws mandating hosting | +2.10% | National | Short term (≤ 2 years) |
| Renewable PPAs leveraging solar and wind | +1.90% | Gauteng, Western Cape, Eastern Cape | Medium term (2-4 years) |
| Mobile-money and RTP boom fueling Tier IV hubs | +1.70% | Gauteng, Western Cape | Short term (≤ 2 years) |
| GenAI inferencing nodes needing liquid edge | +2.30% | Gauteng, Western Cape | Medium term (2-4 years) |
| Source: Mordor Intelligence | |||
Surge in Hyperscaler Cloud-Region Launches
Google’s Johannesburg region went live in 2024, followed by Microsoft’s ZAR 5.4 billion (USD 0.30 billion) capacity build that prioritizes AI services [1].Google Cloud Blog, “New Google Cloud Region Now Open in Johannesburg,” google.com Enterprises demanding sub-20 ms latency for high-frequency trading, retail payments, and video collaboration are migrating away from European hosting, creating anchor-tenant contracts of 20–40 MW per region. AWS has earmarked USD 400 million to match these footprints, meaning each additional availability zone instantly lifts base demand for the South Africa hyperscale data center market. With every cloud-region launch generating years of dedicated expansions and inter-connection cross-connect sales, the revenue flywheel for wholesale colocation and edge facilities remains powerful.
Sub-sea Cable Landings Drive Connectivity Infrastructure
Equiano’s 144 Tbps design and 2Africa’s ring architecture fundamentally re-route east-west traffic, slashing transit costs and reshaping content-delivery economics [2]Submarine Networks, “Equiano,” submarine-networks.com. Cable landing points in Cape Town and Durban now act as magnets for GPU-dense build-outs where hyperscalers can terminate directly onto international fiber. Teraco’s Cape Town campus shows international round-trip latency in the single-digit milliseconds to Lisbon, a performance advantage that pulls AI inferencing, gaming, and OTT workloads closer to end users.
Digital-Sovereignty Laws Mandate Local Data Hosting
The National Data and Cloud Policy obliges government and regulated industries to process sensitive information domestically, effectively hard-wiring a compliance premium into facility design and uptime specifications. Financial institutions must keep payment-clearing data inside the country under South African Reserve Bank guidelines, prompting Tier IV builds with 99.995% availability for mission-critical workloads. The regulatory certainty boosts forward-booking for wholesale halls, insulating the South Africa hyperscale data center market against cyclical slowdowns.
Renewable PPAs Leverage Abundant Solar and Wind
Teraco’s 120 MW solar farm, operational in 2026, will feed 354,000 MWh annually at less than ZAR 0.60 per kWh—half Eskom’s industrial tariff. Operators signing 15-year PPAs reduce exposure to volatile diesel costs and meet hyperscaler net-zero mandates simultaneously. Microsoft’s zero-water cooling prototypes in Gauteng complement these PPAs by reducing both electricity and water draws, creating an ESG-weighted differentiator for tenant RFPs.
Restraints Impact Analysis*
| Restraint | (~) % Impact on CAGR Forecast | Geographic Relevance | Impact Timeline |
|---|---|---|---|
| Grid unreliability and diesel cost inflation | -2.70% | National, acute in Gauteng | Short term (≤ 2 years) |
| Skilled-talent shortage in HV O and M | -1.90% | National | Medium term (2-4 years) |
| Water-stress moratoria on evaporative cooling | -1.40% | Western Cape, Eastern Cape | Long term (≥ 4 years) |
| GPU/optic allocation bias toward Tier-1 | -1.80% | National | Short term (≤ 2 years) |
| Source: Mordor Intelligence | |||
Grid Unreliability and Diesel Cost Inflation
Eskom’s load-shedding episodes require operators to over-size gensets and battery strings, adding 15% to initial capex and inflating annual opex by 25–30% above global norms [3].Data Centre Magazine, “South Africa Calls for Data Centres to Cut Grid Reliance,” datacentremagazine.com Diesel prices have climbed 40% since 2024, and maintenance intervals shortened by the increased run-hours further squeeze margins. Operators able to pair solar arrays with battery storage see immediate cost relief and marketing value, turning grid weakness into a competitive moat.
Skilled-Talent Shortage in High-Voltage Electrical and Mechanical Operations
The technical college pipeline fills only two-thirds of the annual demand for 11 kV switchgear specialists and liquid-cooling technicians, forcing operators to import expertise at 40–50% wage premiums. Visa backlogs and rotation fatigue elevate project risks and lengthen commissioning schedules, a bottleneck expected to persist until at least 2028 despite government training spending.
*Our forecasts treat driver/restraint impacts as directional, not additive. The impact forecasts reflect baseline growth, mix effects, and variable interactions.
Segment Analysis
By Data Center Type: Self-Build Momentum Accelerates
Self-build capacity is scaling at an 18.2% CAGR even as colocation still owns 56% of 2024 revenue in the South Africa hyperscale data center market. Hyperscalers perceive proprietary facilities as the only way to secure 80 kW-racks, liquid-cooling, and 200 W-per-GPU thermal envelopes. Colocation continues to thrive on interconnection density; Digital Realty’s Teraco purchase extended its cross-connect lead to 25,000+ live ports, preserving its role as carrier-neutral core for enterprises. Over the forecast horizon, the South Africa hyperscale data center market size tied to self-build footprints could surpass USD 1.5 billion, but carrier-dense colo campuses will continue serving latency-sensitive multicloud traffic, ensuring both models grow in parallel.
Hyperscalers accept higher initial capex to lock in AI-grade layouts; Microsoft’s ZAR 5.4 billion (USD 0.30 billion) plan in Gauteng pairs direct-to-chip liquid loops with 100% renewable PPAs to hit Scopes 1-3 carbon targets. Colos are reacting by launching build-to-suit blocks inside existing campuses so that tenants can overlay bespoke cooling onto a shared backbone. This hybridization keeps the South Africa hyperscale data center market share of colocation stable yet shifts margin mix toward premium, AI-tuned whitespace.


By Component: Cooling Systems Drive Infrastructure Evolution
IT gear remains the single biggest spend bucket at 40.5% in 2024, yet cooling is the fastest-growing line item, up 16.7% CAGR through 2030 as average rack density triples. The South Africa hyperscale data center market size allocated to cooling could top USD 680 million by 2031, given the adoption of secondary heat-recovery loops and dielectric immersion for GPUs.
Electrical systems scale alongside: 30 MW UPS blocks and 275 kV feed bays become standard as mega-campuses emerge. Modular “power skids” shave 20 weeks off build schedules, a critical lever in capturing hyperscaler RFPs. On the mechanical side, chilled-water plants give way to rear-door heat-exchanger rows and immersion tanks. Component suppliers able to bundle pumps, CDU manifolds, and leak-detection sensors are finding ready customers, reinforcing their foothold in the South Africa hyperscale data center industry.
By Tier Standard: Tier IV Demand Reflects Mission-Critical Requirements
Tier III still dominates on installed capacity, but Tier IV’s 15.1% CAGR shows purchasers willingly pay a 40% capex premium for five-nines availability. The spread of mobile-money platforms and always-on trading desks leaves no tolerance for downtime, explaining why Tier IV’s South Africa hyperscale data center market share is widening within BFSI and public-sector tenders.
Grid instability raises brown-out risk, pushing procurement specs toward 2N power trains, 72-hour diesel reserves, and onsite water storage. Equinix’s USD 160 million Johannesburg facility adopts full Tier IV design to differentiate against Tier III incumbents, signaling an enduring flight to resilience.
By End-User Industry: Cloud and IT Dominance Reinforces Growth
Cloud and IT already command 38.5% of 2024 demand and continue to grow at 18.3% CAGR, making them both the largest and fastest segment inside the South Africa hyperscale data center market.. Telcos maintain steady racks for CDN nodes, whereas BFSI workloads expand 14% annually as banks pivot to API-first platforms.
Manufacturing firms deploying IIoT gateways need regional processing for predictive maintenance, while public-sector digitization pushes e-government apps into Tier IV halls. Retail e-commerce loads spike on Amazon’s entry, and media houses localize streaming libraries to trim peering fees. Each vertical adds consistent incremental MW, feeding a cumulative demand ramp that underpins operator pipeline confidence.

By Data Center Size: Mega Facilities Lead Capacity Expansion
Massive (25–60 MW) halls remain the base build, yet mega sites show the highest 19.8% CAGR as AI training favors concentrated GPU clusters. The South Africa hyperscale data center market size tied to mega campuses could exceed USD 1 billion by 2030, with Digital Realty evaluating 100 MW blueprints on 60-hectare parcels in Gauteng.
Mega formats lower unit opex by 15–20% through shared chillers and high-capacity feeders, but only operators with balance-sheet heft can fund multi-phase builds.
Geography Analysis
Gauteng sits at the epicenter of the South Africa hyperscale data center market, hosting over 60% of deployed IT load and virtually all live self-build campuses. Its fiber lattice, financial-services concentration, and proximity to OR Tambo International Airport create a gravitational pull for new entrants. However, reliance on Eskom’s embattled grid drives operators to install private substations and solar arrays, slightly raising build costs yet offering unmatched customer density.
The Western Cape forms the secondary pole of growth thanks to Equiano’s cable landing in Cape Town and ample solar-plus-wind resources that appeal to ESG-conscious tenants. Latency to European exchange points below 170 ms places the province as the continental egress node for intercontinental SaaS traffic. Provincial water-stress rules encourage early adoption of closed-loop cooling, ensuring new halls meet future regulatory tightening without retrofit expense.
KwaZulu-Natal and Eastern Cape round out the landscape. Durban’s port and 2Africa landing position KwaZulu-Natal for edge nodes serving maritime logistics and gaming users, though the local enterprise base remains small. Eastern Cape’s wind corridors allow sub-1.0 PUE designs using free-cooling nine months per year, making it a candidate for renewable-led mega campuses. Government infrastructure allocations of ZAR 158.54 billion (USD 8.83 billion) across ICT projects could accelerate pipeline approvals, expanding the South Africa hyperscale data center industry footprint into previously under-served regions.
The hyperscale data center market is analyzed by Mordor Intelligence across multiple other geographies, with in-depth regional assessments available for Africa, Middle East, and South America. This is complemented by country-specific insights for Saudi Arabia, Brazil, Malaysia, India, Germany, and Indonesia, reflecting various localized market behavior and policy environments' coverage.
Competitive Landscape
The market shows moderate consolidation. Digital Realty’s USD 1.7 billion purchase of Teraco created the largest single player, immediately integrating 228 MW of live capacity and more than 25,000 cross-connects. Equinix’s USD 160 million debut narrowed the gap, turning premium colocation into a two-horse race backed by global capital. Together the top two control roughly 55% of live inventory, giving them scale to negotiate favorable PPA terms and first-line GPU allocations.
Hyperscalers pursue mixed models—Microsoft and Google push self-build footprints while preserving colo presence for interconnect density, ensuring that no single supplier owns the entire wallet. Regional specialists such as Africa Data Centres and Raxio Group leverage local permits and municipal power relationships to carve niche positions, especially in edge and secondary markets. Technology differentiation now hinges on liquid-cooling competence and renewable integration; Teraco’s immersion-ready halls and 120 MW solar farm offer tangible advantages, while Equinix’s global IBX fabric grants instant reach to 250+ clouds.
Start-ups in the cooling and DCIM stack, including immersion-tank vendors and AI-driven facility-management platforms, gain entry via pilot deployments that cut PUE and automate predictive maintenance. As GPU allocations loosen post-2026, the playing field may level, but capital intensity remains a barrier, keeping the South Africa hyperscale data center market relatively concentrated compared with enterprise colocation or edge.
South Africa Hyperscale Data Center Industry Leaders
Teraco Data Environments
Africa Data Centres
Vantage Data Centers
Amazon Web Services
Microsoft Corporation
- *Disclaimer: Major Players sorted in no particular order

Recent Industry Developments
- July 2025: Visa opened its first Africa data center in Johannesburg, illustrating multinational confidence in local processing.
- March 2025: Microsoft committed ZAR 5.4 billion (USD 289 million) to scale cloud and AI infrastructure, its largest local investment to date.
- January 2025: Google Cloud activated its Johannesburg region, offering low-latency services across the continent.
- December 2024: Africa50 placed USD 15 million in Raya Data Center to strengthen regional capacity.
- November 2024: Teraco secured an 8 billion-rand (USD 442 million) loan from Absa for an AI-ready expansion.


Research Methodology Framework and Report Scope
Market Definitions and Key Coverage
We count the South Africa hyperscale data center market as the yearly spend on facilities supplying >=10 MW of dedicated IT load to a single cloud tenant, whether owner-operated or leased on wholesale terms. Each site employs modular electrical, cooling, and network fabrics that allow near-linear expansion and operates at Tier III or higher resiliency.
Scope exclusion: small enterprise server rooms, multi-tenant retail colocation halls below 10 MW, and edge micro-sites are outside this scope.
Segmentation Overview
- By Data Center Type
- Hyperscale Self-build
- Hyperscale Colocation
- By Component
- IT Infrastructure
- Server Infratsructure
- Storage Infrastructure
- Network Infrastructure
- Electrical Infrastructure
- Power Distribution Unit
- Transfer Switches and Switchgears
- UPS Systems
- Generators
- Other Electrical Infrastructure
- Mechanical Infrastructure
- Cooling Systems
- Racks
- Other Mechanical Infrastructure
- General Construction
- Core and Shell Development
- Installation and Commisioning Services
- Design Engineering
- Fire Detection, Suppression and Physical Security
- DCIM/BMS Solutions
- IT Infrastructure
- By Tier Standard
- Tier III
- Tier IV
- By End-user Industry
- Cloud and IT
- Telecom
- Media and Entertainment
- Government
- BFSI
- Manufacturing
- E-Commerce
- Other End Users
- By Data Center Size
- Large (Less than equal to 25 MW)
- Massive (Greater than 25 MW and less than equal to 60 MW)
- Mega (Greater than 60 MW)
Detailed Research Methodology and Data Validation
Primary Research
Mordor analysts interviewed local engineering consultancies, utility planners, campus operations heads, and cloud procurement managers across Gauteng and Western Cape. These conversations validated load-ramp assumptions, typical power-usage-effectiveness (PUE) targets, and landed-cost differentials for imported switch-gear, filling gaps that documents alone could not address.
Desk Research
Our desk work begins with public macro indicators, electricity-generation statistics from Eskom, fixed-broadband uptake, and internet-traffic data from the Independent Communications Authority of South Africa, cloud-region announcements logged on the Submarine Cable Map, and labor-cost series from Statistics South Africa. We add insight from trade bodies such as the South African Cloud and Data Centre Association, customs data for high-density IT hardware, and company filings of leading developers.
To size operator balance sheets and capital flows, analysts tap D&B Hoovers and news archives on Dow Jones Factiva, then cross-read government budget papers for green-energy incentives that directly influence build economics. The sources listed illustrate our approach; many other references inform granular checks along the way.
Market-Sizing & Forecasting
A top-down reconstruction starts with national data-center power draw, subtracts non-hyperscale volumes, then applies measured penetration rates of >=10 MW builds by year. Results are stress-tested through selective bottom-up checks, sampled campus counts, average contract-ed unit cost (USD / MW) times observed capacity, and adjusted where deltas exceed 7 percent. Key variables in the model include new submarine-cable landings, cloud-region go-live timelines, diesel-generation premiums, renewable PPA uptake, average PUE drift, and ZAR-USD exchange paths. Five-year forecasts employ multivariate regression on those drivers with an ARIMA overlay to capture cyclical grid-availability shocks flagged by primary sources. Gap areas such as undisclosed private builds are bridged by scenario bands anchored to supplier shipment trends.
Data Validation & Update Cycle
Outputs run through variance checks versus grid consumption, import manifests, and construction tenders; anomalies trigger analyst re-work before sign-off. Reports refresh annually, and any material event, utility tariff reset, new hyperscaler campus, or load-shedding regulation is fast-tracked into an interim update so clients always receive the latest view.
Why our South Africa Hyperscale Data Center Baseline commands reliability
Published figures often diverge because firms mix enterprise, colocation, and hyperscale spend, choose different base years, or roll forward aggressive utilization curves.
By limiting scope to >=10 MW builds, aligning currency conversions to South African Reserve Bank quarterly averages, and refreshing the model every twelve months, Mordor delivers a traceable midpoint between optimistic developer decks and conservative investment briefs.
Benchmark comparison
| Market Size | Anonymized source | Primary gap driver |
|---|---|---|
| USD 1.34 B (2025) | Mordor Intelligence | - |
| USD 2.16 B (2024) | Regional Consultancy A | Combines all data-center types and counts full CAPEX outlays rather than annualized project spend |
| USD 1.6 B (2027) | Trade Journal B | Uses a later base year and models revenue at exit capacity rather than phased ramp-up |
Taken together, the comparison shows that while others provide useful directional insight, Mordor's disciplined scope, variable selection, and refresh cadence produce a balanced, decision-ready baseline clients can rely on.


Key Questions Answered in the Report
How large is hyperscale data center spending in South Africa today and what is its growth pace?
Spending is USD 1,339.26 million in 2025 and is forecast to reach USD 3,664.79 million by 2031, reflecting an 18.27% CAGR.
Which provinces attract most new facility builds?
Gauteng hosts more than 60% of installed IT load, while Western Cape is the fastest-growing secondary node due to subsea cable landings and abundant renewables.
Why are Tier IV halls gaining momentum?
Financial-services and public-sector workloads need 99.995% uptime during grid disruptions, pushing Tier IV capacity to a 15.1% CAGR through 2031.
What cooling technologies are operators adopting for AI racks?
Liquid-cooling systems, including rear-door heat exchangers and direct-to-chip loops, are expanding at a 16.7% CAGR to handle 80 kW-per-rack GPU densities.
How are power-supply risks being mitigated?
Operators sign long-term solar and wind PPAs and build on-site generation—Teraco’s 120 MW solar farm cuts energy costs in half and shields facilities from Eskom load-shedding.
Which end-user segment drives the most demand?
Cloud and IT workloads hold 38.5% of 2024 capacity and are expanding at an 18.3% CAGR as hyperscalers launch Johannesburg regions and migrate enterprise data on-shore.
Page last updated on:


