Africa Hyperscale Data Center Market Size and Share
Market Overview
| Study Period | 2019 - 2031 |
|---|---|
| Forecast Data Period | 2025 - 2031 |
| Historical Data Period | 2019 - 2023 |
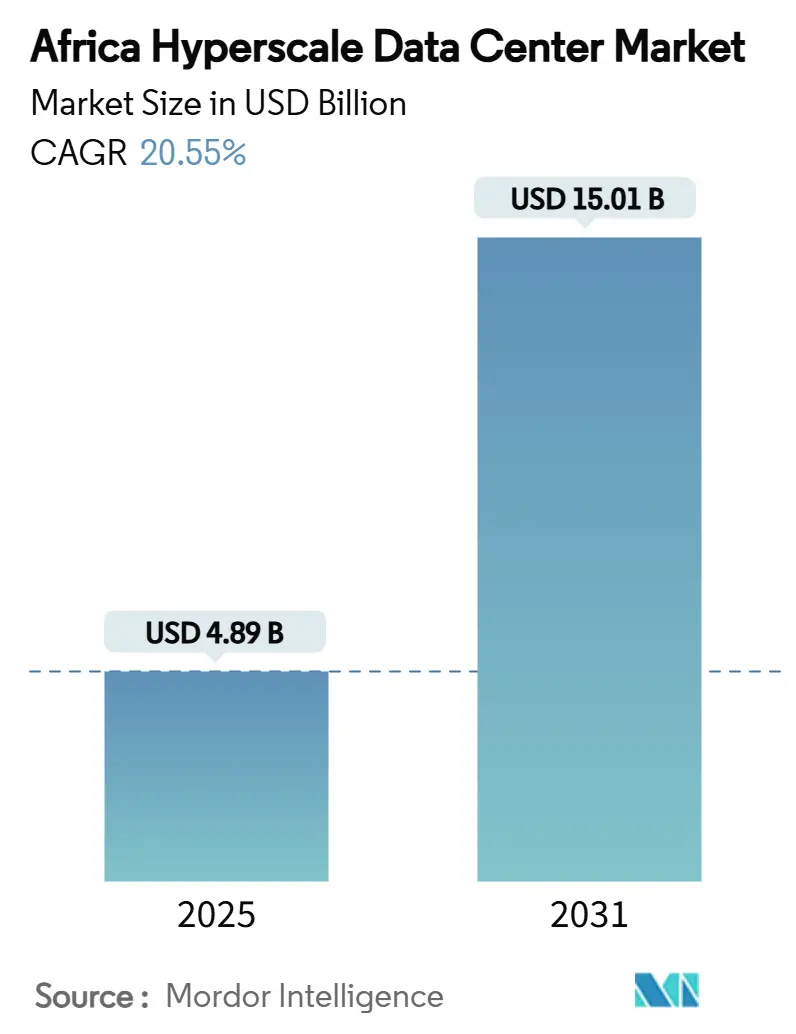
| Market Size (2025) | USD 4.89 Billion |
| Market Size (2030) | USD 15.01 Billion |
| Growth Rate (2025 - 2030) | 20.55% CAGR |
| Market Concentration | Medium |
Major Players *Disclaimer: Major Players sorted in no particular order Image © Mordor Intelligence. Reuse requires attribution under CC BY 4.0. | |
Africa Hyperscale Data Center Market Analysis by Mordor Intelligence
The Africa hyperscale data center market size is valued at USD 4,890.11 million in 2025 and is forecast to reach USD 15,008.05 million by 2031, expanding at a 20.55% CAGR. Capacity grows even faster, rising from 1,643.16 MW in 2025 to 5,628 MW by 2031 at a 22.78% CAGR, a sign that operators are driving higher power density and operational efficiency. Southern Africa leads with 33% revenue share in 2024, supported by reliable grid power, seasoned engineering talent and dense submarine-cable landings. Hyperscale colocation continues to dominate overall demand, yet self-build facilities are accelerating as global cloud providers seek direct control over compliance and energy strategy. Liquid-cooled designs, renewable power-purchase agreements and stricter digital-sovereignty laws form the core opportunity set that shapes the next investment wave for the Africa hyperscale data center market.
Key Report Takeaways
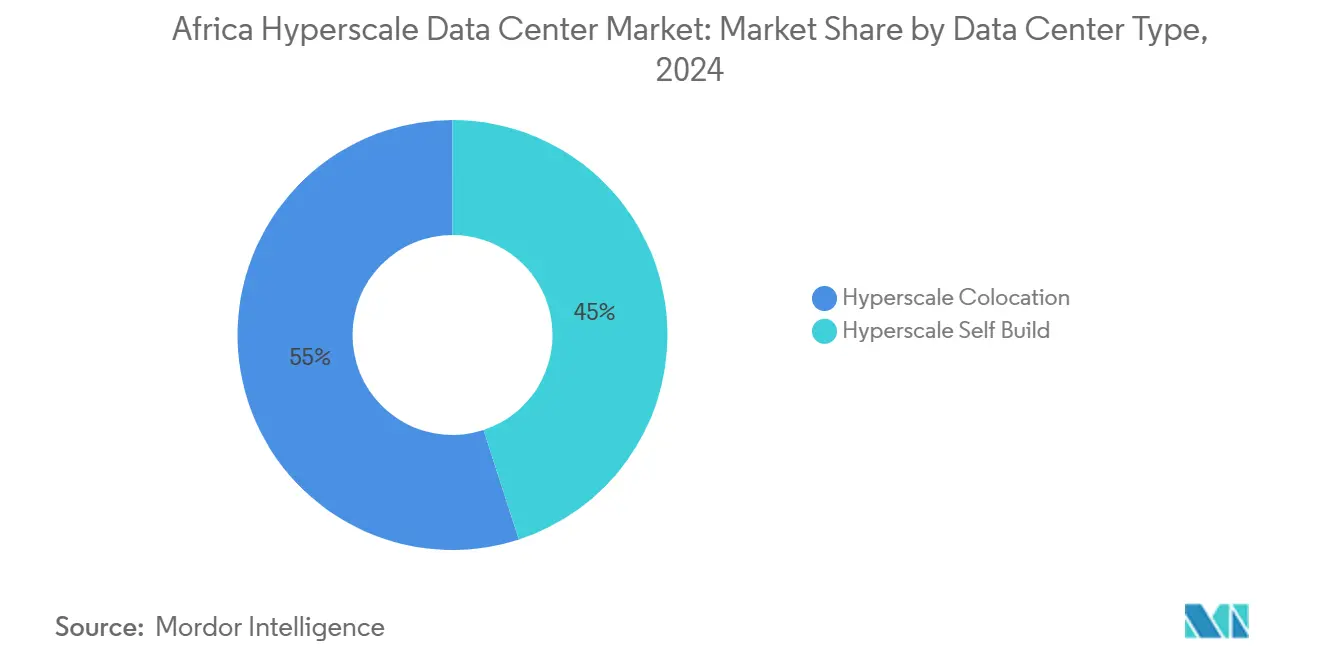
- By data center type, hyperscale colocation led with 55% revenue share in 2024 while hyperscaler self-build facilities are advancing at an 18.40% CAGR through 2031.
- By component, IT infrastructure accounted for 46% spending in 2024, whereas cooling systems are growing the fastest at 20.70% CAGR.
- By tier, Tier III facilities commanded 68% share in 2024 and Tier IV is expanding at 14.20% CAGR to 2031.
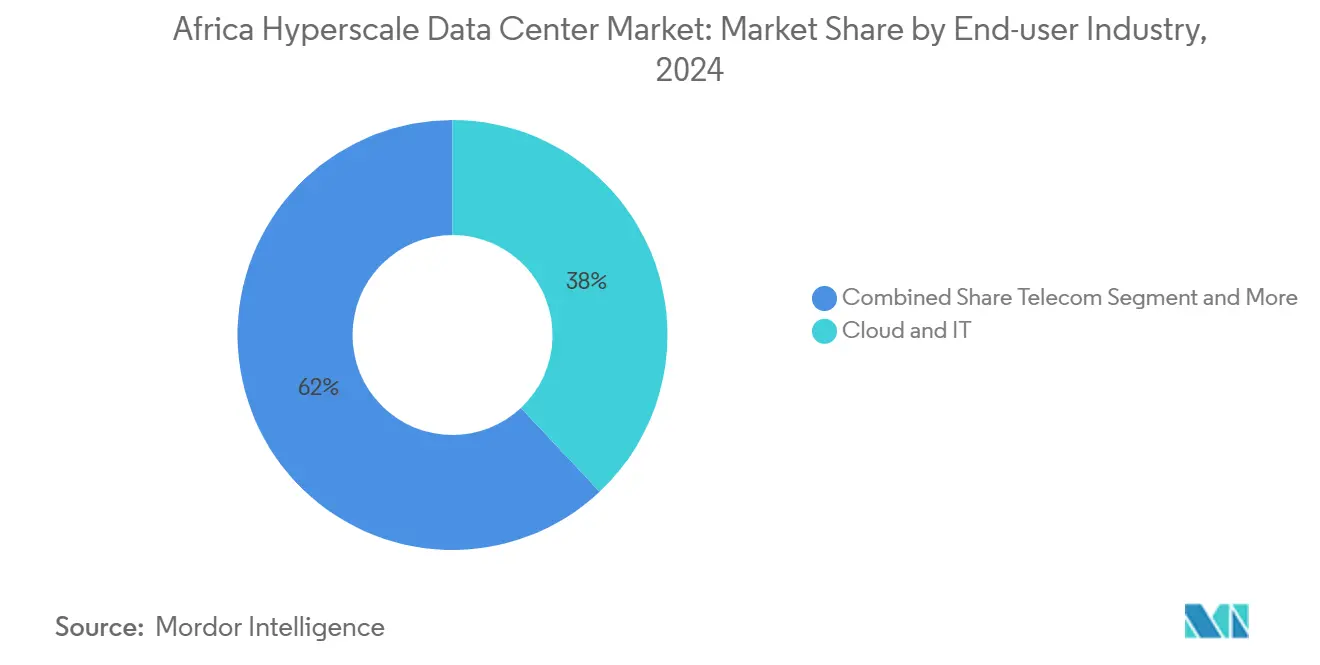
- By end-user industry, cloud and IT held 38% share in 2024 and is rising at 22.50% CAGR through 2031.
- By data center size, large facilities captured 51% of the Africa hyperscale data center market share in 2024, while mega sites are increasing at 19.10% CAGR.
- By geography, South Africa contributed 33% of 2024 revenue and continues to post an 11.20% CAGR through 2030
Expected changes in Africa many a times form part of a broader pattern of global movement rather than an isolated trend. The report on worldwide hyperscale data center market outlook by Mordor Intelligence brings these expectations together.
Africa Hyperscale Data Center Market Trends and Insights
Drivers Impact Analysis*
| Driver | (~)% Impact on CAGR Forecast | Geographic Relevance | Impact Timeline |
|---|---|---|---|
| Surge in cloud-region launches by hyperscalers | +3.20% | Global, with concentration in Southern and West Africa | Medium term (2-4 years) |
| Sub-sea cable landings (2Africa, Equiano) | +2.80% | Coastal regions, particularly West and East Africa | Short term (≤ 2 years) |
| Digital-sovereignty laws mandating local hosting | +1.90% | Global, with early adoption in Nigeria, South Africa, Kenya | Long term (≥ 4 years) |
| Renewable PPAs leveraging abundant solar and wind | +2.10% | Southern Africa, North Africa, select East African markets | Medium term (2-4 years) |
| Mobile-money and RTP boom driving Tier IV fintech hubs | +1.70% | East and West Africa, particularly Kenya, Nigeria, Ghana | Medium term (2-4 years) |
| GenAI inferencing nodes needing liquid-cooled edge | +1.40% | Major metropolitan areas across all regions | Long term (≥ 4 years) |
| Source: Mordor Intelligence | |||
Surge in Cloud-Region Launches by Hyperscalers
Hyperscalers are rolling out full cloud regions across Africa to curb latency and meet data-residency mandates. Microsoft’s USD 1 billion Kenya program and its geothermal-powered campus show how corporate strategies now hinge on localized energy and regulatory alignment. Amazon Web Services and Google Cloud are following the same playbook, competing to lock in early enterprise customers before tighter rules raise entry barriers. Country-level incentives, such as tax holidays on imported IT gear in Kenya, accelerate build timelines and trim opex. Competitive stakes are rising because the first provider to achieve sub-100 ms latency in a market typically becomes the default platform for fintech and e-commerce workloads. As a result, the Africa hyperscale data center market records fresh land acquisitions around Nairobi, Lagos and Johannesburg each quarter.
Sub-sea Cable Landings (2Africa, Equiano)
Completion of the 45,000 km 2Africa system and Google’s 144 Tbps Equiano cable has slashed international transit prices by up to 40% in Nigeria and South Africa [1].Google Cloud, “Introducing Equiano, a subsea cable from Portugal to South Africa,” cloud.google.com Lower backhaul costs permit hyperscale operators to build in-country rather than rely on hubs in Europe, changing the economics of megawatt-scale builds. Carrier-neutral landing sites in Lagos and Cape Town are evolving into natural aggregation points for edge nodes and AI inference clusters. Bandwidth abundance unlocks new use cases such as cloud gaming and real-time analytics that require high throughput and jitter below 10 ms. The throughput surplus also gives telcos confidence to bundle content-delivery and managed cloud in the same campus, reinforcing the flywheel for fresh capacity additions within the Africa hyperscale data center market.
Digital-Sovereignty Laws Mandating Local Hosting
Nigeria’s Data Protection Regulation, South Africa’s POPIA and Kenya’s Data Protection Act oblige firms to store resident data locally, compelling multinationals to procure domestic racks instead of colocating abroad [2].Tech Hive Advisory, “Understanding Botswana's New Data Protection Act,” techhiveadvisory.africa The African Union’s 2024 Data Policy Framework provides a pan-continental template that prioritizes local value capture, yet uneven enforcement across jurisdictions favours operators capable of multiregional compliance. Penalties for non-compliance now exceed USD 250,000 per incident in some markets, motivating banks and telcos to migrate to in-country Tier IV vaults. Consequently, the Africa hyperscale data center market sees self-build projects fast-tracked by foreign banks that formerly relied on European facilities. Rising demand for dedicated racks with tamper-proof hardware elevates the attractiveness of sovereign cloud partnerships between governments and leading hyperscalers
Renewable PPAs Leveraging Abundant Solar and Wind
Dataset-driven companies insist on carbon-neutral hosting, and Africa’s solar resource enables sub-USD 0.05/kWh contracts, beating Europe and North America by a wide margin. Teraco’s 120 MW solar farm in South Africa illustrates how developers blend behind-the-meter renewables with grid supply to hedge diesel price shocks. North African governments market gigawatt-scale clean-power corridors to lure AI-ready mega campuses that export compute to Europe. Flexible PPA models mean operators can sign for daytime solar, then pair with on-site batteries or gas turbines for evening peaks. Sustainability credentials now feature in hyperscaler RFP scoring, making renewable integration a competitive lever within the Africa hyperscale data center market
Restraints Impact Analysis*
| Restraint | (~)% Impact on CAGR Forecast | Geographic Relevance | Impact Timeline |
|---|---|---|---|
| Grid unreliability and diesel cost inflation | -2.30% | Sub-Saharan Africa, particularly Nigeria, Ghana, Kenya | Short term (≤ 2 years) |
| Skilled-talent shortage in HV electrical and mechanical O and M | -1.80% | Global, with acute shortages in Central and East Africa | Medium term (2-4 years) |
| Water-stress moratoria on evaporative cooling | -1.20% | Urban centers in Southern and West Africa | Long term (≥ 4 years) |
| GPU/optic allocation bias toward Tier-1 regions | -0.90% | Global, affecting AI infrastructure deployment timelines | Medium term (2-4 years) |
| Source: Mordor Intelligence | |||
Grid Unreliability and Diesel Cost Inflation
Sub-Saharan grids deliver 60% or lower uptime, forcing data centers to carry 100% backup generation capacity. Diesel prices increased 35% between 2024 and 2025, driving energy costs to USD 0.25/kWh during extended outages [3].Energies, “The Energy Cost Analysis of Hybrid Systems and Diesel Generators in Powering Selected Base Transceiver Station Locations in Nigeria,” mdpi.com Operators oversize switchgear and UPS lines by 15-20% to accommodate genset failover, inflating capex by millions of USD per site. Emerging hybrid models blend solar, storage and bio-diesel to cut runtime on generators, yet adoption is slow in dense urban plots where space is scarce. AI training clusters, which cannot tolerate brownouts, shift workloads to sites with dual 132 kV feeds, reinforcing geographic disparity in the Africa hyperscale data center market.
Skilled-Talent Shortage in HV Electrical and Mechanical O and M
Vacancy rates for high-voltage operations and liquid-cooling technicians reach 40% in several African metros. Brain drain toward European hubs and limited university programs extend recruitment cycles beyond nine months. Operators import specialists on rotational contracts, adding USD 200,000-plus to annual operating budgets for a 10 MW plant. The gap is most acute for liquid-cooling systems supporting 40-140 kW racks, where even OEMs lack local service partners. Apprenticeship pipelines exist but take 18-24 months to mature, meaning talent scarcity will restrain the speed at which the Africa hyperscale data center market can commission new capacity through 2027.
*Our forecasts treat driver/restraint impacts as directional, not additive. The impact forecasts reflect baseline growth, mix effects, and variable interactions.
Segment Analysis
By Data Center Type: Self-Build Momentum Accelerates
The Africa hyperscale data center market size for colocation stood at a 55% revenue share in 2024, underpinned by enterprise customers that prefer opex models. Self-build projects, however, are scaling at an 18.40% CAGR, narrowing the gap as cloud providers internalize control.
Hyperscalers commit multi-billion-dollar global budgets that carve out capital for Nairobi, Lagos and Cape Town campuses. Amazon’s USD 150 billion global program allocates fresh MWs to Africa, while Microsoft’s own sites in Kenya mark a readiness to manage compliance directly. Colocation firms respond by layering AI-ready pods and sovereign-cloud zones, keeping them relevant for financial-services and government tenants whose policies still mandate third-party segregation.


By Component: Cooling Systems Drive Infrastructure Evolution
IT equipment captured 46% of 2024 spend, yet the cooling budget is climbing fastest at 20.70% CAGR as rack densities breach 40 kW thresholds. Africa hyperscale data center market size for cooling hardware is accelerating because direct-to-chip and immersion solutions now ship alongside H100 GPU clusters.
LiquidStack’s USD 20 million raise signals robust investor appetite for immersion tech. Direct-liquid adoption compresses white-space footprints, allowing higher MW per acre, but ramps mechanical complexity. Construction expenditure is trending toward prefabricated modules with integrated coolant manifolds, trimming time-to-market by up to 20%.
By Tier Standard: Tier IV Adoption Accelerates
Tier III sites hold 68% share, offering 99.98% uptime acceptable for most digital-economy workloads. The share of Tier IV is small but climbing at 14.20% CAGR because regulators tie banking and critical-infrastructure licensing to 99.995% availability.
Mobile-money ecosystems, such as MTN MoMo with 338 million annual transactions, migrate payment cores into Tier IV vaults to avert downtime penalties. Governments likewise commission fault-tolerant facilities, exemplified by Uganda’s national data center serving 57 agencies. Such mandates push the Africa hyperscale data center market toward more complex dual-bus electrical designs.
By End-User Industry: Cloud and IT Dominance Continues
Cloud and IT workloads accounted for 38% revenue in 2024 and post a 22.50% CAGR, reflecting their dual role as both tenants and builders. Telcos follow as they densify 5G and edge POPs.
Fintech innovation remains a prime demand vector: Moniepoint processes 650 million transactions worth USD 14 billion each month, relying on 600 microservices distributed across hyperscale nodes. Government digitization and e-commerce expansion add incremental loads, sustaining broad-based diversification within the Africa hyperscale data center industry.

By Data Center Size: Mega Facilities Gain Momentum
Large (Less than equal to 25 MW) sites capture 51% of 2024 capacity because they map neatly to enterprise colocation economics. Mega (Greater than 60 MW) grow faster at 19.10% CAGR as GenAI training moves on-shore.
Cassava Technologies’ planned AI factory in South Africa will anchor more than 60 MW of IT load while exporting inference services to Egypt, Kenya and Nigeria. Such mega builds press utilities for 132 kV hookups and spur investments in dedicated solar farms, shifting the center of gravity for the Africa hyperscale data center market.
Geography Analysis
South Africa controls 33% revenue and sustains 11.20% CAGR on the back of South Africa’s mature grid, skilled labor and cable density. West Africa follows, propelled by Nigeria and Ghana, but faces steeper diesel OPEX.
South Africa remains the nucleus of African cloud infrastructure. It provides stable 400 kV transmission, seasoned engineering contractors and multiple Equiano/2Africa landings. Teraco’s USD 442 million Johannesburg campus expansion nearly doubles its platform to 200 MW, and Digital Realty’s buy-out integrates those sites into its global mesh, ensuring instant cross-connects for multinationals. Policies that fast-track renewable PPAs fuel further growth; management targets 100% clean power by 2035.
West Africa offers the largest addressable consumer base. Equiano and 2Africa cables converge in Lagos, driving wholesale price drops that spark new video-streaming and gaming traffic. Yet 60% grid reliability obliges facilities to overspend on diesel and storage. Huawei’s new Nigeria cloud region shows that hyperscalers will still invest where fintech traffic justifies premium opex.
East Africa builds on Kenya’s geothermal portfolio and Ethiopia’s liberalizing telecom sector. Microsoft and G42’s geothermal site showcases carbon-neutral possibilities underpinned by 24 × 7 power commitments. North Africa leverages Morocco’s solar-plus-wind hybrids to market itself as a climate-positive compute exporter to Europe. The DR Congo and Mozambique mark Central Africa’s early green shoots, with Raxio and OADC proving that secondary metros can pencil out once cable diversity improves. Altogether, these patterns spread investment beyond the traditional Johannesburg-Cape Town axis, cultivating a more balanced Africa hyperscale data center market.
Mordor Intelligence's coverage of the hyperscale data center market extends across other regions including South America, Asia, and Europe, while country-specific intelligence is also available for South Africa, India, Germany, Indonesia, Thailand, and Philippines, each offering a view on the jurisdiction-level dynamics as applicable.
Competitive Landscape
The Africa hyperscale data center market shows moderate concentration: no single player holds above 15% share, while the top five account for roughly 45%. Global REITs and cloud giants fuel scale through M and A, whereas regional specialists win with regulatory fluency and local partnerships.
Regional champions Teraco, Africa Data Centres and Raxio Group expand via syndicated loans and IFC financing that prioritize multi-country footprints. Their strategy relies on sovereign-cloud zones, AI-ready pods and renewable PPAs to differentiate against purely self-build hyperscaler sites. White-space opportunities persist in underserved Central African metros and secondary South African cities, enabling nimble entrants to capture first-mover premiums and further fragment the competitive order within the Africa hyperscale data center industry.
Africa Hyperscale Data Center Industry Leaders
Amazon Web Services
Microsoft Corporation
Digital Realty (Teraco)
Vantage Data Centers LLC
Africa Data Centres (Liquid Intelligent)
- *Disclaimer: Major Players sorted in no particular order

Recent Industry Developments
- March 2025: Cassava Technologies partnered with NVIDIA to build Africa’s first AI factory in South Africa with plans to extend to Egypt, Kenya, Morocco and Nigeria.
- January 2025: Vantage Data Centers secured USD 13 billion in funding throughout 2024, expanding global capacity to 2.6 GW.
- December 2024: Huawei launched a cloud region in Nigeria, widening local access to public cloud resources.
- November 2024: Teraco obtained an 8 billion rand (USD 442 million) loan to construct an AI-focused data center with liquid cooling.
- November 2024: ST Digital began building a data center in Côte d’Ivoire, reflecting surging West African demand.
- October 2024: Deep Atomic rolled out the MK60 small modular reactor tailored for data center campuses.


Research Methodology Framework and Report Scope
Market Definitions and Key Coverage
Our study defines the Africa hyperscale data center market as all single-tenant or multi-tenant facilities able to deliver at least 10 MW of critical IT load per building and designed to Tier III or Tier IV standards; both cloud self-build campuses and hyperscale-class colocation halls are captured. Capacity expansions announced but not yet energized are counted once physical construction is verified.
Scope exclusion: Smaller enterprise server rooms, edge micro sites below 5 MW, and legacy Tier II halls are outside the present scope.
Segmentation Overview
- By Data Center Type
- Hyperscale Self-build
- Hyperscale Colocation
- By Component
- IT Infrastructure
- Server Infrastructure
- Storage Infrastructure
- Network Infrastructure
- Electrical Infrastructure
- Power Distribution Unit
- Transfer Switches and Switchgears
- UPS Systems
- Generators
- Other Electrical Infrastructure
- Mechanical Infrastructure
- Cooling systems
- Racks
- Other Mechanical Infrastructure
- General Construction
- Core and Shell Development
- Installation and Commisioning Services
- Design Engineering
- Fire Detection, Suppression and Physical Security
- DCIM/BMS Solutions
- IT Infrastructure
- By Tier Standard
- Tier III
- Tier IV
- By End-User Industry
- Cloud and IT
- Telecom
- Media and Entertainment
- Government
- BFSI
- Manufacturing
- E-commerce
- Other End User
- By Data Center Size
- Large (Less than equal to 25 MW)
- Massive (Greater than 25 MW and less than equal to 60 MW)
- Mega (Greater than 60 MW)
- By Geography
- South Africa
- Nigeria
- Kenya
- Rest of Africa
Detailed Research Methodology and Data Validation
Primary Research
Multiple semi-structured interviews were conducted with facility design engineers, colocation sales directors, cloud capacity planners, power-utility executives, and submarine-cable operators across South Africa, Nigeria, and Kenya. These conversations validated live megawatt ramps, average rack densities, contract price bands, and planned go-live dates while also testing early model outputs for plausibility.
Desk Research
Mordor analysts first assembled a universe of site-level facts from open regulatory filings, national energy statistics, and spectrum or fiber maps issued by bodies such as the African Union, ITU, TeleGeography, the South African Department of Communications, and Kenya's CAK. These were complemented by customs import data on servers and switchgear, UN COMTRADE HS codes for cooling units, and project-by-project press releases retrieved through Dow Jones Factiva and D&B Hoovers. Trade association white papers, power-utility tariff books, and peer-reviewed papers on African PUE benchmarks rounded out evidence on cost drivers and utilization. The sources listed are illustrative; dozens more were referenced for corroboration and gap filling.
Market-Sizing & Forecasting
A blended top-down and bottom-up model was used. Top-down, we reconstructed demand pools from live and committed hyperscale megawatts, applying average service price per kilowatt and expected utilization ramps. Bottom-up cross-checks rolled up sampled supplier revenues and channel checks on server shipments. Key variables include: (1) installed IT load by city, (2) cloud IaaS spending growth, (3) international bandwidth landed, (4) mobile data traffic per capita, (5) average electricity tariffs, and (6) facility PUE trajectories. A multivariate regression links revenue to these drivers and projects through 2031, with scenario analysis around power-grid constraints. Gaps where site disclosures were silent were bridged using region-specific ASP-per-kilowatt ranges confirmed during interviews.
Data Validation & Update Cycle
Outputs undergo variance checks against independent power capacity tallies; anomaly flags are escalated to a second analyst, and senior review precedes sign-off. We refresh the dataset annually and issue interim updates when material events such as a >100 MW campus announcement occur. A fresh validation sweep is performed just before publication.
Why Mordor's Africa Hyperscale Data Center Baseline Commands Reliability
Published market estimates often diverge; figures vary with geographic cut-offs, whether construction CAPEX or recurring service revenue is counted, and how quickly unused white-space is monetized.
Key gap drivers include: some publishers merge Middle East and Africa, others tally total data-center investment rather than service revenue, and several fold in Tier II enterprise halls. Mordor reports a 2025 service-revenue baseline because decision-makers contract on those flows; we separate Africa from the Gulf, and we maintain annual refreshes versus multi-year cadences elsewhere.
Benchmark comparison
| Market Size | Anonymized source | Primary gap driver |
|---|---|---|
| USD 4.89 Bn (2025) | Mordor Intelligence | |
| USD 1.74 Bn (2023) | Global Consultancy A | Combines Middle East with Africa; omits self-build capacity upgrades |
| USD 3.49 Bn (2024) | Regional Consultancy B | Measures total DC investment, not recurring service revenue |
| USD 1.76 Bn (2023) | Industry Journal C | Includes Tier II and sub-5 MW sites; applies uniform ASP assumptions |
Taken together, the comparison shows that when scope, input variables, and refresh cadence are standardized, Mordor's disciplined approach yields a balanced, transparently traceable baseline that executives can readily reproduce and stress-test.


Key Questions Answered in the Report
What is the current value of the Africa hyperscale data center market?
The market is worth USD 4.89 billion in 2025.
How fast is the market growing?
Revenue is forecast to expand at a 20.55% CAGR to reach USD 15 billion by 2031.
Which region leads capacity deployment?
Southern Africa commands 33% of 2024 revenue and keeps an 11.20% CAGR through 2031.
Why are cooling systems the fastest-growing component?
AI workloads push rack densities beyond 40 kW, prompting a 20.70% CAGR in liquid-cooling spend.
What are the main obstacles to faster expansion?
Grid unreliability and a skilled-talent shortage in high-voltage operations each trim forecast CAGR by over 1.8%.
Page last updated on:


