South Africa Data Center Market Size and Share
Market Overview
| Study Period | 2020 - 2031 |
|---|---|
| Forecast Data Period | 2026 - 2031 |
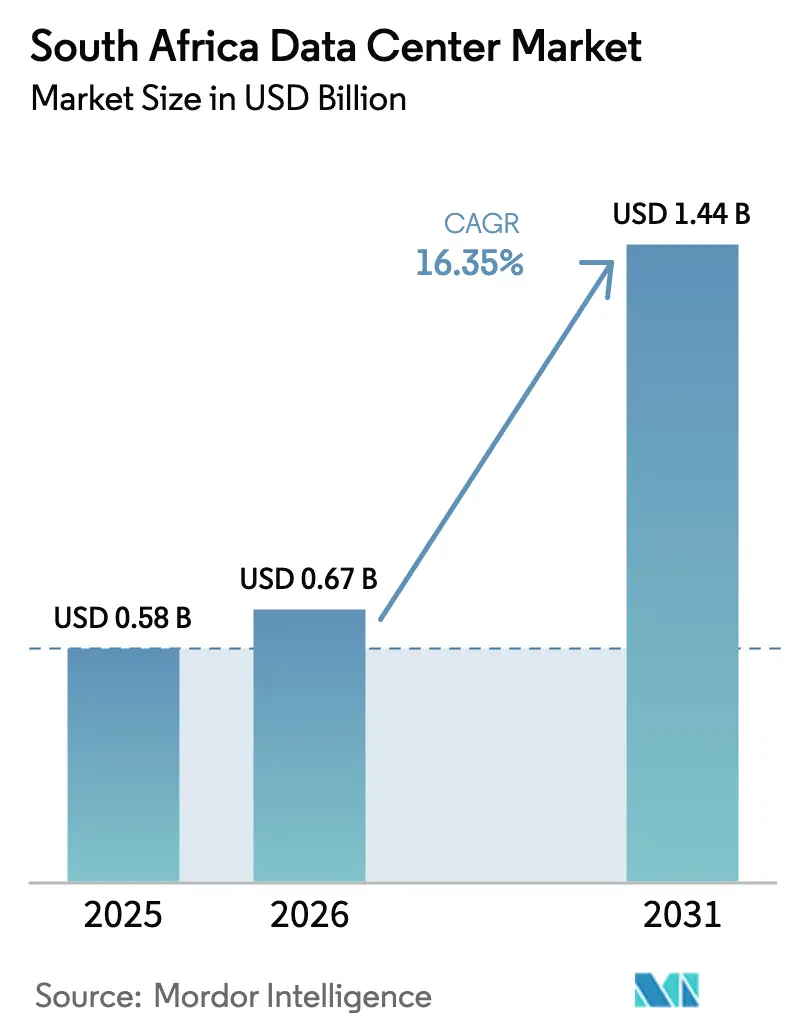
| Base Year Market Size (2025) | USD 0.58 Billion |
| Market Size (2026) | USD 0.67 Billion |
| Market Size (2031) | USD 1.44 Billion |
| Growth Rate (2026 - 2031) | 16.35% CAGR |
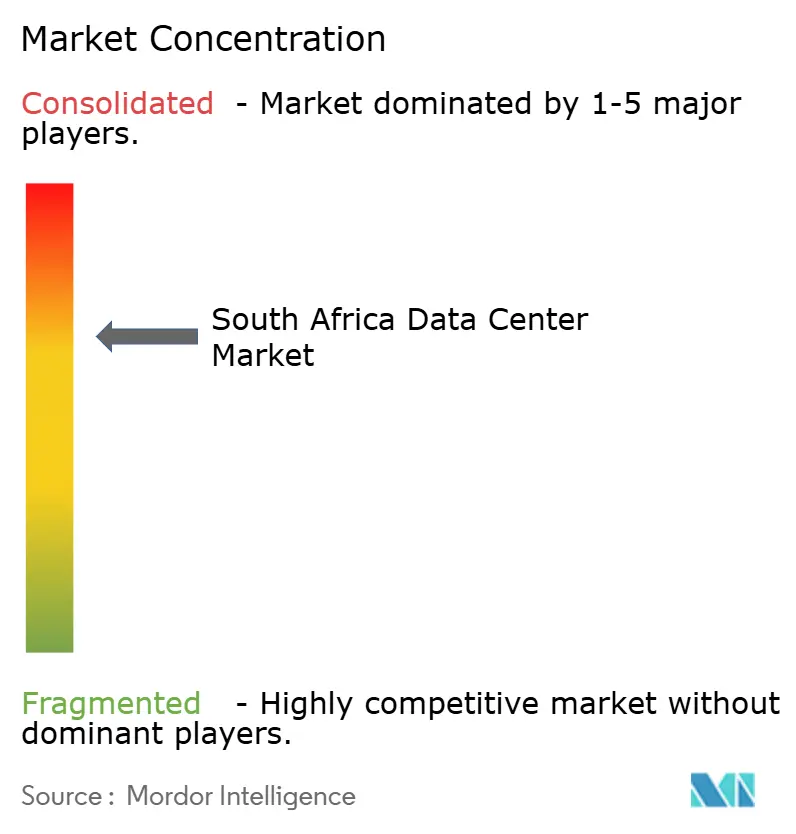
| Market Concentration | Medium |
Major Players *Disclaimer: Major Players sorted in no particular order Image © Mordor Intelligence. Reuse requires attribution under CC BY 4.0. | |
South Africa Data Center Market Analysis by Mordor Intelligence
South Africa Data Center Market size in 2026 is estimated at USD 0.67 billion, growing from 2025 value of USD 0.58 billion with 2031 projections showing USD 1.44 billion, growing at 16.35% CAGR over 2026-2031. In terms of installed base, the market is expected to grow from 5.54 thousand megawatt in 2025 to 7.81 thousand megawatt by 2030, at a CAGR of 7.11% during the forecast period (2025-2030). The market segment shares and estimates are calculated and reported in terms of MW. Rapid hyperscale cloud investment, new submarine cables, and data-sovereignty mandates are the primary drivers of growth. Johannesburg remains the core hub, though Cape Town and special economic zones attract new builds that balance capacity across the country. Operators are increasingly integrating onsite or wheeled renewable power and advanced cooling to address grid reliability concerns while meeting corporate carbon goals. Consolidation is accelerating as well-capitalized companies acquire or outbuild their rivals, raising competitive thresholds and supporting large-scale, high-efficiency facilities that can host AI and high-performance workloads.
Key Report Takeaways
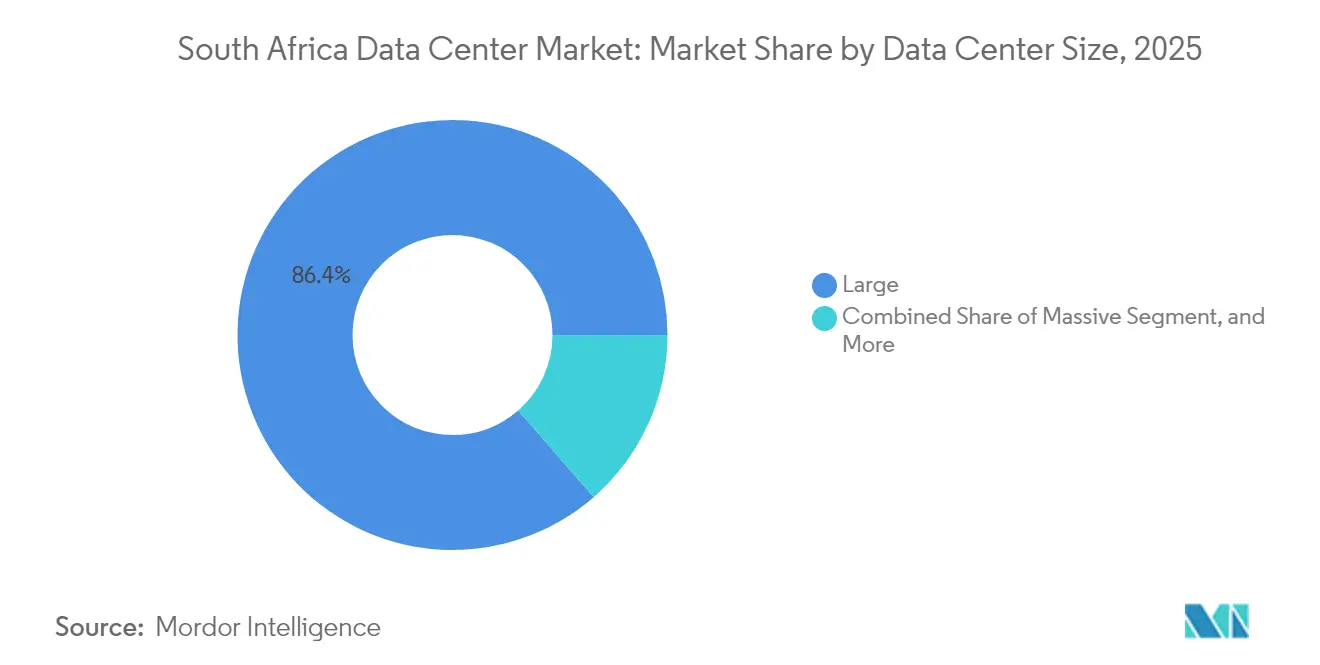
- By data center size, large facilities held 86.40% of the South Africa data center market share in 2025, while the same segment is projected to expand at an 7.64% CAGR through 2031.
- By tier type, Tier 3 captured a 89.05% revenue share in 2025; Tier 4 is forecasted to grow at a 7.08% CAGR to 2031.
- By data center type, hyperscale or self-built sites led growth with an 8.15% CAGR outlook to 2031.
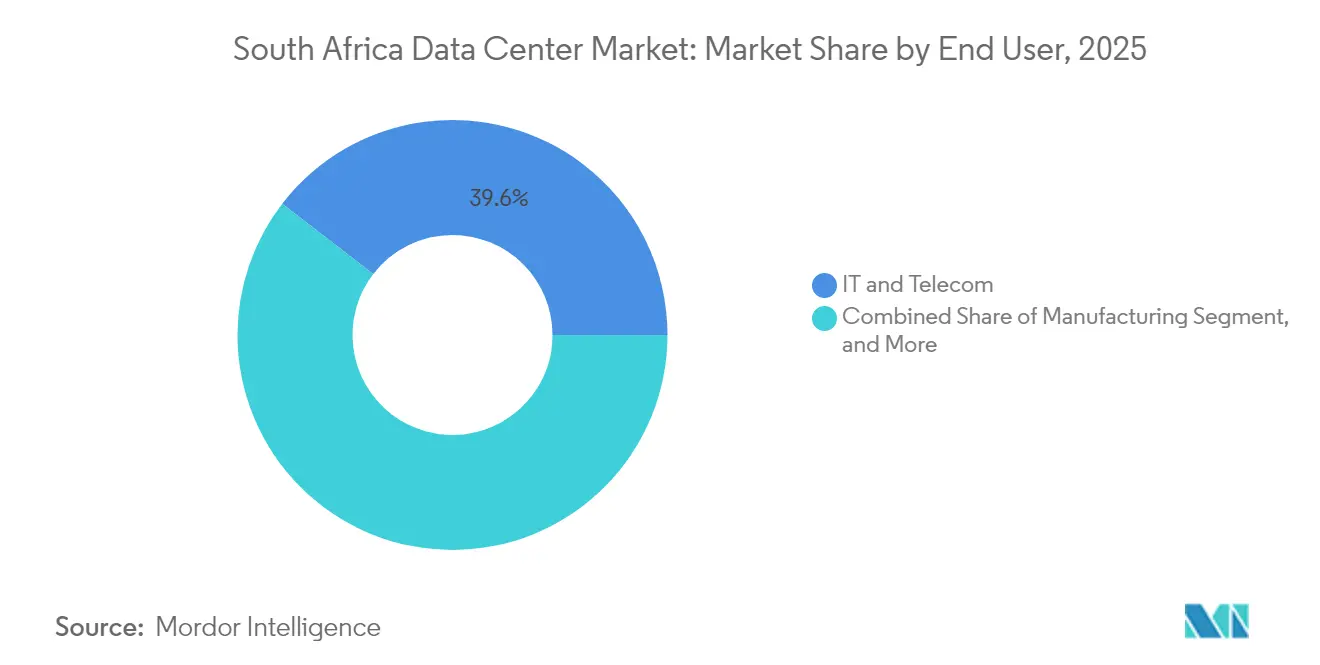
- By end user, IT and telecom accounted for 39.55% share of the South Africa data center market size in 2025; BFSI is advancing at a 7.02% CAGR through 2031.
- By hotspot, Johannesburg dominated capacity deployment in 2025, and the Rest of South Africa is estimated to post an 7.95% CAGR through 2031.
Note: Market size and forecast figures in this report are generated using Mordor Intelligence’s proprietary estimation framework, updated with the latest available data and insights as of 2026.
South Africa Data Center Market Trends and Insights
Drivers Impact Analysis*
| Driver | (~) % Impact on CAGR Forecast | Geographic Relevance | Impact Timeline |
|---|---|---|---|
| Growing cloud migration by local enterprises | +3.2% | National, led by Johannesburg and Cape Town | Medium term (2-4 years) |
| Accelerated submarine cable landings boosting bandwidth | +2.8% | Coastal regions with inland spillover | Long term (≥ 4 years) |
| Renewable energy commitments by hyperscale operators | +2.1% | National, Free State solar clusters | Long term (≥ 4 years) |
| Surge in AI and high-performance computing demand | +3.5% | Johannesburg and Cape Town | Medium term (2-4 years) |
| Data sovereignty mandates under POPIA | +1.9% | National | Short term (≤ 2 years) |
| Special economic zone tax incentives | +1.8% | SEZs: Coega, Dube Tradeport, Richards Bay | Long term (≥ 4 years) |
| Source: Mordor Intelligence | |||
Growing Cloud Migration by Local Enterprises
South African banks, retailers, and public agencies are accelerating cloud adoption after regulatory clarity on data residency. TymeBank migrated the bulk of its digital banking stack to AWS, reducing the time-to-market for new services. The May 2024 National Data and Cloud Policy requires 99.995% uptime for government workloads, thereby boosting demand for certified local facilities. Enterprises also seek hybrid architectures to hedge against currency-related cost swings for imported cloud services while keeping sensitive data within national borders.
Accelerated Submarine Cable Landings Boosting Bandwidth
The 45,000 km² Africa cable and Google’s Equiano system both became fully operational in 2024, providing 180 Tbps of additional capacity and lowering latency from South Africa to Europe and the Middle East. [1]WIOCC Group, “2Africa Cable System Operational,” wiocc.net Reliable international bandwidth encourages hyperscalers to launch local regions, underpinning edge caching and streaming platforms that require nearby compute nodes.
Renewable Energy Commitments by Hyperscale Operators
Teraco began constructing a 120 MW solar plant in the Free State in January 2025 to supply clean power to its nationwide campuses, marking the first utility-scale renewable asset owned by a data center operator. [2]Digital Realty, “Bridging Continents - The Role of Connectivity in Africa,” digitalrealty.com Coupled with Eskom’s wheeling framework, such projects enable operators to secure predictable power costs and meet the stringent carbon targets demanded by global cloud tenants.
Surge in AI and High-Performance Computing Demand
Enterprises deploying generative AI and analytics workloads require high-density racks exceeding 30 kW. Johannesburg campuses are expanding their liquid-cooling suites, while Microsoft has reserved additional capacity to support its March 2025 USD 300 million AI infrastructure program. [3]Microsoft South Africa, “Microsoft Announces Additional ZAR 5.4 Billion Investment,” microsoft.com
Restraints Impact Analysis*
| Restraint | (~) % Impact on CAGR Forecast | Geographic Relevance | Impact Timeline |
|---|---|---|---|
| Chronic grid instability and load shedding | -2.4% | National, acute in industrial zones | Short term (≤ 2 years) |
| Rising construction costs due to import tariffs | -2.1% | National | Short term (≤ 2 years) |
| Slow permitting for new grid connections | -1.8% | National | Medium term (2-4 years) |
| Limited skilled workforce for advanced operations | -1.6% | National | Long term (≥ 4 years) |
| Source: Mordor Intelligence | |||
Chronic Grid Instability and Load Shedding
Eskom improved its energy availability factor to 60% in 2024; however, operators remain exposed to unplanned outages that increase diesel and security costs. Mobile carriers collectively spent more than USD 295 million on backup systems since 2020, illustrating the broader infrastructure fragility that also burdens data center margins.
Rising Construction Costs Due to Import Tariffs
Electrical switchgear, precision cooling, and UPS systems are largely imported and priced in foreign currency. A weaker rand and tariff escalation inflate project budgets, forcing smaller developers to postpone builds or seek joint ventures with capital‐rich hyperscalers. Cost volatility compresses returns and sustains the trend toward large, multi-tenant campuses that can secure bulk procurement discounts, thereby enhancing their financial stability.
*Our forecasts treat driver/restraint impacts as directional, not additive. The impact forecasts reflect baseline growth, mix effects, and variable interactions.
Segment Analysis
By Data Center Size: Large Facilities Drive Market Consolidation
Large sites controlled 86.40% of the South Africa data center market share in 2025 and are on track for an 7.64% CAGR through 2031. This dominance reflects scale economics that offset high land, power, and security costs. Teraco’s JB7 project, financed through a ZAR 8 billion facility, will add 30 MW on a single campus. Medium facilities cater to mid-market enterprises that require dedicated suites but cannot justify hyperscale footprints. Small and edge sites, while still niche, gain relevance as 5G adoption grows and latency-sensitive services proliferate. The South Africa data center market size for large facilities will therefore expand faster than other categories, reinforcing consolidation among operators with access to capital.
Large-facility concentration also supports national connectivity goals. Inter-campus fiber routes, coupled with submarine cable landings, position Johannesburg and Cape Town sites as regional exchange points. Smaller regional builds frequently partner with big-campus operators for cloud on-ramp services. Combined, these tiers form an architecture in which large sites anchor capacity and smaller nodes distribute workloads closer to end users.


By Tier Type: Tier 3 Dominance Reflects Reliability Requirements
Tier 3 captured 89.05% of 2025 revenue because enterprises demand at least 99.982% uptime and concurrently maintainable systems. Government mandates further elevate minimum standards, pushing greenfield projects to design at Tier 3 or Tier 4. Hyperscalers are increasingly stipulating Tier 4 electrical topology for AI clusters, driving the segment’s 7.08% CAGR outlook. Meanwhile, Tier 1 and Tier 2 remain limited to edge or disaster recovery roles, where brief outages are tolerated.
In practice, Tier 3 facilities often over-engineer critical paths beyond baseline to mitigate grid instability. Operators add redundant transformers and reserve diesel storage exceeding 48 hours. This proactive investment yields premium pricing while securing long-term contracts from banks and global cloud tenants. The South Africa data center market size tied to Tier 3 therefore rises steadily, while Tier 4 uptake accelerates as mission-critical workloads migrate off legacy on-premises rooms.
By Data Center Type: Hyperscale Growth Outpaces Colocation
Self-built hyperscale campuses are projected to post an 8.15% CAGR to 2031 as AWS, Google, and Microsoft allocate additional zones. Colocation retains a crucial role for enterprise hybrid deployments and for cloud-neutral interconnection hubs such as Africa Data Centres’ 40 MW site in Johannesburg. Retail colocation meets the immediate needs of smaller footprints, while wholesale suites appeal to global SaaS firms entering the region. Although hyperscale ownership leads capacity additions, nearly 65% of current live cabinets remain in multi-tenant halls, underscoring a balanced ecosystem.
Operator strategies are converging: hyperscalers are pursuing renewable power and custom cooling, while colocation players are investing in high-density suites to remain relevant for AI tenants. The South African data center market size allocated to hyperscale builds is set to eclipse colocation beyond 2027 if present build pipelines stay on track; yet, carrier-neutral halls will continue to anchor peering and cloud on-ramp traffic.
By End User: IT and Telecom Leadership Faces BFSI Challenge
IT and telecom firms accounted for 39.55% of 2025 demand, benefiting from rapid mobile data growth and carrier rewiring of core networks into cloud-centric architectures. Banking, financial services, and insurance are projected to grow at the fastest rate, with a 7.02% CAGR, as they adopt real-time fraud analytics and digital onboarding. Stricter cyber-resilience rules effective June 2025 oblige financial institutions to host replicated nodes across at least two certified facilities.
E-commerce, government, and media segments collectively widen the revenue base. Amazon’s marketplace launch amplified expectations for same-day delivery and prompted retailers to migrate their analytics to local cloud regions. Public agencies, centralizing under SITA, procure modular colocation suites for sovereign data. Overall, diversified sector uptake steadies utilization rates and supports expansion beyond Johannesburg.
By Hotspot: Johannesburg Dominance Challenged by Regional Growth
Johannesburg retains the lion’s share of installed capacity, hosting Google Cloud’s first Africa region and the bulk of Teraco’s interconnected campuses. Abundant dark fiber, financial-services density, and existing 100 MW under construction keep the metro ahead. Cape Town follows, buoyed by submarine landings and a vibrant startup ecosystem. Permitting complexities slowed the development of one high-profile corporate campus, yet Microsoft’s established regional presence demonstrates viable scale.
Durban serves KwaZulu-Natal's logistics and manufacturing sectors with nascent but strategic developments that leverage port proximity. The rest of South Africa posts an 7.95% CAGR as operators leverage 15% corporate tax rates inside zones such as Coega and Richards Bay. These secondary markets benefit from cheaper land and closer access to renewable resources, promoting a more balanced national footprint within the South Africa data center market.
Competitive Landscape
Digital Realty’s 55% stake in Teraco gives the group operational control of roughly 75 MW, providing scale benefits in procurement and interconnection that smaller rivals cannot match. Africa Data Centres and Vantage continue to add capacity while focusing on differentiating themselves through carrier-neutral fabrics and fast deployment schedules. Hyperscalers adopt vertical integration: AWS committed ZAR 30.4 billion (USD 1.69 billion) across four years, and Google’s local region relies on a dedicated power and fiber envelope.
Mid-tier providers pursue joint ventures with tower companies and ISP consortia to address edge demand. Competitive factors now include renewable sourcing, AI-ready rack densities, and compliance certifications under the POPIA and ISO 27001 standards. Barriers to entry rise as clients favor operators with multiyear renewable power purchase agreements and established incident response teams. Consequently, the South Africa data center market trends toward moderate concentration, although room remains for niche players in secondary metros.
South Africa Data Center Industry Leaders
Teraco Data Environments Pty Ltd
Africa Data Centres (Liquid Intelligent Technologies)
Amazon Web Services South Africa Pty Ltd
Vantage Data Centers LLC
Alibaba Cloud Intelligence South Africa
- *Disclaimer: Major Players sorted in no particular order

Geography Analysis
Johannesburg’s campus cluster surpasses 75 MW of live power and secures more than 50% of new pre-leases, reflecting entrenched enterprise demand and hyperscale pre-commitments. High fiber density and direct connections to 2Africa and Equiano landing stations translate into sub-50 ms round-trip times to European gateways, reinforcing the city’s role as Africa’s data interchange.
Cape Town’s coastal advantage supports content delivery and disaster-recovery pairings with Johannesburg. Microsoft’s dual-region architecture leverages Cape Town for geo-redundancy, while renewable energy projects in the Northern Cape offer cost-effective power wheeling. Growth also stems from creative-media workflows and biotech analytics that favor the city’s talent pool.
Durban, though smaller, positions itself as a digital manufacturing and logistics hub, aligning with port modernization. Special economic zones across the Eastern and Western Cape, as well as the Free State, offer incentives and expedited permitting that attract emerging operators. Renewable projects, including Teraco’s solar farm, supply green energy across municipal grids, supporting rural edge nodes and spreading the reach of the South Africa data center market.
Recent Industry Developments
- May 2025: Microsoft announced an additional ZAR 5.4 billion (USD 300 million) investment to scale AI infrastructure in Johannesburg and Cape Town.
- January 2025: Digital Realty began constructing Teraco’s 120 MW solar photovoltaic plant in Free State, targeting commercial operation in late 2026.
- November 2024: Teraco unveiled the JB7 expansion backed by a ZAR 8 billion syndicated loan to add 30 MW on its Johannesburg campus.
- May 2024: The South African government released the National Data and Cloud Policy mandating domestic storage for national security data and 99.995% uptime for public workloads.


South Africa Data Center Market Report Scope
Johannesburg are covered as segments by Hotspot. Large, Massive, Medium, Small are covered as segments by Data Center Size. Tier 1 and 2, Tier 3, Tier 4 are covered as segments by Tier Type. Non-Utilized, Utilized are covered as segments by Absorption.| Large |
| Massive |
| Medium |
| Mega |
| Small |
| Tier 1 and 2 |
| Tier 3 |
| Tier 4 |
| Hyperscale or Self-built | ||
| Enterprise or Edge | ||
| Colocation | Non-Utilized | |
| Utilized | Retail Colocation | |
| Wholesale Colocation | ||
| BFSI |
| IT and ITES |
| E-Commerce |
| Government |
| Manufacturing |
| Media and Entertainment |
| Telecom |
| Other End Users |
| Johannesburg |
| Cape Town |
| Durban |
| Rest of South Africa |
| By Data Center Size | Large | ||
| Massive | |||
| Medium | |||
| Mega | |||
| Small | |||
| By Tier Type | Tier 1 and 2 | ||
| Tier 3 | |||
| Tier 4 | |||
| By Data Center Type | Hyperscale or Self-built | ||
| Enterprise or Edge | |||
| Colocation | Non-Utilized | ||
| Utilized | Retail Colocation | ||
| Wholesale Colocation | |||
| By End User | BFSI | ||
| IT and ITES | |||
| E-Commerce | |||
| Government | |||
| Manufacturing | |||
| Media and Entertainment | |||
| Telecom | |||
| Other End Users | |||
| By Hotspot | Johannesburg | ||
| Cape Town | |||
| Durban | |||
| Rest of South Africa | |||


Market Definition
- IT LOAD CAPACITY - The IT load capacity or installed capacity, refers to the amount of energy consumed by servers and network equipments placed in a rack installed. It is measured in megawatt (MW).
- ABSORPTION RATE - It denotes the extend to which the data center capacity has been leased out. For instance, a 100 MW DC has leased out 75 MW, then absorption rate would be 75%. It is also referred as utilization rate and leased-out capacity.
- RAISED FLOOR SPACE - It is an elevated space build over the floor. This gap between the original floor and the elevated floor is used to accommodate wiring, cooling, and other data center equipment. This arrangement assist in having proper wiring and cooling infrastructure. It is measured in square feet (ft^2).
- DATA CENTER SIZE - Data Center Size is segmented based on the raised floor space allocated to the data center facilities. Mega DC - # of Racks must be more than 9000 or RFS (raised floor space) must be more than 225001 Sq. ft; Massive DC - # of Racks must be in between 9000 and 3001 or RFS must be in between 225000 Sq. ft and 75001 Sq. ft; Large DC - # of Racks must be in between 3000 and 801 or RFS must be in between 75000 Sq. ft and 20001 Sq. ft; Medium DC # of Racks must be in between 800 and 201 or RFS must be in between 20000 Sq. ft and 5001 Sq. ft; Small DC - # of Racks must be less than 200 or RFS must be less than 5000 Sq. ft.
- TIER TYPE - According to Uptime Institute the data centers are classified into four tiers based on the proficiencies of redundant equipment of the data center infrastructure. In this segment the data center are segmented as Tier 1,Tier 2, Tier 3 and Tier 4.
- COLOCATION TYPE - The segment is segregated into 3 categories namely Retail, Wholesale and Hyperscale Colocation service. The categorization is done based on the amount of IT load leased out to potential customers. Retail colocation service has leased capacity less than 250 kW; Wholesale colocation services has leased capacity between 251 kW and 4 MW and Hyperscale colocation services has leased capacity more than 4 MW.
- END CONSUMERS - The Data Center Market operates on a B2B basis. BFSI, Government, Cloud Operators, Media and Entertainment, E-Commerce, Telecom and Manufacturing are the major end-consumers in the market studied. The scope only includes colocation service operators catering to the increasing digitalization of the end-user industries.
| Keyword | Definition |
|---|---|
| Rack Unit | Generally referred as U or RU, it is the unit of measurement for the server unit housed in the racks in the data center. 1U is equal to 1.75 inches. |
| Rack Density | It defines the amount of power consumed by the equipment and server housed in a rack. It is measured in kilowatt (kW). This factor plays a critical role in data center design and, cooling and power planning. |
| IT Load Capacity | The IT load capacity or installed capacity, refers to the amount of energy consumed by servers and network equipment placed in a rack installed. It is measured in megawatt (MW). |
| Absorption Rate | It denotes how much of the data center capacity has been leased out. For instance, if a 100 MW DC has leased out 75 MW, then the absorption rate would be 75%. It is also referred to as utilization rate and leased-out capacity. |
| Raised Floor Space | It is an elevated space built over the floor. This gap between the original floor and the elevated floor is used to accommodate wiring, cooling, and other data center equipment. This arrangement assists in having proper wiring and cooling infrastructure. It is measured in square feet/meter. |
| Computer Room Air Conditioner (CRAC) | It is a device used to monitor and maintain the temperature, air circulation, and humidity inside the server room in the data center. |
| Aisle | It is the open space between the rows of racks. This open space is critical for maintaining the optimal temperature (20-25 °C) in the server room. There are primarily two aisles inside the server room, a hot aisle and a cold aisle. |
| Cold Aisle | It is the aisle wherein the front of the rack faces the aisle. Here, chilled air is directed into the aisle so that it can enter the front of the racks and maintain the temperature. |
| Hot Aisle | It is the aisle where the back of the racks faces the aisle. Here, the heat dissipated from the equipment’s in the rack is directed to the outlet vent of the CRAC. |
| Critical Load | It includes the servers and other computer equipment whose uptime is critical for data center operation. |
| Power Usage Effectiveness (PUE) | It is a metric which defines the efficiency of a data center. It is calculated by: (𝑇𝑜𝑡𝑎𝑙 𝐷𝑎𝑡𝑎 𝐶𝑒𝑛𝑡𝑒𝑟 𝐸𝑛𝑒𝑟𝑔𝑦 𝐶𝑜𝑛𝑠𝑢𝑚𝑝𝑡𝑖𝑜𝑛)/(𝑇𝑜𝑡𝑎𝑙 𝐼𝑇 𝐸𝑞𝑢𝑖𝑝𝑚𝑒𝑛𝑡 𝐸𝑛𝑒𝑟𝑔𝑦 𝐶𝑜𝑛𝑠𝑢𝑚𝑝𝑡𝑖𝑜𝑛). Further, a data center with a PUE of 1.2-1.5 is considered highly efficient, whereas, a data center with a PUE >2 is considered highly inefficient. |
| Redundancy | It is defined as a system design wherein additional component (UPS, generators, CRAC) is added so that in case of power outage, equipment failure, the IT equipment should not be affected. |
| Uninterruptible Power Supply (UPS) | It is a device that is connected in series with the utility power supply, storing energy in batteries such that the supply from UPS is continuous to IT equipment even during utility power is snapped. The UPS primarily supports the IT equipment only. |
| Generators | Just like UPS, generators are placed in the data center to ensure an uninterrupted power supply, avoiding downtime. Data center facilities have diesel generators and commonly, 48-hour diesel is stored in the facility to prevent disruption. |
| N | It denotes the tools and equipment required for a data center to function at full load. Only "N" indicates that there is no backup to the equipment in the event of any failure. |
| N+1 | Referred to as 'Need plus one', it denotes the additional equipment setup available to avoid downtime in case of failure. A data center is considered N+1 when there is one additional unit for every 4 components. For instance, if a data center has 4 UPS systems, then for to achieve N+1, an additional UPS system would be required. |
| 2N | It refers to fully redundant design wherein two independent power distribution system is deployed. Therefore, in the event of a complete failure of one distribution system, the other system will still supply power to the data center. |
| In-Row Cooling | It is the cooling design system installed between racks in a row where it draws warm air from the hot aisle and supplies cool air to the cold aisle, thereby maintaining the temperature. |
| Tier 1 | Tier classification determines the preparedness of a data center facility to sustain data center operation. A data center is classified as Tier 1 data center when it has a non-redundant (N) power component (UPS, generators), cooling components, and power distribution system (from utility power grids). The Tier 1 data center has an uptime of 99.67% and an annual downtime of <28.8 hours. |
| Tier 2 | A data center is classified as Tier 2 data center when it has a redundant power and cooling components (N+1) and a single non-redundant distribution system. Redundant components include extra generators, UPS, chillers, heat rejection equipment, and fuel tanks. The Tier 2 data center has an uptime of 99.74% and an annual downtime of <22 hours. |
| Tier 3 | A data center having redundant power and cooling components and multiple power distribution systems is referred to as a Tier 3 data center. The facility is resistant to planned (facility maintenance) and unplanned (power outage, cooling failure) disruption. The Tier 3 data center has an uptime of 99.98% and an annual downtime of <1.6 hours. |
| Tier 4 | It is the most tolerant type of data center. A Tier 4 data center has multiple, independent redundant power and cooling components and multiple power distribution paths. All IT equipment are dual powered, making them fault tolerant in case of any disruption, thereby ensuring interrupted operation. The Tier 4 data center has an uptime of 99.74% and an annual downtime of <26.3 minutes. |
| Small Data Center | Data center that has floor space area of ≤ 5,000 Sq. ft or the number of racks that can be installed is ≤ 200 is classified as a small data center. |
| Medium Data Center | Data center which has floor space area between 5,001-20,000 Sq. ft, or the number of racks that can be installed is between 201-800, is classified as a medium data center. |
| Large Data Center | Data center which has floor space area between 20,001-75,000 Sq. ft, or the number of racks that can be installed is between 801-3,000, is classified as a large data center. |
| Massive Data Center | Data center which has floor space area between 75,001-225,000 Sq. ft, or the number of racks that can be installed is between 3001-9,000, is classified as a massive data center. |
| Mega Data Center | Data center that has a floor space area of ≥ 225,001 Sq. ft or the number of racks that can be installed is ≥ 9001 is classified as a mega data center. |
| Retail Colocation | It refers to those customers who have a capacity requirement of 250 kW or less. These services are majorly opted by small and medium enterprises (SMEs). |
| Wholesale Colocation | It refers to those customers who have a capacity requirement between 250 kW to 4 MW. These services are majorly opted by medium to large enterprises. |
| Hyperscale Colocation | It refers to those customers who have a capacity requirement greater than 4 MW. The hyperscale demand primarily originates from large-scale cloud players, IT companies, BFSI, and OTT players (like Netflix, Hulu, and HBO+). |
| Mobile Data Speed | It is the mobile internet speed a user experiences via their smartphones. This speed is primarily dependent on the carrier technology being used in the smartphone. The carrier technologies available in the market are 2G, 3G, 4G, and 5G, where 2G provides the slowest speed while 5G is the fastest. |
| Fiber Connectivity Network | It is a network of optical fiber cables deployed across the country, connecting rural and urban regions with high-speed internet connection. It is measured in kilometer (km). |
| Data Traffic per Smartphone | It is a measure of average data consumption by a smartphone user in a month. It is measured in gigabyte (GB). |
| Broadband Data Speed | It is the internet speed that is supplied over the fixed cable connection. Commonly, copper cable and optic fiber cable are used in both residential and commercial use. Here, optic cable fiber provides faster internet speed than copper cable. |
| Submarine Cable | A submarine cable is a fiber optic cable laid down at two or more landing points. Through this cable, communication and internet connectivity between countries across the globe is established. These cables can transmit 100-200 terabits per second (Tbps) from one point to another. |
| Carbon Footprint | It is the measure of carbon dioxide generated during the regular operation of a data center. Since, coal, and oil & gas are the primary source of power generation, consumption of this power contributes to carbon emissions. Data center operators are incorporating renewable energy sources to curb the carbon footprint emerging in their facilities. |


Research Methodology
Mordor Intelligence follows a four-step methodology in all our reports.
- Step-1: Identify Key Variables: In order to build a robust forecasting methodology, the variables and factors identified in Step-1 are tested against available historical market numbers. Through an iterative process, the variables required for market forecast are set and the model is built on the basis of these variables.
- Step-2: Build a Market Model: Market-size estimations for the forecast years are in nominal terms. Inflation is not a part of the pricing, and the average selling price (ASP) is kept constant throughout the forecast period for each country.
- Step-3: Validate and Finalize: In this important step, all market numbers, variables and analyst calls are validated through an extensive network of primary research experts from the market studied. The respondents are selected across levels and functions to generate a holistic picture of the market studied.
- Step-4: Research Outputs: Syndicated Reports, Custom Consulting Assignments, Databases & Subscription Platforms


