South America Hyperscale Data Center Market Size and Share
Market Overview
| Study Period | 2020 - 2031 |
|---|---|
| Forecast Data Period | 2026 - 2031 |
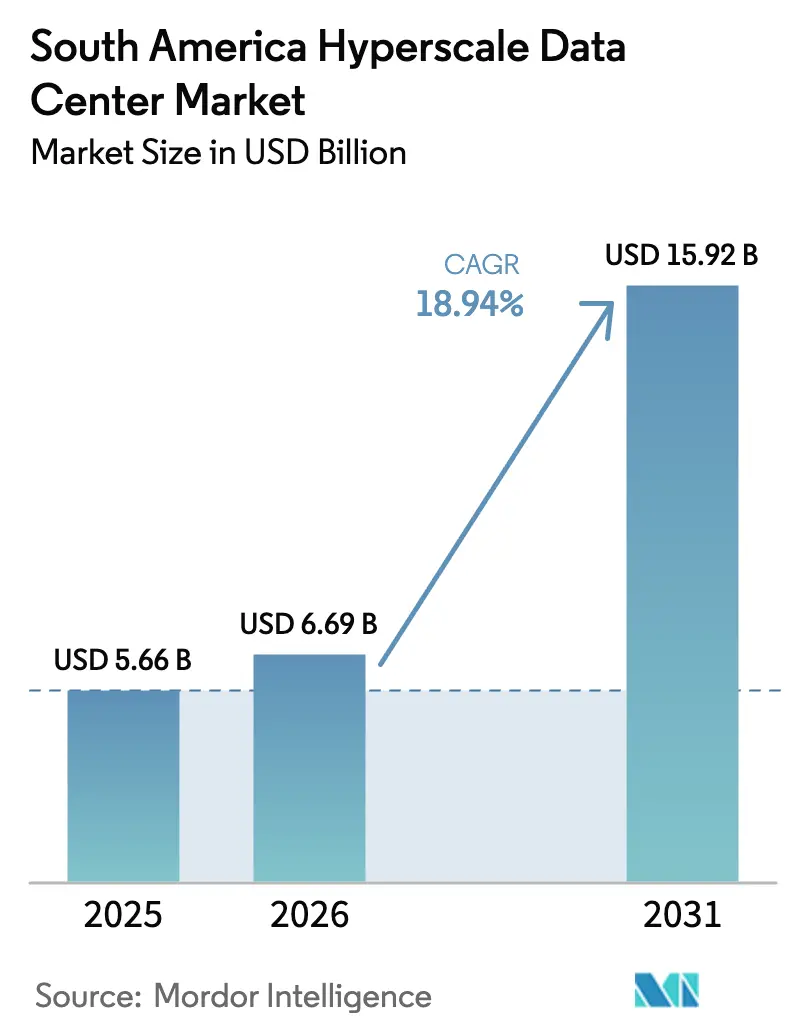
| Base Year Market Size (2025) | USD 5.66 Billion |
| Market Size (2026) | USD 6.69 Billion |
| Market Size (2031) | USD 15.92 Billion |
| Growth Rate (2026 - 2031) | 18.94% CAGR |
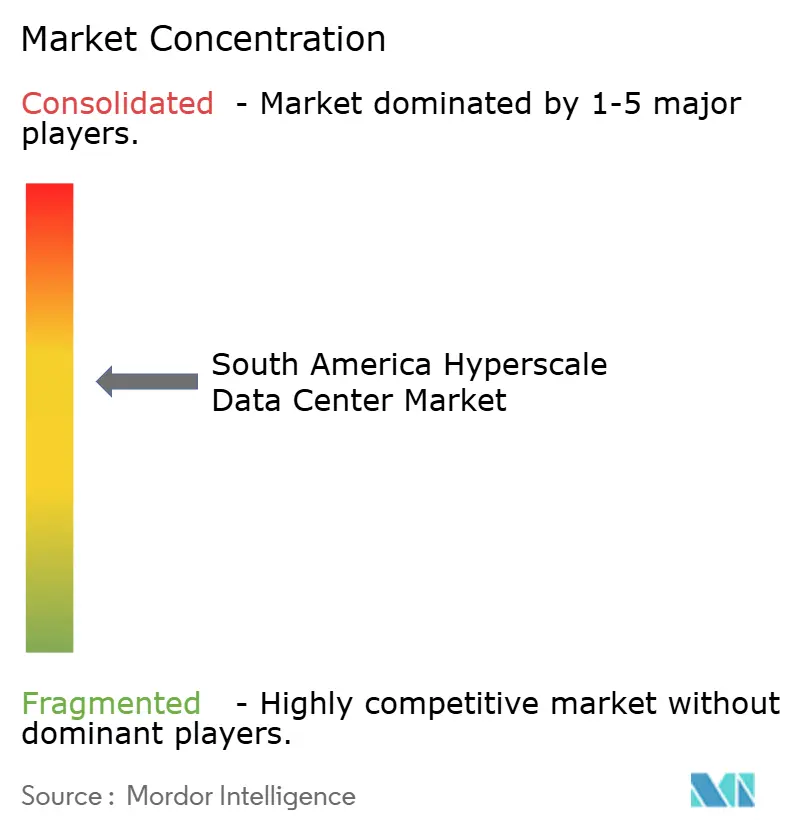
| Market Concentration | Medium |
Major Players *Disclaimer: Major Players sorted in no particular order Image © Mordor Intelligence. Reuse requires attribution under CC BY 4.0. | |
South America Hyperscale Data Center Market Analysis by Mordor Intelligence
The South America hyperscale data center market size is expected to increase from USD 5.66 billion in 2025 to USD 6.69 billion in 2026 and reach USD 15.92 billion by 2031, growing at a CAGR of 18.94% over 2026-2031. Rapid cloud-region roll-outs, new sub-sea cables, and abundant renewable-energy contracts combine to accelerate capital deployment across every major metro. Hyperscalers continue to build proprietary campuses, yet colocation providers are winning incremental megawatts by shortening time-to-production and diversifying grid exposure for clients that demand uninterrupted service. Data-sovereignty rules introduced in Brazil, Argentina, and Colombia require personal and public-sector data to remain on domestic soil, which effectively locks a rising share of workloads inside the South America hyperscale data center market. Simultaneously, GPU-rich artificial-intelligence clusters are lifting rack power densities beyond 30 kilowatts, forcing operators to invest aggressively in liquid-cooling and heat-exchanger retrofits that reshape mechanical-infrastructure budgets. Key drivers of revenue growth include hyperscaler self-build programs, cross-connect-centric business models inside carrier-neutral campuses, and renewable power purchase agreements that offer 12%-plus discounts relative to regulated tariffs. Challenges remain in the form of grid unreliability, a shortage of high-voltage technicians, and water-stress moratoria that restrict evaporative cooling in certain jurisdictions. Even so, mega campuses above 60 megawatts unlock operating leverage by centralizing substations, chilled-water plants, and fiber rings across a larger denominator of capacity. Competitive intensity sits at a moderate level because the top five providers account for about 62% of total installed megawatts, leaving meaningful headroom for regional specialists and edge-focused entrants to differentiate through local utility relationships, bilingual support teams, and next-generation liquid-cooling deployments.
Key Report Takeaways
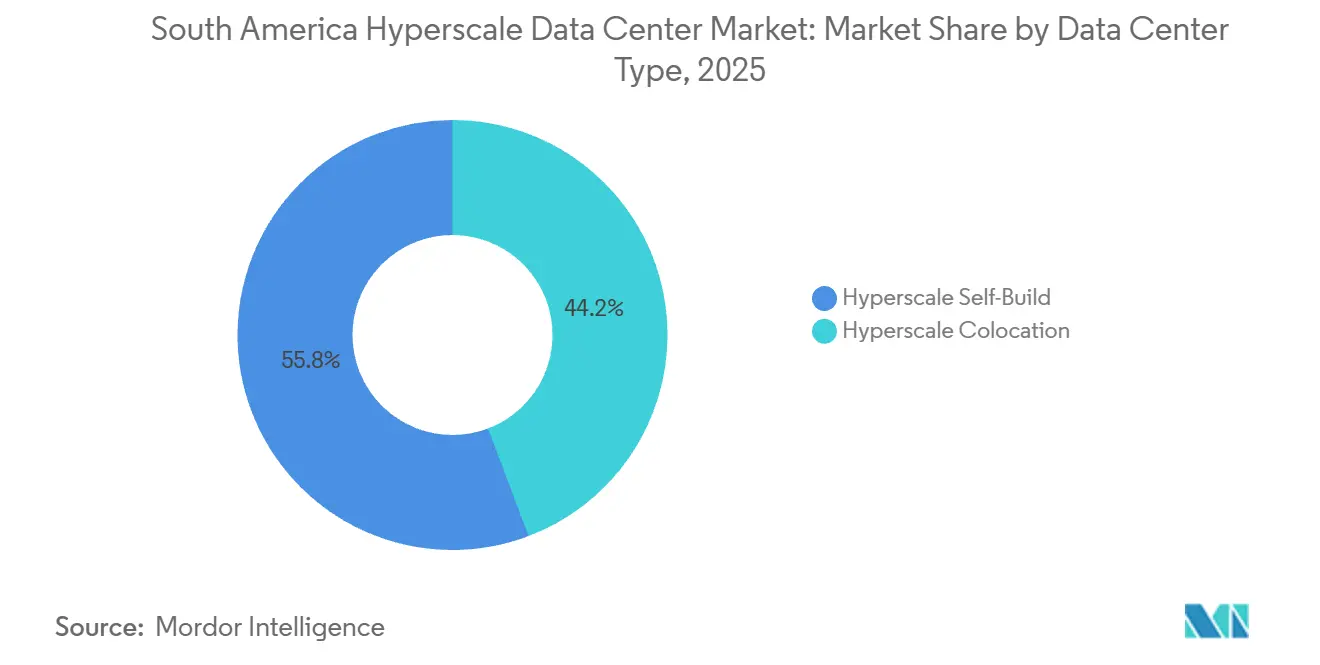
- By data center type, hyperscale self-build facilities held 55.76% of South America hyperscale data center market share in 2025, while colocation is projected to expand at a 19.54% CAGR to 2031.
- By component, IT infrastructure captured 42.18% of the South America hyperscale data center market in 2025, whereas mechanical infrastructure is forecast to rise at a 19.62% CAGR over 2026-2031.
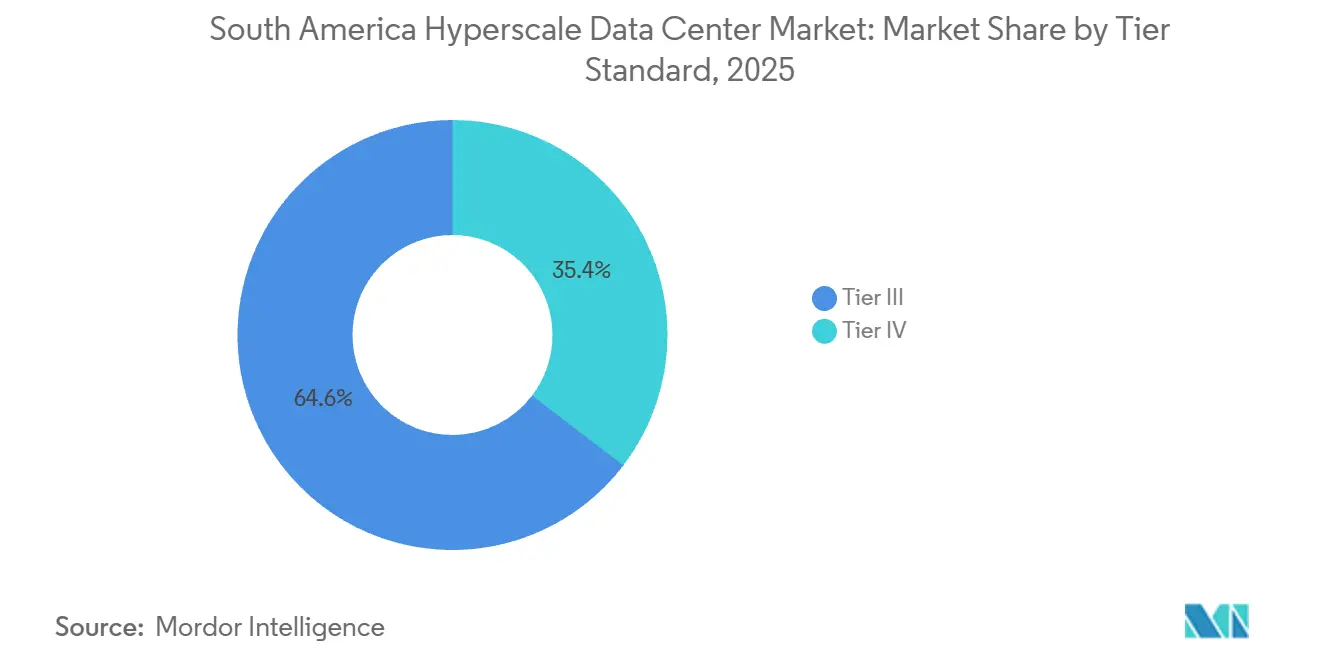
- By tier standard, tier III installations accounted for 64.63% of share in 2025, and tier IV facilities are poised to grow at a 19.88% CAGR during the forecast window.
- By data-center size, massive-scale campuses between 25 MW and 60 MW represented 45.42% of the South America hyperscale data center market in 2025, yet mega sites above 60 MW are tracking a 19.47% CAGR.
- By country, Brazil commanded 51.65% of share in 2025, whereas Chile is forecast to register the fastest 20.12% CAGR through 2031.
Note: Market size and forecast figures in this report are generated using Mordor Intelligence’s proprietary estimation framework, updated with the latest available data and insights as of January 2026.
The contribution of South america is incorporated into a multi-region total that reflects the full breadth of industry. The hyperscale data center market size by Mordor Intelligence expresses that combined magnitude.
South America Hyperscale Data Center Market Trends and Insights
Drivers Impact Analysis*
| Driver | (~) % Impact on CAGR Forecast | Geographic Relevance | Impact Timeline |
|---|---|---|---|
| Surge in Cloud-Region Launches by Hyperscalers | +4.2% | Brazil, Chile, with spillover to Colombia and Argentina | Medium term (2-4 years) |
| Sub-Sea Cable Landings Enhancing Latency and Redundancy | +3.8% | Chile (Valparaíso), Brazil (Fortaleza, Santos), with network effects across region | Long term (≥ 4 years) |
| Renewable PPAs Leveraging Abundant Hydro-Solar-Wind | +3.5% | Chile (Atacama solar, Patagonia wind), Brazil (hydro), Argentina (wind) | Medium term (2-4 years) |
| Digital-Sovereignty Laws Mandating Local Hosting | +3.1% | Brazil, Argentina, with emerging frameworks in Colombia and Peru | Short term (≤ 2 years) |
| 5G Open-RAN Roll-Outs Spawning Micro-Hyperscale Edge | +2.4% | Brazil (São Paulo, Rio), Chile (Santiago), Colombia (Bogotá) | Medium term (2-4 years) |
| Lithium-Mining AI and HPC Workloads Needing Local Capacity | +2.0% | Chile (Atacama), Argentina (Jujuy, Salta), Bolivia border regions | Long term (≥ 4 years) |
| Source: Mordor Intelligence | |||
Surge in Cloud-Region Launches by Hyperscalers
Aggressive cloud-region roll-outs anchor the strongest single catalyst for the South America hyperscale data center market. Amazon Web Services committed USD 4 billion to a Santiago cloud region that opens with 12 availability zones and an expandable 40-to-80-megawatt footprint, drawing software vendors that need single-digit-millisecond latency to operate payment engines and augmented-reality shopping carts.[1]Amazon Web Services, “AWS Announces Investment in Chile,” AWS.AMAZON.COM Microsoft mirrored the move with Azure zones in the same metro, while Google cut per-core pricing by 22% after enabling its M8g Arm-based instances in São Paulo. These flagship deployments trigger demand for adjacent colocation because independent software vendors must install application servers inside identical availability spheres to meet stringent service-level objectives. The loop closes when enterprises sign cross-connects to hyperscaler on-ramps, which in turn drives occupancy rates above 85% in São Paulo’s Vila Olímpia cluster and Santiago’s Quilicura corridor. Newly issued Brazilian regulations that classify sovereign workloads further lock in domestic hosting, ensuring the cloud-build momentum sustains through the medium term.[2]Brazilian National Data Protection Authority, “Lei Geral de Proteção de Dados,” GOV.BR
Sub-Sea Cable Landings Enhancing Latency and Redundancy
A second catalyst flows from trans-Pacific and north-south sub-sea fiber investments that drop latency and diversify fail-over paths. Google’s 14,800-kilometer Humboldt cable will reduce Santiago-Sydney round-trip delay by 30 milliseconds when it lands in Valparaíso during late 2026, enabling Chilean mining firms to run predictive-maintenance models on Australian analytics platforms with no perceptible lag. Cirion Technologies activated the 72-terabit-per-second SAC-2 link between Brazil and the United States in early 2025, cutting transit charges for content-delivery networks by 18%. Meta’s Project Waterworth diversified Brazilian routes in late 2024, reducing single-point-of-failure risk that previously plagued operators during anchor drag or seismic events. The new bandwidth lets cloud providers place larger cache nodes inside São Paulo and Santiago, serving consumers with sub-50-millisecond latency and stripping nearly 40% of peak-hour traffic from transcontinental trunks. Financial-services firms now gain dual-path network resilience that fulfils business-continuity mandates and nudges algorithmic-trading engines into regional halls.
Renewable PPAs Leveraging Abundant Hydro-Solar-Wind
Long-term renewable power purchase agreements constitute the third major driver because they stabilize energy costs, satisfy carbon pledges, and secure tax incentives. Atlas Renewable Energy signed a 1.2-terawatt-hour 24-hour carbon-free deal with ODATA in January 2025, locking tariffs 12% below Chile’s regulated residential price and insulating the Quilicura campus from fossil-fuel swings.[3]Atlas Renewable Energy, “Atlas Signs PPA with ODATA,” ATLASRENEWABLEENERGY.COM AES Andes followed by supplying 1,020 gigawatt-hours per year of wind and hydro energy to Google and Microsoft clouds, a move that underpins marketing claims of green compute and earns both operators Brazil’s ReData capex rebate. Although Brazil enjoys hydro surplus, droughts in 2024 forced diesel backup and revealed the value of hybrid storage integrations that many projects now bundle into plant design. Argentina’s Genneia is partnering with local developers to generate wind for hyperscale offtake in Patagonia, forecasting that AI training clusters will require an additional 500 megawatts of firm capacity by 2028. Collectively, these PPAs lift the sustainability profile of the South America hyperscale data center market, tilt total-cost-of-ownership models in favor of local deployment, and reinforce the region’s attractiveness to ESG-conscious tenants.
Digital-Sovereignty Laws Mandating Local Hosting
Domestic data-protection frameworks represent a fourth structural growth lever by compelling in-country hosting for regulated workloads. Brazil’s Lei Geral de Proteção de Dados assigns fines of up to 2% of global revenue when personal information crosses borders without adequate safeguards. Argentina and Colombia have adopted similar statutes that classify healthcare, finance, and biometric metadata as residency-bound. These laws fragment the regional architecture because SaaS vendors must spin up distinct clusters in every jurisdiction rather than backhauling user requests to North America. Global colocation chains with multi-country footprints, such as Equinix, monetize the compliance burden by offering turnkey sovereign-cloud cages under one contract. Brazil’s 2025 National Artificial Intelligence Plan goes further by requiring that public-sector AI datasets reside on certified national cloud, a niche estimated to absorb 80 megawatts of incremental capacity before decade-end.
Restraints Impact Analysis*
| Restraint | (~) % Impact on CAGR Forecast | Geographic Relevance | Impact Timeline |
|---|---|---|---|
| Grid Unreliability and High Electricity Tariffs | -2.8% | Brazil (São Paulo, Rio de Janeiro), Argentina (Buenos Aires) | Short term (≤ 2 years) |
| Skilled-Talent Shortage in HV Electrical and Mechanical O&M | -1.9% | Regional, with acute pressure in Chile and Colombia | Medium term (2-4 years) |
| Water-Stress Moratoria on Evaporative Cooling | -1.5% | Chile (Santiago metropolitan region), Brazil (São Paulo state) | Medium term (2-4 years) |
| GPU or Optic Allocation Bias Toward Tier-1 Regions | -1.2% | Regional, with secondary impact on AI workload migration | Long term (≥ 4 years) |
| Source: Mordor Intelligence | |||
Grid Unreliability and High Electricity Tariffs
Power instability and volatile tariffs remain the most acute short-term drag on the South America hyperscale data center market. Enel’s November 2024 outage in São Paulo left 2.1 million customers without electricity for up to 72 hours, invoking force-majeure clauses that allowed tenants to suspend colocation payments. Industrial tariffs in Argentina jumped 38% during the same year after subsidy reductions, squeezing operating margins for facilities lacking hedged contracts. Chile’s tariff regime is more stable, yet still commands a 9% premium over regional averages, prompting operators to negotiate interruptible-load deals that trade curtailment rights for 15% discounts. To maintain contractual uptime, a typical 20-megawatt hall in São Paulo now deploys 25 megawatts of on-site generation, which adds USD 3 million in up-front capex and USD 400,000 in recurring annual maintenance. The added expense deters latency-sensitive workloads such as real-time bidding engines, nudging those applications toward North American regions where five-nines uptime is standard.
Skilled-Talent Shortage in HV Electrical and Mechanical O&M
A regional deficit of high-voltage electricians, rotary UPS engineers, and chilled-water optimization specialists prolongs build cycles and elevates operational risk. LinkedIn Talent Insights shows that qualified data-center technicians earn wages 40-60% above local industry medians, pushing total cost of ownership beyond early feasibility models. Chile’s rapid expansion has intensified bidding wars because new campuses in Quilicura and Curauma came online faster than vocational institutes could train graduates. Brazil’s national industrial training service introduced a data-center curriculum in 2024, but its first cohort will not graduate until 2027, leaving a multi-year skills gap. Extended commissioning timelines now stretch to 24 months for a 10-megawatt hall, versus 15 months in North America, and under-trained staff raise the probability of misdiagnosed alarms that cascade into downtime penalties. Scarcity could erode the perceived cost advantage of the South America hyperscale data center industry unless accelerated certification programs and international talent pipelines materialize.
*Our forecasts treat driver/restraint impacts as directional, not additive. The impact forecasts reflect baseline growth, mix effects, and variable interactions.
Segment Analysis
By Data Center Type: Colocation Builds Momentum as Grid Risks Rise
Hyperscale colocation is forecast to expand at 19.54% during 2026-2031, surpassing the 18.94% pace set for self-build campuses, and this divergence underpins a structural shift inside the South America hyperscale data center market. Self-build designs captured 55.76% of 2025 spending because hyperscalers prefer vertical integration that lets them fine-tune cooling topologies for AI workloads. Even so, extended utility lead times and tariff shocks in Brazil and Argentina have persuaded cloud majors to hedge with leased hall blocks that can be activated within 90 days, sidestepping the 18-month greenfield timeline. Amazon Web Services exemplified this approach by reserving 5 megawatts within Equinix SP11 to backstop its São Paulo cloud region during maintenance windows, demonstrating that even capital-rich players value agility. Financial-services firms bolster colocation growth because Banco Central do Brasil’s operational-resilience rules stipulate geographic separation between primary and disaster-recovery footprints, a requirement most economically met through multi-campus leasing rather than proprietary duplication.
Interconnection density amplifies colocation’s edge by clustering tenant servers near multiple cloud on-ramps, internet exchanges, and carrier meet-me rooms. Scala Data Centers reported that 42% of 2025 revenue originated from cross-connects and peering services rather than pure rack rental, reflecting how network effects create sticky occupancy and premium yields. By contrast, self-build estates often select ex-urban land parcels where real-estate costs are 30% lower but fiber routes limited, which can constrain latency-sensitive AI inference pipelines that require multi-cloud federation. As workloads evolve toward federated learning models demanding simultaneous access to multiple public clouds, the interconnection premium inside carrier-neutral campuses will likely sustain colocation’s above-market growth. Consequently, the South America hyperscale data center market appears to be tilting toward a hybrid procurement mix in which even hyperscalers blend owned and leased capacity to balance capex discipline with speed-to-capacity.


By Component: Mechanical Spend Accelerates on AI-Induced Thermal Loads
IT hardware retained the largest 42.18% share of 2025 expenditure, yet mechanical systems are positioned for the fastest 19.62% CAGR because power density continues its structural climb. GPU arrays such as NVIDIA H100 already drive cabinet loads beyond 30 kilowatts, and direct-to-chip cold plates or rear-door heat exchangers capable of 45 kilowatts per rack are now mandatory for retrofit projects. Electrical outlays rise at 18.7% because a 20-megawatt hall needs a 25-megawatt utility connection to guarantee N+1 redundancy, which requires substation upgrades that easily exceed USD 2 million. General construction lags at 18.3% because operators increasingly lease pre-built shells from industrial landlords, deploying modular white-space kits rather than breaking raw ground. Schneider Electric’s latest predictive-analytics layer synchronizes chiller sequencing with AI workload surges, trimming energy waste by 12%, while Arista’s 800-gigabit Ethernet spine-leaf fabrics handle east-west traffic bursts that accompany model training cycles.
Rising rack heights to 52U and even 60U further shift mechanical bills because taller frames require engineered bracing, expanded cable management, and heavier-duty airflow doors. Network upgrades form an allied theme as hyperscalers adopt 400-gigabit and 800-gigabit optics to link training nodes, which triples fiber count per rack and necessitates higher static-pressure cooling fans. Storage architecture transformation toward NVMe-over-Fabrics has centralized flash pools, reducing per-terabyte cost by 18%, yet the heavier east-west network load places added stress on cooling loops. Mechanical suppliers gain pricing power as lead times for heat-exchanger cores stretch to 16 weeks, particularly when global AI demand funnels limited copper and aluminum inventory into Tier-1 regions first. The overall result is a mechanical-spend growth curve that now exceeds server refresh trajectories, a reversal of historic patterns inside the South America hyperscale data center market.
By Tier Standard: Financial Regulation Catalyzes Tier IV Uptake
Tier III maintained a dominant 64.63% share of installed megawatts in 2025 because the design balances uptime with an 8-12% capital premium over Tier II, yet financial-services rules are catalyzing faster Tier IV adoption. Banco Central do Brasil mandated dual-utility feeds and 2N power redundancy for systemically important payment processors, effectively elevating Tier IV from optional to compulsory for mission-critical banking infrastructure. Chile’s securities regulator echoes these requirements, pressuring local colocation landlords to upgrade power trains and fire compartments to Tier IV equivalency before contracts renew. As a result, Tier IV capacity is projected to expand at 19.88% over 2026-2031, edging ahead of the broader South America hyperscale data center market growth rate. Operators such as ODATA have already scheduled six-megawatt retrofits in Quilicura that add secondary transformers and N+1 gensets, targeting banking tenants willing to pay a 20% rate premium for fault-tolerant white space.
While regulated verticals relish the added resiliency, SaaS platforms, content-delivery networks, and e-commerce back ends usually tolerate short maintenance windows, rendering the 15-20% capex surcharge for Tier IV unjustified. Therefore, Tier III will continue to dominate aggregate megawatts, yet the incremental capacity delta is skewed toward Tier IV, narrowing the certification gap with North America where Tier IV already represents 18% of halls. Retrofit economics favor partial hall upgrades instead of full complex conversions, a trend made feasible by modular electrical rooms and containerized switchgear that install without lengthy shutdowns. The emerging dual-standard landscape lets landlords segment price tiers, monetize higher-margin halls, and satisfy regulators without alienating cost-conscious tenants, preserving flexibility inside the South America hyperscale data center market.
By Data Center Size: Mega Campuses Unlock Economies of Scale
Mega campuses above 60 megawatts are on track for a 19.47% CAGR because they amortize fixed infrastructure across a larger power denominator. Amazon Web Services selected a 40-megawatt starting footprint in Chile that can double without fresh permitting, allowing substation, chiller plant, and fiber-ring costs to spread across eventual 80-megawatt capacity. Centralized chilled-water plants inside such complexes reach coefficients of performance 18% higher than distributed units, which translates into a 2.1-megawatt energy-draw saving each year and improves carbon intensity metrics. Staffing efficiencies arise too, because a 60-megawatt campus requires 35 full-time engineers, yielding a per-megawatt labor cost 22% below that of three separate 20-megawatt sites. However, concentration risk compels insurers to insist on seismic base isolators and compartmentalized fire zones, adding USD 8 million to build budgets as a hedge against catastrophic outages.
Massive-scale campuses ranging from 25 megawatts to 60 megawatts retained a 45.42% share in 2025 because phased construction in 10-megawatt blocks aligns capital with tenant absorption and avoids stranded capacity. Operators addressing regional enterprises and government agencies continue to deploy smaller 10-to-25-megawatt halls, growing at 18.6% yet ceding share to mega designs that better suit AI training clusters demanding contiguous floorspace. Chile’s Atacama Desert real estate supports mega footprints thanks to low seismic drag coefficients and abundant solar generation, while Brazil’s land constraints inside São Paulo drive developers toward vertical multi-story stacks to achieve equivalent power density. Permitting agencies increasingly favor master-planned technology parks that pre-approve utility and water draw, facilitating rapid scale-out for both massive and mega categories. The convergent outcome reinforces the upward drift in average hall size within the South America hyperscale data center market.
Geography Analysis
Brazil held 51.65% of South America hyperscale data center market revenue in 2025, anchored by São Paulo’s 1,200-megawatt installed base, twelve carrier-neutral meet-me rooms, and dense fintech, e-commerce, and cloud-native ecosystems. Lei Geral de Proteção de Dados obliges multinational SaaS providers to lease racks inside ANATEL-licensed halls, generating a captive market segment that could absorb 80 megawatts of incremental capacity by 2029. Yet prolonged grid instability, highlighted by the 72-hour Enel outage, forces operators to over-provision diesel generators at USD 150 per kilowatt of capex, dampening ROI and steering new builds toward hydro-rich states such as Paraná and Minas Gerais. Brazil’s ReData incentive counterbalances by rebating 15% of capex when facilities source 80% of energy from renewables, nudging developers toward hybrid hydro-plus-solar blends. Equinix’s 8-megawatt SP11 expansion in 2024 underscores continued appetite for São Paulo interconnection, but rising land and energy costs push some hyperscalers to evaluate secondary metros like Campinas and Curitiba.
Chile is forecast to expand at a 20.12% CAGR through 2031, propelled by AWS, Microsoft, and Google investments and renewable capacity that supplied 68% of national grid output in 2024. Atlas Renewable Energy’s contract at tariffs 12% below residential rates helps operators market carbon-neutral compute, appealing to ESG-minded tenants. Humberto cable’s arrival will position Valparaíso as a latency hub between South America and Asia-Pacific, attracting analytic workloads from mining and agritech sectors that rely on real-time sensor data. Nevertheless, water-stress moratoria in Santiago restrict evaporative cooling, forcing a shift toward adiabatic or closed-loop glycol systems that add 8-12% to operating costs but remain economically viable due to cheaper power. Seismic engineering codes, although stringent, provide investor confidence that megawatt footprints can withstand magnitude-8 events, eliminating a historical barrier to foreign capital.
Colombia charts a 19.3% growth path as Bogotá emerges as a near-shore contact-center and BPO hub aligned with U.S. Eastern Time. The government’s fifteen-year tax holiday on data-center real estate, enacted in 2024, slashes effective capex and lures global colocation chains, while the 3.5-gigahertz 5G spectrum auction seeds micro-hyperscale edge nodes that preprocess IoT telemetry before backhauling filtered payloads. Argentina, despite an 18.1% CAGR, faces import-duty complexity and peso volatility that inflate server costs, yet Cirion’s USD 50 million Buenos Aires campus aims to capture workloads that must remain onshore after the 2023 debt restructuring. Peru and a handful of smaller South America nations collectively grow at 18.5%, benefiting from mining-sector demand for edge compute in Arequipa and Trujillo, although fiber backhaul scarcity tempers scalable rollout. Overall, the South America hyperscale data center market remains geographically concentrated in Brazil and Chile, yet policy incentives and fiber extensions are lifting the competitiveness of Andean economies.
Mordor Intelligence provides coverage of the hyperscale data center market across other key regional markets, including North America, Middle East, and Africa, each with their regulatory frameworks and demand patterns. Detailed country-level analysis extends to Brazil, Argentina, Chile, United States, Canada, and Saudi Arabia incorporating local coverage and market participation, as required.
Competitive Landscape
The South America hyperscale data center market exhibits moderate fragmentation, with AWS, Microsoft, Equinix, Digital Realty’s Ascenty subsidiary, and Scala Data Centers jointly controlling roughly 62% of installed megawatts. Hyperscalers emphasize proprietary campuses to optimize power-usage effectiveness and cooling for AI clusters, highlighted by AWS’s multi-phase Chile programme that reserves adjacent parcels for 80-megawatt scale-out. Colocation leaders differentiate through dense interconnection fabrics, carrier neutrality, and cross-border compliance frameworks, enabling enterprises to fulfill Brazil and Argentina data-residency mandates with one master service agreement. Scala’s revenue mix tilts heavily toward cross-connect fees, proving that network gravity rather than square-footage alone drives margin. ODATA, Cirion, and EdgeConneX leverage localized utility relationships, bilingual support, and modular construction to penetrate secondary metros where hyperscalers hesitate due to limited fiber routes.
Technology continues to act as a wedge in competitive positioning. Vertiv’s modular rear-door heat exchangers, certified for 45-kilowatt racks, let operators retrofit legacy halls without lengthy shutdowns, trimming payback periods from seven years to four. IEEE’s ratification of 800-gigabit Ethernet standards allowed Arista to ship switches that reduce per-gigabit carriage costs by 35%, a saving colocation landlords partially pass to tenants while protecting gross margin. Renewable sourcing grows more strategic because ReData and similar incentives directly improve capex economics; Scala’s wind-power deal covering 150 megawatts of São Paulo capacity positions the firm for a 90% green-energy mix by 2027. Competitive pressure is intensifying around liquid-cooling integration skills, as operators able to certify technicians quickly secure AI cluster contracts that laggard rivals cannot accommodate. Despite convergence in design philosophies, geographic dispersion of renewable resources and sovereignty statutes implies sustained multipolar competition rather than a winner-takes-all scenario.
Edge opportunities in Medellín, Montevideo, and Quito remain under-exploited due to limited carrier backhaul, offering a window for disruptors with containerized pod solutions. Partnerships with telecom carriers deploying standalone 5G elevate edge market attractiveness because ultra-low-latency applications promise premium rack yields despite smaller load factors. Mergers and acquisitions are plausible once regulatory authorities harmonize cross-border data policies, yet current political heterogeneity supports independent regional champions. Over the medium term, the South America hyperscale data center industry could see alliances centered on renewable-energy procurement, joint fiber development, and shared talent academies that tackle the skills shortage collectively. Until then, pricing discipline rests on the ability of each provider to balance rapid capacity delivery against the financial risk of overbuilding in volatile currency regimes.
South America Hyperscale Data Center Industry Leaders
Amazon Web Services
Microsoft Corporation
Google LLC
Meta Platforms Inc.
Equinix Inc.
- *Disclaimer: Major Players sorted in no particular order

Recent Industry Developments
- January 2026: Google’s Humboldt sub-sea cable entered final construction, with Valparaíso landing slated for Q4 2026, trimming Santiago-Sydney latency by 30 milliseconds and unlocking real-time analytics for mining workloads.
- May 2025: Amazon Web Services announced a USD 4 billion Chilean cloud region featuring 12 availability zones and an initial 40-megawatt capacity expandable to 80 megawatts by 2028.
- March 2025: Microsoft launched Azure availability zones in Santiago, bringing single-digit-millisecond latency to enterprises throughout central Chile.
- January 2025: Atlas Renewable Energy signed a 1.2-terawatt-hour 24-hour carbon-free PPA with ODATA for the Quilicura campus at tariffs 12% below Chile’s regulated residential rate.


Research Methodology Framework and Report Scope
Market Definitions and Key Coverage
Our study defines the South American hyperscale data center market as the revenue generated from newly built or fully leased facilities engineered to deliver at least 5 MW of IT load per hall and capable of accommodating thousands of servers through highly automated, modular power and cooling blocks. Capacity owned outright by the cloud majors, purpose-built colocation halls commissioned for hyperscale tenants, and in-region self-build expansion phases are all counted in value terms.
Scope exclusion: Enterprise, edge, and traditional multitenant data centers below 4 MW of contiguous power are outside the modeling frame.
Segmentation Overview
- By Data Center Type
- Hyperscale Self-Build
- Hyperscale Colocation
- By Component
- IT Infrastructure
- Server Infrastructure
- Storage Infrastructure
- Network Infrastructure
- Electrical Infrastructure
- Power Distribution Units
- Transfer Switches and Switchgears
- UPS Systems
- Generators
- Other Electrical Infrastructure
- Mechanical Infrastructure
- Cooling Systems
- Racks
- Other Mechanical Infrastructure
- General Construction
- Core and Shell Development
- Installation and Commissioning Services
- Design Engineering
- Fire Detection, Suppression and Physical Security
- DCIM/BMS Solutions
- IT Infrastructure
- By Tier Standard
- Tier III
- Tier IV
- By Data Center Size
- Large ( Less than or equal to 25 MW)
- Massive (Greater than 25 MW and Less than equal to 60 MW)
- Mega (Greater than 60 MW)
- By Country
- Brazil
- Chile
- Colombia
- Argentina
- Peru
- Rest of South America
Detailed Research Methodology and Data Validation
Primary Research
Mordor analysts conduct semi-structured interviews with facility design engineers, regional cloud procurement leads, electrical OEM sales managers, and colocation leasing brokers across Brazil, Chile, and Colombia. These discussions confirm land-bank pipelines, typical rack densities, lease rate trajectories, and commissioning timetables that secondary data alone cannot reveal.
Desk Research
We begin by mapping the installed and planned hyperscale footprint country-wise using public notifications from energy regulators, environmental licensing portals, and land-use registries such as ANEEL (Brazil) and SEREMI (Chile). Complementary insights are mined from trade associations like ABRANET, customs shipment logs for high-density IT gear, and patent abstracts on immersion cooling. Company filings, investor decks, and reputable business media help our analysts benchmark unit capex and average selling prices. D&B Hoovers and Dow Jones Factiva databases enrich firm-level financial inputs. This collection is indicative, not exhaustive; many additional open datasets support validation.
Market-Sizing & Forecasting
A hybrid top-down build begins with national electricity consumption and fiber landing station statistics, which are reconciled with hyperscale penetration rates to size the total compute demand pool. Select bottom-up checks, sampled self-build campus capacities, disclosed MW under management by leading colocation operators, and average price per kW leases calibrate totals. Key variables include rack power density migration, cloud region launches, submarine cable additions, real estate cost inflation, energy mix shifts, and AI server adoption ratios. Multivariate regression, validated by expert consensus, projects the impact of these drivers on revenue through 2031, while scenario analysis adjusts for power grid constraints and currency swings. Gap areas in bottom-up estimates are bridged by sensitivity ranges rooted in comparable campus benchmarks.
Data Validation & Update Cycle
Outputs pass a two-step analyst review that flags variances above predefined thresholds versus historical energy demand, CBRE vacancy indices, and import duty receipts. Annual refreshes incorporate fresh capacity announcements; material events such as a mega campus groundbreaking trigger interim updates before report delivery.
Why Mordor's South America Hyperscale Data Center Baseline Deserve Confidence
Published values often diverge because providers mix Latin-wide totals with country slices, apply different minimum MW cut-offs, or roll forward past forecasts without verifying new build delays.
Key gap drivers include scope (some trackers fold enterprise halls into totals), inconsistent ASP progression, and less frequent refresh cadences that miss mid-year campus postponements. Our study reports a 2025 market value of USD 5.66 billion for South America hyperscale centers.
Benchmark comparison
| Market Size | Anonymized source | Primary gap driver |
|---|---|---|
| USD 5.66 bn (2025) | Mordor Intelligence | - |
| USD 1.14 bn (2024) | Global Consultancy A | Latin America scope only, counts hardware revenue but omits lease income |
| USD 4.89 bn (2023) | Industry Association B | Blends Tier III enterprise builds, uses older currency rates, update cycle biennial |
The comparison shows how definition breadth, refresh timing, and revenue type inclusion explain headline gaps. By anchoring figures to verifiable MW pipelines and regularly revisiting assumptions, Mordor Intelligence delivers a balanced, decision-ready baseline.


Key Questions Answered in the Report
How large is the South America hyperscale data center market in 2026?
The market stands at USD 6.69 billion in 2026 and is projected to climb to USD 15.92 billion by 2031.
What is the compound annual growth rate expected through 2031?
The market is forecast to register an 18.94% CAGR from 2026 to 2031, driven by cloud-region launches, sub-sea cables, and renewable-energy PPAs.
Which country currently generates the highest revenue?
Brazil leads with 51.65% of 2025 revenue due to São Paulo’s dense carrier and enterprise ecosystem.
Why is mechanical infrastructure spending rising faster than server spending?
GPU-rich AI racks exceed 30 kilowatts per cabinet, compelling operators to install liquid-cooling systems that drive a 19.62% CAGR in mechanical outlays.
How do data-sovereignty laws influence deployment strategy?
Brazil, Argentina, and Colombia mandate local hosting for regulated data, forcing cloud and SaaS vendors to deploy sovereign clusters inside each jurisdiction.
Page last updated on:


