India Hyperscale Data Center Market Size and Share
Market Overview
| Study Period | 2019 - 2031 |
|---|---|
| Forecast Data Period | 2025 - 2031 |
| Historical Data Period | 2019 - 2023 |
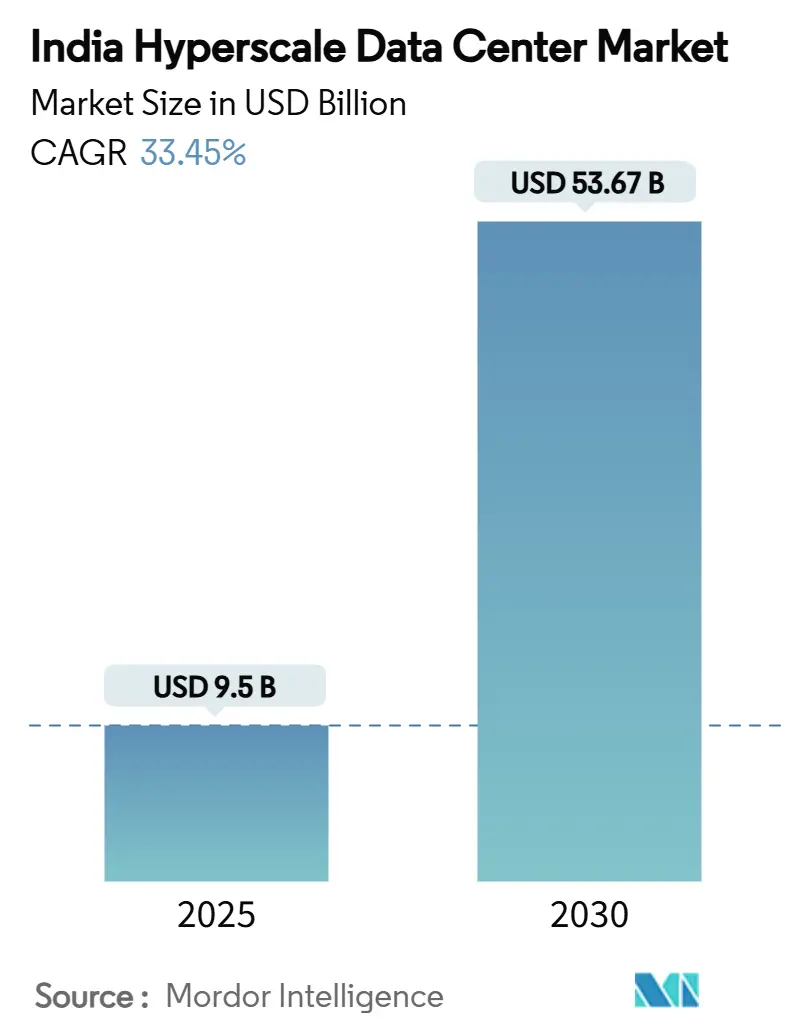
| Market Size (2025) | USD 9.5 Billion |
| Market Size (2031) | USD 53.67 Billion |
| Growth Rate (2025 - 2030) | 33.45% CAGR |
| Market Concentration | Medium |
Major Players *Disclaimer: Major Players sorted in no particular order Image © Mordor Intelligence. Reuse requires attribution under CC BY 4.0. | |
India Hyperscale Data Center Market Analysis by Mordor Intelligence
The India hyperscale data center market size is valued at USD 9.51 billion in 2025 and is projected to reach USD 53.68 billion by 2031, advancing at a 33.45% CAGR during 2025–2031. This expansion mirrors the rapid build-out of 3,983.22 MW of installed IT load in 2025 toward a forecast 12,768.17 MW by 2031, underscoring the scale of physical infrastructure needed for a digital economy that now touches every sector of Indian commerce. Multiple forces converge behind this surge: data-localization mandates, rising AI workloads, renewable-energy incentives and a growing preference for integrated campus designs. Hyperscale operators are accelerating sovereign builds to comply with the Digital Personal Data Protection Act, while financial-services and streaming platforms funnel more than 300 MW of fresh demand each year into the Mumbai-Chennai corridor. Falling renewable tariffs under ISTS-exempt power-purchase agreements further tilt site-selection calculus toward Gujarat, Rajasthan, Tamil Nadu and Karnataka, helping operators lock in long-term power cost visibility. Competitive intensity is growing as self-build giants and colocation specialists race to secure land, power and fiber, with mechanical-infrastructure spending outpacing IT hardware outlays through the forecast period.
Key Report Takeaways
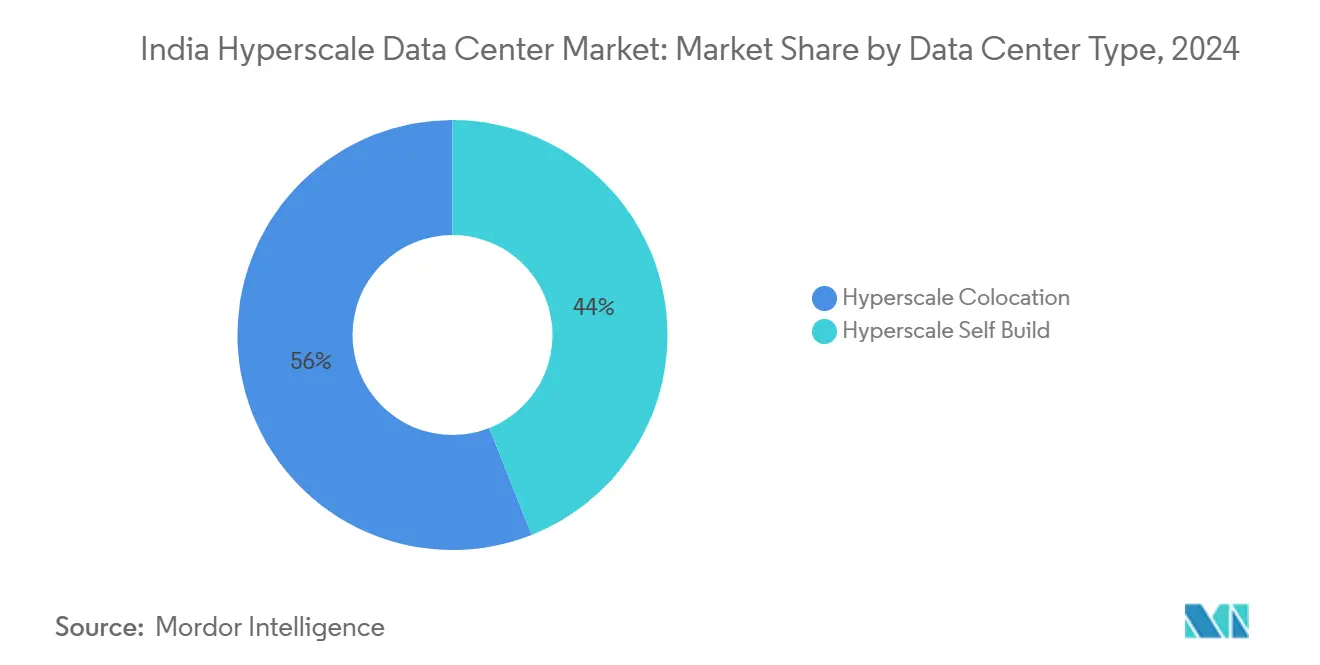
- By data center type, hyperscale self-builds led with 56% of India hyperscale data center market share in 2024, while hyperscale colocation is expected to post a 33.60% CAGR through 2030.
- By component, IT infrastructure accounted for 43% of the India hyperscale data center market size in 2024, whereas mechanical infrastructure is forecast to expand at a 35.10% CAGR between 2025-2030.
- By tier standard, Tier III sites held 70% of the India hyperscale data center market share in 2024; Tier IV deployments are advancing at a 34.50% CAGR to 2030.
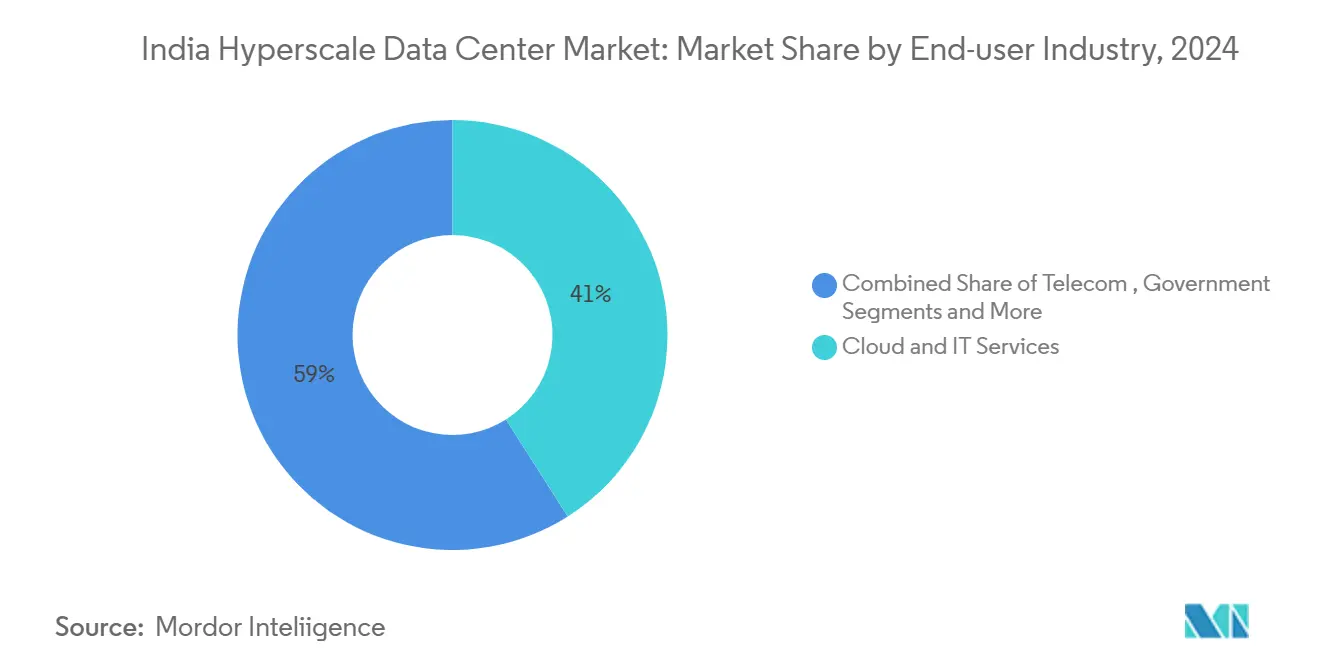
- By end-user industry, cloud and IT services captured 41% of the India hyperscale data center market size in 2024, while media and entertainment is projected to rise at a 34.30% CAGR over 2025-2030.
- By data center size, massive facilities, greater than 25-60 MW, controlled 45% of the India hyperscale data center market share in 2024; mega campuses greater than 60 MW are set to grow at a 33.00% CAGR during 2025-2030.
Each country contributes a share rather than an absolute position, and India is evaluated within that framework. The hyperscale data center market share in Mordor Intelligence's global report defines how those shares are distributed worldwide.
India Hyperscale Data Center Market Trends and Insights
Drivers Impact Analysis*
| Driver | (~) % Impact on CAGR Forecast | Geographic Relevance | Impact Timeline |
|---|---|---|---|
| Digital-Personal-Data-Protection Act mandates driving in-country hyperscale builds | +8.2% | National, with early concentration in Mumbai, Chennai, Bengaluru | Medium term (2-4 years) |
| BFSI and OTT demand is adding more than 300 MW annually in the Mumbai-Chennai corridor | +6.8% | Western and Southern India, spillover to Northern India | Short term (≤ 2 years) |
| ISTS-exempt solar-wind PPAs cutting LCOE for 100 MW campuses | +5.4% | Gujarat, Rajasthan, Tamil Nadu, Karnataka | Long term (≥ 4 years) |
| Jamnagar 3 GW green-hydrogen campus blueprint unlocking power-proximate hinterland sites | +4.1% | Gujarat, Maharashtra, with replication potential in Odisha, Jharkhand | Long term (≥ 4 years) |
| RBI 5-sec disaster-recovery rule forcing multi-region active-active architectures | +3.9% | National, with primary impact in Mumbai, Delhi-NCR, Bengaluru | Medium term (2-4 years) |
| State stamp-duty holidays for Tier-2 DC parks lowering land costs | +2.8% | Tier-2 cities across Maharashtra, Tamil Nadu, Karnataka, Telangana | Short term (≤ 2 years) |
| Source: Mordor Intelligence | |||
Digital-Personal-Data-Protection Act Mandates Driving In-Country Hyperscale Builds
Mandatory data localization requires global platforms to store and process Indian user data domestically, accelerating sovereign infrastructure investments. Financial institutions feel the earliest impact, spurring dedicated compliant capacity in Mumbai and Bengaluru. Amazon Web Services’ Telangana expansion illustrates how cloud leaders bundle AI services with local residency assurances.[1]Telangana Government, “AWS Expansion in Telangana,” it.telangana.gov.in Extraterritorial clauses mean foreign firms must comply even without onshore offices, multiplying infrastructure demand. Early adopters gain latency and trust advantages, reinforcing a flywheel of further capacity additions.
BFSI and OTT Demand Adding >300 MW Annually in Mumbai-Chennai Corridor
Reserve Bank of India cyber-resilience rules compel banks to operate higher-tier sites within 5-second failover targets, filling premium halls around India’s financial capital. Simultaneously, streaming providers push content-delivery nodes toward Chennai’s cable landings, tightening latency budgets for video and gaming. The corridor’s twin pull of finance and subsea connectivity now attracts more than 300 MW yearly, a run rate that smaller colocation models struggle to meet. Spillover demand is migrating toward Pune and Hyderabad as prime land near the western seaboard tightens.
ISTS-Exempt Solar-Wind PPAs Cutting LCOE for 100 MW Campuses
India added 13,495 MW of new generation in Q1 2025, 78.9% of it renewable, giving data-center operators a deep pool of green electrons. The ISTS waiver lets campuses contract cheap solar-wind power across state borders, avoiding grid losses and helping operators reach emission targets. Low-cost renewable energy is now decisive in site selection for AI clusters that require consistent multi-hundred-MW blocks. Gujarat and Tamil Nadu are early winners, combining pro-business policies with plentiful land near renewable corridors.
Jamnagar 3 GW Green-Hydrogen Blueprint Unlocking Power-Proximate Hinterland Sites
Reliance Industries has proposed a 3 GW AI campus integrated with green-hydrogen production in Gujarat, signaling a new era of energy-compute symbiosis. By situating generation next to compute loads, operators cut transmission losses and hedge against fossil-fuel volatility. The model may replicate in Odisha and Jharkhand where wind-solar resources align with inexpensive land. Integrated campuses also satisfy growing sustainability requirements from global cloud buyers and institutional investors.
Restraints Impact Analysis*
| Restraint | (~) % Impact on CAGR Forecast | Geographic Relevance | Impact Timeline |
|---|---|---|---|
| Grid congestion on Mumbai-Kalwa 400 kV ring delaying new feeders | -4.2% | Mumbai Metropolitan Region, spillover to Pune | Short term (≤ 2 years) |
| Long-lead 200G/400G optic transceiver shortages | -3.8% | National, with acute impact in Mumbai, Chennai, Bengaluru | Medium term (2-4 years) |
| Water-conservation surcharge on evaporative cooling (Tamil Nadu 2026) | -2.1% | Tamil Nadu, with potential replication in Karnataka, Telangana | Medium term (2-4 years) |
| Draft carbon-adjusted electricity duty adding ₹1.3/kWh from 2027 | -1.9% | National, with higher impact in coal-dependent states | Long term (≥ 4 years) |
| Source: Mordor Intelligence | |||
Grid Congestion on Mumbai-Kalwa 400 kV Ring Delaying New Feeders
Power-transfer capacity around Mumbai is stretched, with new feeders delayed 12–18 months, throttling time-to-market for fresh halls. System operators deploy real-time analytics to optimize load flows, yet physical bottlenecks persist.[2]Central Electricity Regulatory Commission, “Strengthening of LDCs,” cercind.gov.in Some hyperscale developers pivot to adjacent districts such as Navi Mumbai or relocate farther to Gujarat. While upgrades are planned, near-term growth in the India hyperscale data center market remains gated by this grid constraint.
Long-Lead 200G/400G Optic-Transceiver Shortages
New submarine cables coming online in 2025 promise a quadrupling of national data throughput, but compatible optical modules remain scarce.[3]The Hindu, “Undersea Cables to Quadruple Capacity,” thehindu.com Lead times of 6–9 months force operators to stockpile inventory or slow expansion. Supply tightness increases networking costs, squeezing margins on high-bandwidth AI clusters. Domestic manufacturers explore assembly lines, yet volumes stay well below demand.
*Our forecasts treat driver/restraint impacts as directional, not additive. The impact forecasts reflect baseline growth, mix effects, and variable interactions.
Segment Analysis
By Data Center Type: Self-Build Control vs Rapid Colocation
Self-build deployments supplied 56% of the India hyperscale data center market in 2024 and remain the architecture of choice when operators need bespoke power densities, custom cooling and strict data-residency demarcation. The segment leverages direct land ownership and long-term power contracts, producing attractive total-cost-of-ownership curves for workloads that scale predictably. Hyperscale colocation, by contrast, is rising at a 33.60% CAGR as operators seek speed-to-market, tapping specialist builders who can deliver turnkey halls in under 12 months. Flexible build-to-suit footprints blur traditional boundaries, enabling hybrid models where anchor tenants pre-commit a tranche of capacity and retain customization rights. This convergence is widening choice for cloud, BFSI and OTT buyers and is likely to keep both models relevant through the forecast horizon.
Second-generation colocation campuses now offer private suites wired to hyperscaler optical fabrics, marrying self-build control with shared facility economics. Large operators lock in eight-to-12-year contracts, securing critical-environment standards aligned to Tier III or Tier IV. Cooperating ecosystems create adjacent marketplaces for managed AI accelerators and sovereign Kubernetes stacks, reinforcing the flywheel of India hyperscale data center market growth.


By Component: Cooling Innovation Lifts Mechanical Infrastructure
IT hardware still drives the cost stack, representing 43% of spending in 2024, anchored by CPU, GPU and NVMe flash arrays that feed AI training-and-inference demand. Yet mechanical infrastructure grows the fastest at 35.10% CAGR as operators pivot from chilled-water loops toward direct-to-chip liquid and full-immersion baths. These systems achieve 1.15 PUE or better, slicing power bills and freeing white-space for dense racks. Electrical infrastructure advances more modestly, but lithium-ion UPS blocks and static-switch busways replace legacy lead-acid to save floor area. General construction embraces prefabricated steel frames and skid-mounted power rooms that cut civil-works cycles by 20%. DCIM and BMS suites layer AI-driven analytics to balance thermal loads and predict component failures, a critical differentiator in an increasingly competitive India hyperscale data center industry.
By Tier Standard: Mission-Critical Workloads Accelerate Tier IV Adoption
Tier III footprints dominate with 70% share because they balance 99.982% uptime against capital outlay acceptable to most enterprises. Financial-services mandates and AI terpabyte-scale training, however, are pushing uptake of Tier IV, growing 34.50% CAGR through 2030. Yotta Infrastructure’s Navi Mumbai hub pursues Tier IV certification to serve payment gateways and national-stock-exchange order books requiring continuous availability. Operators achieve fault-tolerance through separate power trains, redundant data halls and dual path fiber, adding 15-20% to capex but reducing risk of SLA breaches. The higher standard signals maturity in the India hyperscale data center market as workloads evolve from stateless web to stateful, latency-sensitive analytics.
By End-User Industry: Streaming Surge Reshapes Capacity Mix
Cloud and IT services remain the largest segment at 41% share, supporting public-cloud regions and private enterprise stacks that deliver e-governance, ERP and CRM workloads. Media and entertainment posts the fastest rise at 34.30% CAGR on the back of regional content localization, interactive gaming and high-resolution video workflows that must stay within Indian borders to respect copyright and data-protection rules . BFSI spurs premium Tier IV footprints, while telecom carriers anchor edge micro-centers that host 5G core functions closer to consumers. Manufacturing and e-commerce adopt hybrid clouds, splitting sensitive design files from low-risk storefront analytics, a pattern that keeps colocation demand steady outside the primary metros. Government initiatives under Digital India reinforce sovereign-cloud momentum and ensure the India hyperscale data center market continues broad-based expansion.

By Data Center Size: Mega Campuses Unlock Scale Economics
Massive sites exceeding 25-60 MW account for 45% of deployed capacity and often anchor multi-building precincts where infrastructure sharing improves unit costs. Mega campuses above 60 MW accelerate at 33.00% CAGR as AI clusters require contiguous, latency-tight networks. Reliance Industries’ 3 GW Jamnagar blueprint demonstrates how energy-compute synergy can support hundreds of thousands of GPUs under one roof. Smaller facilities of ≤25 MW still serve edge nodes and disaster-recovery satellites, especially in Tier-2 markets where land parcels are constrained or power supplies are capped below 66 kV. A portfolio approach emerges, with operators combining mega hubs for training workloads and spoke sites for inference, reinforcing the distributed fabric of the India hyperscale data center market.
Geography Analysis
Western India remains the largest regional cluster, buoyed by Mumbai’s finance ecosystem and seven international cable landings that minimize latency to global trading venues. Installed capacity is dense but grid congestion on the Kalwa loop now nudges operators to Navi Mumbai and Gujarat, where renewable corridors and lower stamp duties sharpen total-cost economics. The India hyperscale data center market size in the west is further protected by strong customer co-location logic between exchange colos, payment switches and banking cores.
Southern India records the fastest supply addition, heading toward 65% capacity growth by 2030 on the strength of Chennai’s subsea gateways, Bengaluru’s deep talent pool and Hyderabad’s proactive incentive regime. Average colocation rates range from INR 6,650–8,500 per kW monthly, a 20% discount to Mumbai, luring cloud exporters and content networks. Renewable uptake is high, with Tamil Nadu’s solar-wind mix feeding AI farms while state water-surcharge debates push innovation in heat-reuse systems. The resulting interplay of policy and economics positions the south as a natural counter-weight in India hyperscale data center market expansion.
Northern India, anchored by Delhi-NCR, caters to government clouds and large enterprise ERP stacks yet wrestles with higher power tariffs and hot-dry summers that inflate cooling loads. Operators deploy hybrid adiabatic chillers and extended-cooling towers to mitigate weather risk. Emerging corridors in Eastern and Central India see green-field industrial parks bundling fiber, land and renewable feeds to lure early movers. Although North-East India contributes negligible megawatts today, its proximity to Southeast Asia makes it strategic for future cable routes, promising broader geographic balance within the India hyperscale data center market.
Mordor Intelligence's coverage of the hyperscale data center market extends across other regions including South America, Asia, and Europe, while country-specific intelligence is also available for Thailand, Philippines, Chile, Hong Kong, Poland, and Singapore, each offering a view on the jurisdiction-level dynamics as applicable.
Competitive Landscape
Competition is intensifying as global hyperscalers, domestic conglomerates and specialist colocation firms jostle for land, power and customers. Amazon Web Services, Microsoft and Google increasingly choose direct ownership models to satisfy compliance and control needs, reducing reliance on third-party landlords. Indian majors such as Adani ConneX pledge multi-gigawatt roadmaps that marry renewable generation with campus builds, diluting early mover advantages held by legacy colo-only players. Partnerships between real-estate developers and cloud platforms proliferate, each seeking to embed value-added services like GPU leasing or sovereign Kubernetes stacks.
Technology differentiation shifts from standard PUE bragging rights to holistic sustainability and AI readiness. Liquid immersion, rear-door heat exchange and modular UPS blocks appear across new builds, enabling 100 kW+ rack densities and levels of operational telemetry suited for machine-learning clusters. Operators who refine integrated energy-compute designs—such as hydrogen-backed systems—garner increased attention from climate-focused investors, reinforcing a virtuous cycle. Price competition remains disciplined in prime metros given land scarcity, but aggressive discounting emerges in Tier-2 cities where supply pipelines out-pace short-term demand, sharpening strategic choices inside the India hyperscale data center market.
M&A activity and joint ventures accelerate as smaller local hosts seek capital and expertise. Telecom carriers bundle fiber backhaul with data-center floor space, while global CDNs partner with rural tower companies to seed micro-edge racks. Venture-funded startups launch software-defined power and cooling controls that help operators shave opex and delay capacity upgrades. Overall, the India hyperscale data center market displays moderate concentration, yet high capital intensity and clear cost-curve advantages for scale suggest consolidation will continue over the next five years.
India Hyperscale Data Center Industry Leaders
Amazon Web Services Inc.
Microsoft Corporation
NTT Global Data Centers
CtrlS Data Centers Ltd.
Reliance Jio (Jio Data Centers)
- *Disclaimer: Major Players sorted in no particular order

Recent Industry Developments
- January 2025: India Energy Group unveiled plans to build the world’s largest data center, underscoring demand for multi-hundred-MW campuses.
- April 2025: Adani Group committed an additional USD 10 billion to build 10 GW of capacity across Tier-2 and Tier-3 locations.
- May 2025: The Government of India reported that renewables accounted for 78.9% of the 13,495 MW generation added in Q1 2025, assisting data-center decarbonization.
- September 2024: Reliance Industries announced a GW-scale AI data-center campus in Gujarat that integrates renewable generation.


Research Methodology Framework and Report Scope
Market Definitions and Key Coverage
Our study defines the Indian hyperscale data center market as the annual revenue generated by campus-style facilities that deliver at least 4 MW of contiguous IT load per tenant and are engineered for line-rate scalability across tens of thousands of servers. Capacity additions tied to self-build cloud regions, wholesale hyperscale colocation halls, and mega campuses funded by domestic conglomerates are counted.
Scope exclusion: Enterprise, edge, and modular micro-sites below 4 MW are outside this assessment.
Segmentation Overview
- By Data Center Type
- Hyperscale Self-build
- Hyperscale Colocation
- By Component
- IT Infrastructure
- Server Infrastructure
- Storage Infrastructure
- Network Infrastructure
- Electrical Infrastructure
- Power Distribution Units
- Transfer Switches and Switchgears
- UPS Systems
- Generators
- Other Electrical Infrastructure
- Mechanical Infrastructure
- Cooling Systems
- Racks
- Other Mechanical Infrastructure
- General Construction
- Core and Shell Development
- Installation and Commisioning Services
- Design Engineering
- Fire Detection, Suppression and Physical Security
- DCIM/BMS Solutions
- IT Infrastructure
- By Tier Standard
- Tier III
- Tier IV
- By End user Industry
- Cloud and IT
- Telecom
- Media and Entertainment
- Government
- BFSI
- Manufacturing
- E-Commerce
- Other End-users
- By Data Center Size
- Large ( Less than or equal to 25 MW)
- Massive (Greater than 25 MW and Less than equal to 60 MW)
- Mega (Greater than 60 MW)
Detailed Research Methodology and Data Validation
Primary Research
Mordor analysts interviewed facility design engineers in Mumbai and Chennai, procurement managers at global cloud providers, and power-utility executives in western and southern grids. Structured questionnaires captured achievable rack densities, PUE trajectories, lease pricing, and construction lead times, which sharpened assumptions gathered from secondary work.
Desk Research
We began with policy, trade, and statistics repositories such as the Ministry of Electronics & IT's Data Centre incentive dashboard, Central Electricity Authority load curves, Telecom Regulatory Authority traffic digests, and customs import codes for servers, switchgear, and chillers. Industry associations, including the Internet and Mobile Association of India and Uptime Institute certifications, supplied deployment benchmarks, while filings on SEBI and MCA portals clarified capex allocations. Paid datasets, D&B Hoovers for operator financials, Dow Jones Factiva for deal flow, and Asia Metal for copper and steel pricing, helped normalize cost curves. Press releases, tender portals, and academic journals on liquid-cooling efficiency rounded out desk inputs. This list is illustrative; many additional public and paid sources were reviewed for metric validation.
Market-Sizing & Forecasting
A top-down build began by reconstructing installed IT load from published capacity pipelines and grid-connection data, then pricing those megawatts using blended annual service rates to reach the revenue baseline. Bottom-up cross-checks sampling supplier bill-of-materials for UPS, chillers, and servers across multiple campuses confirmed margin realism. Key model drivers include commissioned MW, leased-area absorption, average rack density, effective PUE, renewable-power penetration, and prevailing exchange rates. Five-year forecasts apply multivariate regression with exogenous variables such as data-localization mandates, AI workload share, and green-tariff adoption; scenario analysis adjusts for grid-upgrade delays.
Data Validation & Update Cycle
Outputs pass a three-layer review: variance checks against independent capacity trackers, senior-analyst sign-off, and a pre-publication refresh. We update the model annually, re-opening it sooner if incentives change, major capex is announced, or tariff revisions move project economics.
Why Mordor's India Hyperscale Data Center Baseline Stands Solid in India
Published values often diverge because firms pick different service mixes, price bases, and refresh cadences.
Key gap drivers here include whether retail colocation is mingled with hyperscale halls, the handling of in-house self-build revenues, and the weighting of aggressive versus conservative rack-density roadmaps.
Benchmark comparison
| Market Size | Anonymized source | Primary gap driver |
|---|---|---|
| USD 9.51 B (2025) | Mordor Intelligence | - |
| USD 2.07 B (2024) | Regional Consultancy A | Excludes self-build hyperscale revenue and uses conservative 12 kW rack density |
| USD 5.03 B (2024) | Trade Journal B | Blends enterprise and edge sites into total, inflating facility count but lowering per-site value |
| USD 3.30 B (2023) | Global Consultancy C | Treats only realized facilities, omitting 18-month committed pipeline and FX-adjusted pricing |
In sum, by aligning scope strictly to ≥4 MW halls, validating densities through on-site interviews, and refreshing numbers every twelve months, Mordor Intelligence delivers a balanced, transparent baseline that managers can replicate and trust.


Key Questions Answered in the Report
What is the projected value of the India hyperscale data center market by 2031?
The market is expected to reach USD 53,679.01 million by 2031, expanding at a 33.45% CAGR during 2025-2031.
Which data-center type currently dominates capacity?
Self-build hyperscale facilities hold 56% of 2024 capacity, reflecting operators’ preference for bespoke, compliance-ready infrastructure.
Why are Tier IV facilities growing rapidly?
Financial-services disaster-recovery mandates and AI workloads with zero-downtime requirements are driving a 34.50% CAGR for Tier IV builds.
How are renewable-energy policies affecting site selection?
ISTS-exempt solar-wind PPAs allow operators to secure low-cost power, pushing new campuses toward Gujarat, Rajasthan, Tamil Nadu and Karnataka.
Which end-user segment is forecast to grow fastest?
Media & entertainment workloads, driven by content localization and gaming, are projected to climb at a 34.30% CAGR through 2030.
What grid challenge constrains growth in Mumbai?
Congestion on the Mumbai-Kalwa 400 kV ring delays new feeder approvals by up to 18 months, prompting some operators to consider alternative sites.
Page last updated on:


