Market Overview
| Study Period | 2020 - 2031 |
|---|---|
| Forecast Data Period | 2026 - 2031 |
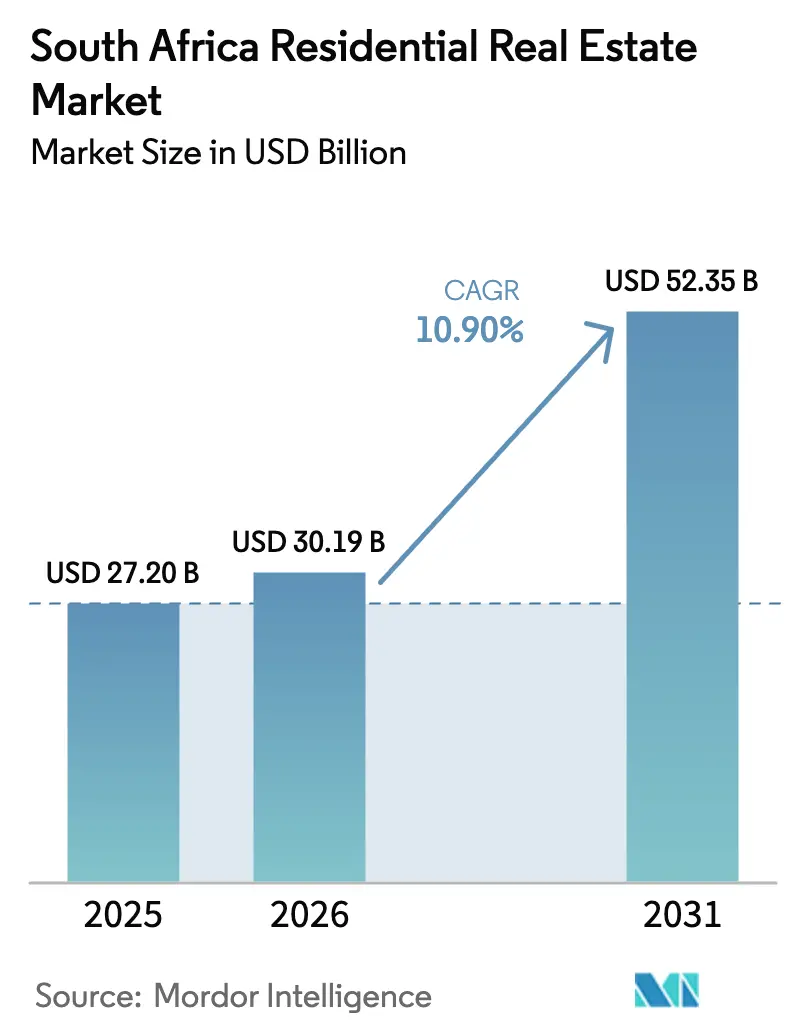
| Base Year Market Size (2025) | USD 27.20 Billion |
| Market Size (2026) | USD 30.19 Billion |
| Market Size (2031) | USD 52.35 Billion |
| Growth Rate (2026 - 2031) | 10.90% CAGR |
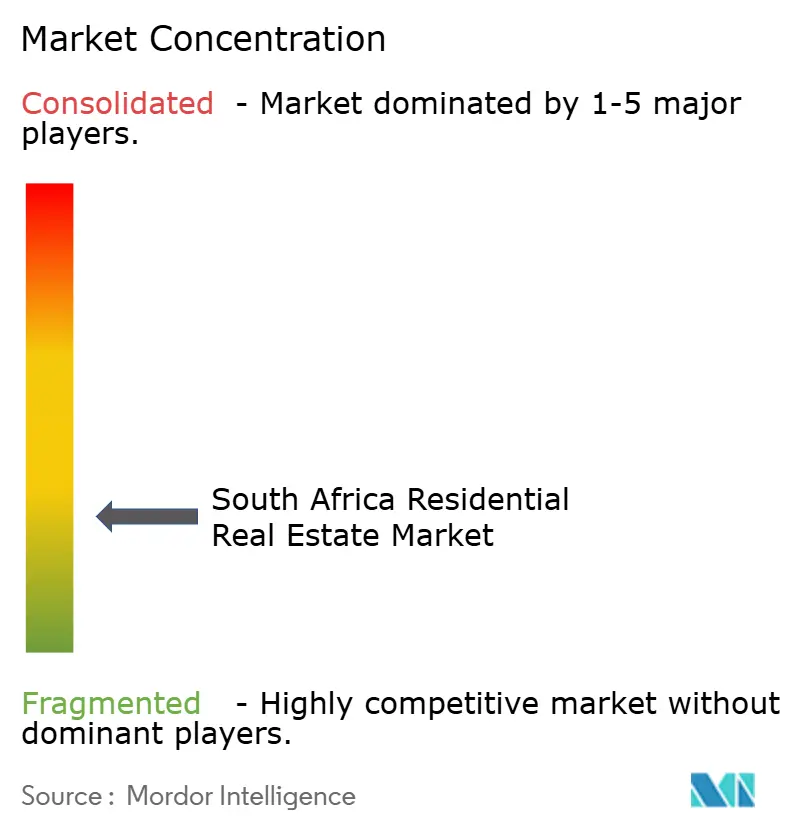
| Market Concentration | Low |
Major Players *Disclaimer: Major Players sorted in no particular order Image © Mordor Intelligence. Reuse requires attribution under CC BY 4.0. | |
South Africa Residential Real Estate Market Analysis by Mordor Intelligence
The South Africa residential real estate market is estimated at USD 30.19 billion in 2026, and is expected to reach USD 52.35 billion by 2031, at a CAGR of 10.9% during the forecast period (2026 - 2031). This vigorous pace results from easier monetary conditions, the nationwide rollout of the Electronic Deeds Registration System, and sizable pent-up demand in both affordable and coastal lifestyle segments. Momentum continues even while national GDP grew just 0.6% in 2024 and 1.8% in 2025, showing that housing demand operates on drivers largely detached from near-term macro volatility[1]https://www.statssa.gov.za/. First-time buyers draw on expanded FLISP subsidies, while higher-income households relocate from Gauteng to the Western Cape, KwaZulu-Natal, and Eastern Cape, spurring double-digit price expansion in secondary coastal metros. The investment community is also repositioning toward income-producing rental stock as interest-rate cuts widen the spread between gross yields and ten-year sovereign bonds.
Key Report Takeaways
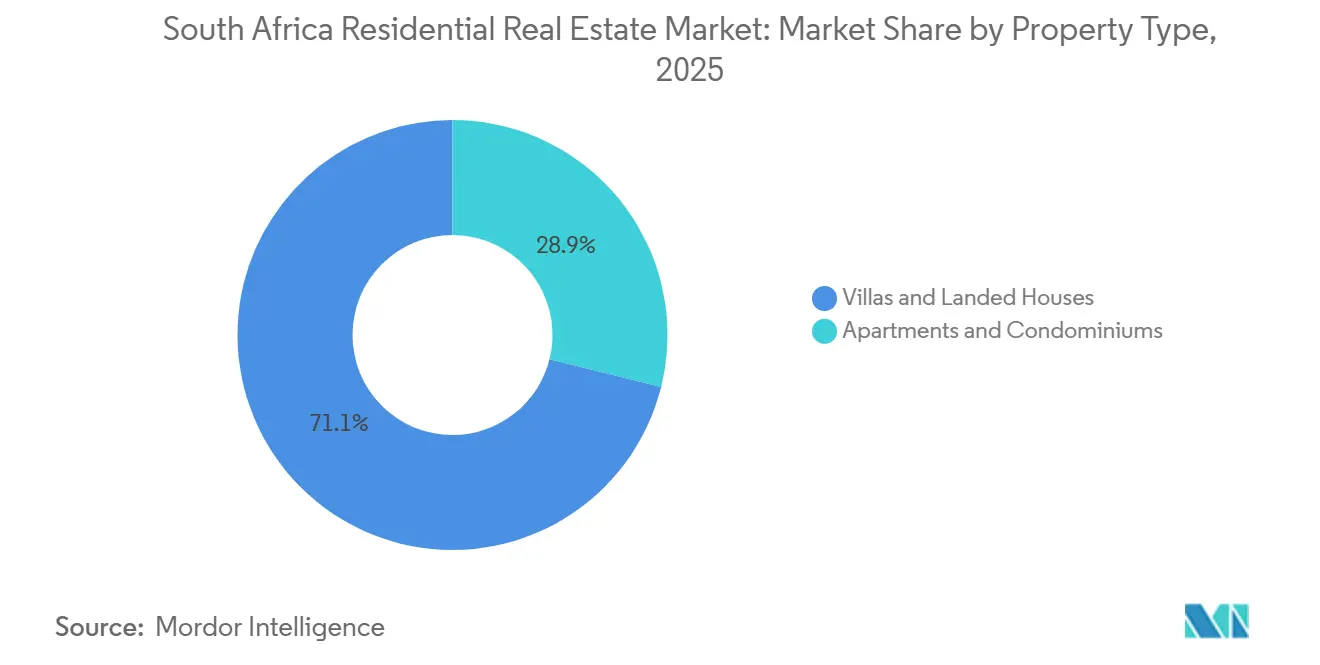
- By property type, villas and landed houses held 71.1% of the South Africa residential real estate market share in 2025, while apartments and condominiums are forecast to post an 11.4% CAGR through 2031.
- By price band, affordable units captured 45.3% of the 2025 value, yet luxury homes priced above USD 273,000 are set to expand at an 11.5% CAGR through 2031.
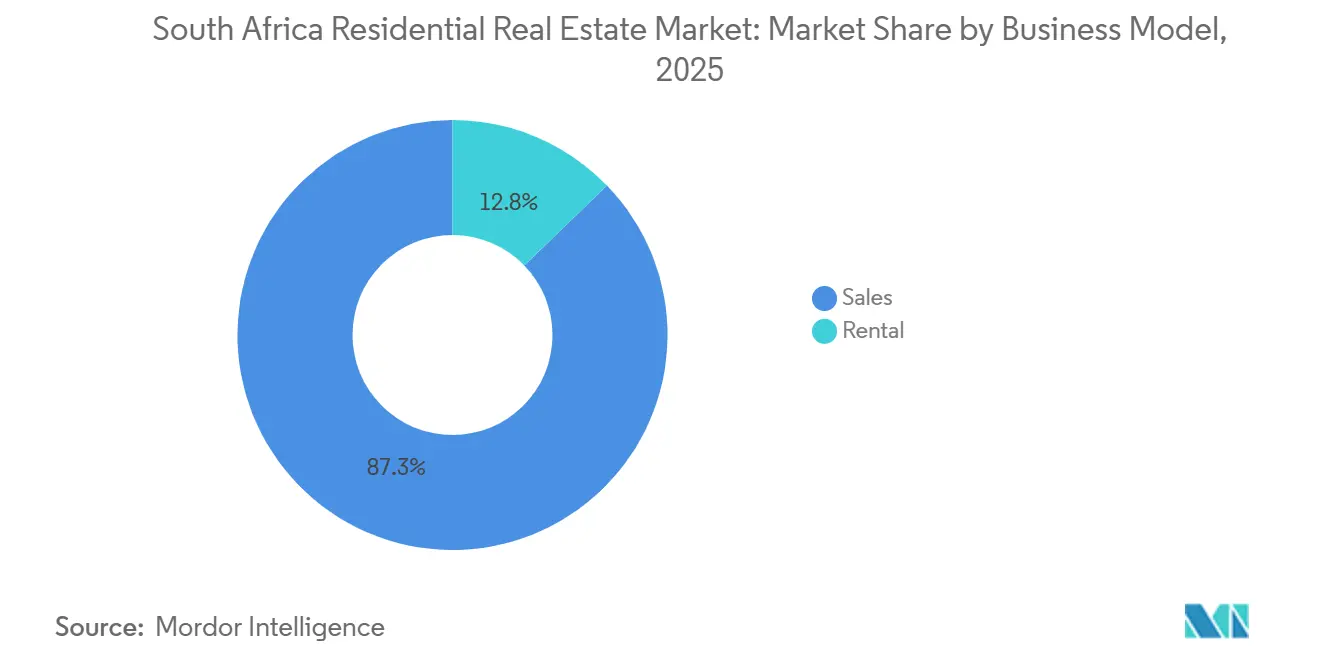
- By business model, sales transactions dominated with an 87.3% share in 2025, whereas rental activity is projected to rise at a 12.2% CAGR over the outlook period.
- By mode of sale, secondary transactions made up 67.9% of value in 2025, and primary new-build sales are expected to grow fastest at 12.4% CAGR to 2031.
- By key cities, Cape Town commanded 23.4% of value in 2025, and Bloemfontein is positioned for the quickest advance at an 11.8% CAGR through 2031.
Note: Market size and forecast figures in this report are generated using Mordor Intelligence’s proprietary estimation framework, updated with the latest available data and insights as of January 2026.
South Africa Residential Real Estate Market Trends and Insights
Drivers Impact Analysis*
| Drivers | (~) % Impact on CAGR Forecast | Geographic Relevance | Impact Timeline |
|---|---|---|---|
| Structural undersupply of affordable housing amid urbanization | +2.8% | Gauteng, Western Cape, KwaZulu-Natal | Long term (≥ 4 years) |
| Expansion of FLISP subsidy and securitization boosting first-time buyers | +2.1% | National | Medium term (2-4 years) |
| Remote-working professionals driving semigration to coastal secondary cities | +1.6% | Western Cape, KwaZulu-Natal, Eastern Cape | Medium term (2-4 years) |
| Buy-to-let investment surge via REIT conversion of sectional-title stock | +1.4% | Major metros | Medium term (2-4 years) |
| Protech-enabled digital transactions accelerating sales velocity | +1.2% | National | Short term (≤ 2 years) |
| Source: Mordor Intelligence | |||


Structural Undersupply of Affordable Housing Amid Urbanization in Gauteng and Western Cape
Affordable housing stock lags demand by more than 1.6 million units in the two provinces that host the bulk of population inflows[2]https://www.capetown.gov.za/. Waiting lists reached 375,000 households in Cape Town and 1.3 million in Johannesburg during 2024, a gap that widens each year because land release and municipal approvals move slowly. Even though the housing ministry earmarks USD 656 million per year for subsidized build programs, rezoning delays often stretch to 24 months, prompting private developers to focus on pre-serviced corridors such as Midrand Waterfall. Land prices in these nodes exceeded USD 46,500 per plot in 2025, putting pressure on entry-level budgets despite rising subsidies. The imbalance keeps the affordable segment firmly in control of volume growth and underpins steady price inflation even in higher-rate environments.
Expansion of FLISP Subsidy and Securitization Boosting First-Time Buyers
FLISP now covers deposits between USD 2,100 and USD 9,100, which closes the upfront funding gap for households earning up to USD 1,200 monthly. Coupled with a 125-basis-point prime-rate decline that trimmed monthly payments on a USD 55,000 mortgage by USD 66, affordability improved measurably in 2025. New securitization rules allow banks to bundle these loans, lowering origination costs by as much as 75 basis points and lifting approval rates to 68% in 2024. BetterBond and ooba Home Loans processed 22% more FLISP-backed applications year over year, channeling additional liquidity toward the affordable tier. Regional skew persists because Gauteng and Western Cape together still collect 62% of total disbursements.
Remote-Working Professionals Driving Semigration to Coastal Secondary Cities
Remote work settled at 28% of white-collar roles in 2024, giving professionals freedom to leave Gauteng for seaside towns that offer lifestyle benefits and lower home prices. The Western Cape absorbed 32.4% of net inter-provincial moves, and the trend raised median transaction values in Hermanus, Ballito, and Knysna by 3.8% to 4.2% in 2025 [3]https://www.fnb.co.za/. Most migrants are 36-49 years old and purchase properties in the USD 137,000–USD 273,000 band, fuelling new mixed-use estates that integrate coworking hubs. Environmental clearances lasting up to 36 months constrain near-term supply, and that tightness lifts price growth ahead of inland averages. The semigration wave creates a bifurcated trajectory where coastal nodes outpace core Gauteng metros.
Buy-to-Let Investment Surge via REIT Conversion of Sectional-Title Stock
South Africa’s REIT rules incentivize rental-income distribution and limit gearing, attracting yield-seeking investors into sectional-title portfolios. Developers delivered 4,866 sectional units in 2025, up 13.5% year to date, despite a 21.2% slide in municipal approvals, indicating a tilt toward higher-density formats that can be packaged for REIT holdings. Residential penetration inside listed REITs remains under 5%, yet smaller private syndicates stepped in where incumbents Growthpoint and Redefine keep minimal housing exposure. Conversion costs of USD 2,700–USD 8,200 per unit remain a hurdle, but steady rental yields of 6%–8% and faster electronic registration speed strengthen the case. Pension funds that integrate ESG metrics increasingly direct allocations toward affordable rental blocks, giving the segment a longer runway.
Restraints Impact Analysis*
| Restraints | (~) % Impact on CAGR Forecast | Geographic Relevance | Impact Timeline |
|---|---|---|---|
| Prime lending rate above 11% squeezing mortgage affordability | -1.8% | National, with acute impact in Gauteng, Western Cape, and KwaZulu-Natal | Short term (≤ 2 years) |
| Persistent load-shedding inflating build costs & dampening sentiment | -1.3% | National, with severe impact in Gauteng, Western Cape, and KwaZulu-Natal metros | Medium term (2-4 years) |
| Municipal service backlogs delaying plan approvals | -1.1% | Johannesburg, Tshwane, eThekwini, with spillover to secondary metros | Long term (≥ 4 years) |
| Reduced foreign-buyer demand from tighter exchange-control & visa rules | -0.7% | Cape Town (Atlantic Seaboard), Johannesburg (Sandton), Durban (Umhlanga) | Medium term (2-4 years) |
| Source: Mordor Intelligence | |||
Prime Lending Rate Above 11% Squeezing Mortgage Affordability
Even after three consecutive rate cuts, the prime rate stood at 10.5% in July 2025, roughly 325 basis points above the 2019 average. Monthly payments on a USD 55,000 loan consume 34% of the median Gauteng household income, breaching the 30% affordability ceiling promoted by the National Credit Regulator. Bond approval rates for non-subsidized applicants slipped to 52% in 2024 as banks tightened debt-service ratio thresholds. Developers acknowledged the strain; Balwin’s mid-2025 unit sales fell 16% year on year, pushing the firm further toward entry-level product lines. A deeper rate-cutting cycle would clearly lift sentiment, but it remains contingent on disinflation that is not yet fully embedded.
Persistent Load-Shedding Inflating Build Costs and Dampening Sentiment
Although Eskom suspended outages after March 2024, developers still carry the cost of backup systems installed during 2022–2023, increasing construction budgets by roughly 10%. Survey data show that 43% of prospective buyers rank reliable power as a decisive factor, especially in Johannesburg and Cape Town. Solar and battery packages add USD 8,200–USD 13,700 per unit, pushing certain affordable products above subsidy thresholds. Treasury’s infrastructure pipeline reaches 2030, so the risk of renewed blackouts still weighs on confidence. As long as sentiment remains fragile, discretionary upgrades and second-home purchases stay below their potential.
*Our forecasts treat driver/restraint impacts as directional, not additive. The impact forecasts reflect baseline growth, mix effects, and variable interactions.
Segment Analysis
By Property Type: Villa dominance and apartment ascent
Villas and landed houses commanded a 71.12% South Africa real estate market share in 2025, reflecting entrenched preferences for private outdoor space and gated security. Transaction volumes surged in semigration hot-spots where larger erven remain attainable, reinforcing the segment’s leadership. Yet urban land scarcity and rising construction costs encourage compact layouts, nudging developers to consider modular designs and off-site fabrication. Institutional landlords are also re-entering the mid-income freehold segment, bundling scattered homes into rental portfolios to capture yield stability.
Apartments and condominiums represent the fastest-growing slice, expanding at an 11.4% CAGR toward 2031. Developers leverage sectional title legislation to pre-sell units, which eases project financing and de-risks balance sheets. Mixed-use precincts in Cape Town’s Longkloof or Johannesburg’s Sandton nodes blend residential, retail, and flexible offices, appealing to professionals who value proximity over plot size. Smart-home features and green building ratings amplify tenant appeal, while short-stay platforms create ancillary income streams that bolster underwriting assumptions.

By Price Band: Affordable leadership with luxury surge
Affordable homes priced at or below USD 82,000 claimed a commanding 45.3% of the 2025 value, thanks to the widened FLISP bracket and securitized mortgage funding. In parallel, luxury stock above USD 273,000 enjoys the fastest expected advance at 11.5% CAGR, reflecting continued semigration from Gauteng and the inflow of international retirees. The dual-track pattern keeps median effective price increases modest in mid-market bands where interest-rate sensitivity is highest. Cape Town’s Atlantic Seaboard saw luxury transactions eclipse 14% year-on-year in 2024, although the same geography supports only slow affordable activity because median land costs run far beyond subsidy coverage.
FLISP expansion narrowed deposit gaps for thousands of entry-level families, but the programme’s USD 82,000 ceiling excludes core Atlantic Seaboard and Sandton addresses. Consequently, Bloemfontein, Gqeberha, and Polokwane register disproportionate take-up. Luxury buyers, meanwhile, remain less rate-conscious and prioritize security, proximity to beaches, and immediate access to backup power. Developers balance the portfolio by rolling out mixed-product estates that slot high-end detached homes beside mid-rise affordable blocks, an approach evident in Balwin’s Ballito Hills project. The strategy hedges against cyclical swings and anchors stable cash flow under varying credit conditions.
By Business Model: Ownership tradition meets rental momentum
Sales still accounted for 87.3% of 2025 turnover, but the rental slice is poised for a 12.2% CAGR to 2031, outstripping sales growth of 10.6%. Gross yields of 6%–8% exceed inflation by roughly 200 basis points and, once leverage is applied, generate attractive cash-on-cash returns for REIT and private-equity players. Electronic registration boosts liquidity, which shortens the cash conversion cycle for professional landlords. For end-users, elevated interest rates delay ownership and intensify rental demand, especially among the 25–34 age cohort in Cape Town and Johannesburg.
Residential REIT penetration remains low at under 5%, yet conversion momentum is building as pension funds seek alternatives to volatile equity dividends. High vacancy in older Johannesburg CBD towers is driving share-block-to-sectional shift because fresh capital is more willing to underwrite refurbishments once ownership is simplified. Longer term, rising institutional interest should narrow the pricing gap between commercial and residential cap rates, making the sector structurally more investable for global capital.
By Mode of Sale: New-Build Momentum Defies Approval Bottlenecks
Secondary transactions comprised 67.9% of market value in 2025, reflecting the dominance of South Africa’s mature housing stock. Nonetheless, primary new-builds carry the highest outlook at 12.4% CAGR as developers preload pipelines with land already cleared for infrastructure. Affordable-focused Calgro M3 delivered 1,650 units in 2024 and maintains a queue of 25,000 plots, illustrating how deep land banks offset municipal bottlenecks. Buyers gravitate toward energy-efficient new stock that sharply lowers running costs, a factor that existing-home sellers struggle to match without costly retrofits.
The Electronic Deeds Registration System cuts title lag, which used to create a mismatch between developer outflows and inflows. That improvement reduces financing costs and lowers the minimum viable scale for boutique builders. However, mid-market price points still face shortages because land inside established metros remains costly and scarce. Unless service-delivery backlogs improve, most short-term volume gains will come from projects adjacent to already serviced corridors.
Geography Analysis
Cape Town maintained a 23.4% slice of the South Africa residential real estate market in 2025 and achieved enduring premiums because a 375,000-unit waiting list keeps formal stock undersupplied. The city’s Atlantic Seaboard trades at average prices above USD 547,000, attracting both domestic semigrants and a stable pool of foreign buyers, though recent visa tightening added friction to offshore demand. Transaction values continue to rise even while municipal approvals contracted 21.2% in 2025, underscoring structural supply limits.
Johannesburg houses the nation’s largest urban economy, yet a 40% non-compliance rate across 3,000 buildings chokes fresh inventory, pushing up prices in Sandton and Rosebank well ahead of broader Gauteng averages. Remote workers relocating to the Western Cape and KwaZulu-Natal temper local absorption, yet Johannesburg still seeds liquidity into secondary nodes when owners dispose of high-value assets to fund coastal purchases. Durban’s eThekwini municipality faces a 60% compliance backlog, but Umhlanga and Ballito outperform on the back of strong in-migration and corporate relocations linked to the Dube TradePort.
Bloemfontein posts the fastest growth trajectory at 11.8% CAGR to 2031 because USD 52,000 median pricing sits squarely within FLISP eligibility, boosting first-time ownership. Pretoria sustains a moderate 3.5% annual appreciation by leveraging its public-sector employment base. Port Elizabeth trails coastal peers due to auto-sector volatility, yet new logistic corridors could revive sentiment beyond 2026. Outlying metros and rural nodes hold roughly one-third of national value and will keep expanding in line with broader semigration patterns as connectivity and remote-work tools improve.
Competitive Landscape
The South Africa residential real estate market is considered to be highly fragmented. Developers Balwin Properties and Calgro M3 dominate the affordable-to-mid-market band, but both reported margin compression after backup-power investments lifted build costs by about 10% during the 2022–2023 blackout period. Balwin’s revenue fell to USD 145 million in the half year to August 2024, prompting a pivot toward products priced below USD 82,000, while Calgro sustained positive growth through disciplined land banking and phased rollouts.
Brokerage rivals Pam Golding, Seeff, and RE/MAX differentiate via digital platforms that integrate electronic deeds registration, 3D walk-throughs, and chatbot lead capture. Pam Golding executed more than 15,000 transactions in FY 2024 and saw rental revenue climb 12% as investors chased high gross yields. RE/MAX leverages a 2,500-agent footprint to deepen reach in secondary metros such as Bloemfontein and Nelspruit, while Seeff capitalizes on early solar-ready listing certification to appeal to power-conscious buyers.
PropTech originators BetterBond and ooba process over 40% of new mortgages and have built machine-learning scorecards that compress decision cycles. On the institutional side, listed REITs Growthpoint and Redefine remain under-weight residential, although smaller private vehicles accelerate conversion pipelines for sectional-title blocks. ESG-aligned pension funding is emerging as a potent force in green affordable projects and could reshape competitive dynamics once scalable structures reach full proof of concept.
South Africa Residential Real Estate Industry Leaders
Pam Golding Properties
Seeff Property Group
RE/MAX of Southern Africa
Rawson Property Group
Chas Everitt International
- *Disclaimer: Major Players sorted in no particular order

Recent Industry Developments
- April 2025: The Deeds Office deployed the Electronic Deeds Registration System, cutting transfer times to roughly three weeks and enabling faster inventory turnover.
- February 2025: The Housing Ministry issued a white paper that commits USD 656 million per year to subsidies and opens a securitization route for FLISP mortgages.
- February 2025: Growthpoint Properties delivered the Longkloof Precinct in Cape Town, achieving sub-2% vacancy and opening the Canopy by Hilton hotel.
- January 2025: Barloworld launched Phase 1 of Barlow Park in Sandton, introducing 750 rental apartments and signaling its pivot toward mixed-use urban renewal. Phase 2 with 860 units is scheduled for mid-2025.


Research Methodology Framework and Report Scope
Market Definitions and Key Coverage
Our study defines the South African residential real estate market as the annual value of sales and rentals of legally zoned homes, villas, landed houses, apartments, and condominiums recorded in the national deeds registry or in formal leases. In practice, we follow each deed transfer or notarized lease to capture true money changing hands, not advertised asking prices.
Scope exclusion: informal backyard dwellings and unregistered rural homesteads are omitted because verifiable valuations are unavailable.
Segmentation Overview
- Sales
- Rental
Detailed Research Methodology and Data Validation
Primary Research
Mordor analysts interviewed estate agents, conveyancing attorneys, mortgage underwriters, and provincial housing officials across Gauteng, Western Cape, KwaZulu-Natal, and secondary cities. These conversations clarified discounting trends, deal-closing lags, and subsidy uptake, letting us refine model assumptions that raw statistics alone cannot show.
Desk Research
We began with Statistics South Africa's dwelling completion tables, South African Reserve Bank mortgage advances, Center for Affordable Housing Finance subsidy dashboards, and municipal deeds registry extracts, which together reveal volumes, prices, and regional skews. Complementary context came from World Bank urbanization data, National Treasury budget papers, and reputable press on policy shifts. Where company-specific inputs were needed, say average selling prices of listed developers, our team accessed D&B Hoovers and Dow Jones Factiva. This catalog is illustrative; many other open and proprietary sources fed the evidence base.
Market-Sizing & Forecasting
A top-down and bottom-up blend guides the model. We start with nationwide deed values and mortgage originations, reconstructing total market turnover, then corroborate results with developer roll-ups and channel checks on sampled average selling price times units. Key variables like new-build completions, prime lending rates, household disposable income growth, inter-provincial migration, and vacancy ratios drive both historical sizing and projections. Multivariate regression, stress tested with scenario analysis, extends these inputs through 2030, while gap areas such as cash sales in informal townships are bridged using calibrated ratios from primary research.
Data Validation & Update Cycle
Outputs pass variance screens against independent metrics, such as building materials sales and bond registrations, before senior analyst sign-off. Reports refresh every twelve months, with interim updates if policy or interest rate shocks move the market; a fresh validation run precedes each client delivery so users receive today's view, not last quarter's.
Why Mordor's South Africa Residential Real Estate Baseline Earns Trust
Published estimates often diverge because firms tally different value streams, convert currencies on dissimilar dates, or mix asset stock with yearly turnover.
Key gap drivers include alternate scopes, as some count only rental revenue while others count the entire residential asset base, inconsistent average price assumptions, and refresh cycles that lag fast-moving lending conditions. By anchoring on verified deed transfers and testing them against live agent feedback, Mordor delivers a number that decision makers can replicate.
Benchmark comparison
| Market Size | Anonymized source | Primary gap driver |
|---|---|---|
| USD 30.19 B (2025) | Mordor Intelligence | |
| USD 89.11 B (2024) | Regional Consultancy A | Counts full residential asset stock, inflating current year turnover |
| USD 95.8 B (2024) | Trade Journal B | Measures landlord rental revenue only, omits sale transactions |
| USD 22.66 B (2024) | Global Consultancy A | Blends residential with commercial and uses book values, not market deals |
The comparison shows that once scope and valuation basis are aligned, Mordor's disciplined, transaction grounded approach provides the most balanced and transparent baseline for planners who cannot afford surprises.


Key Questions Answered in the Report
How large is the South Africa residential real estate market today?
The South Africa residential real estate market size is USD 30.19 billion in 2026 and is forecast to exceed USD 52 billion by 2031.
Which segment holds the biggest share of value?
Villas & landed houses lead with 71.1% of 2025 transaction value, reflecting a long-standing consumer preference for freestanding properties.
What is driving the sharp rise in sectional-title apartments?
Developers favor high-density formats on scarce urban land, and faster digital deeds transfer improves liquidity for investors, resulting in an 11.4% CAGR outlook for apartments to 2031.
Why is Cape Town consistently the most expensive metro?
A chronic undersupply, strong lifestyle appeal and steady inflow of high-net-worth semigrants push Cape Town prices well above other metros.
How are interest-rate trends affecting first-time buyers?
A 125-basis-point drop in prime rate since 2024 trims monthly payments, while FLISP subsidies narrow deposit gaps, lifting approval rates for entry-level borrowers.
What makes Bloemfontein the fastest-growing city market?
Affordability around USD 52,000, combined with lower municipal bottlenecks, positions Bloemfontein for an 11.8% CAGR through 2031.
Page last updated on:


