Software Energy Consumption Analytics Market Size and Share
Market Overview
| Study Period | 2020 - 2031 |
|---|---|
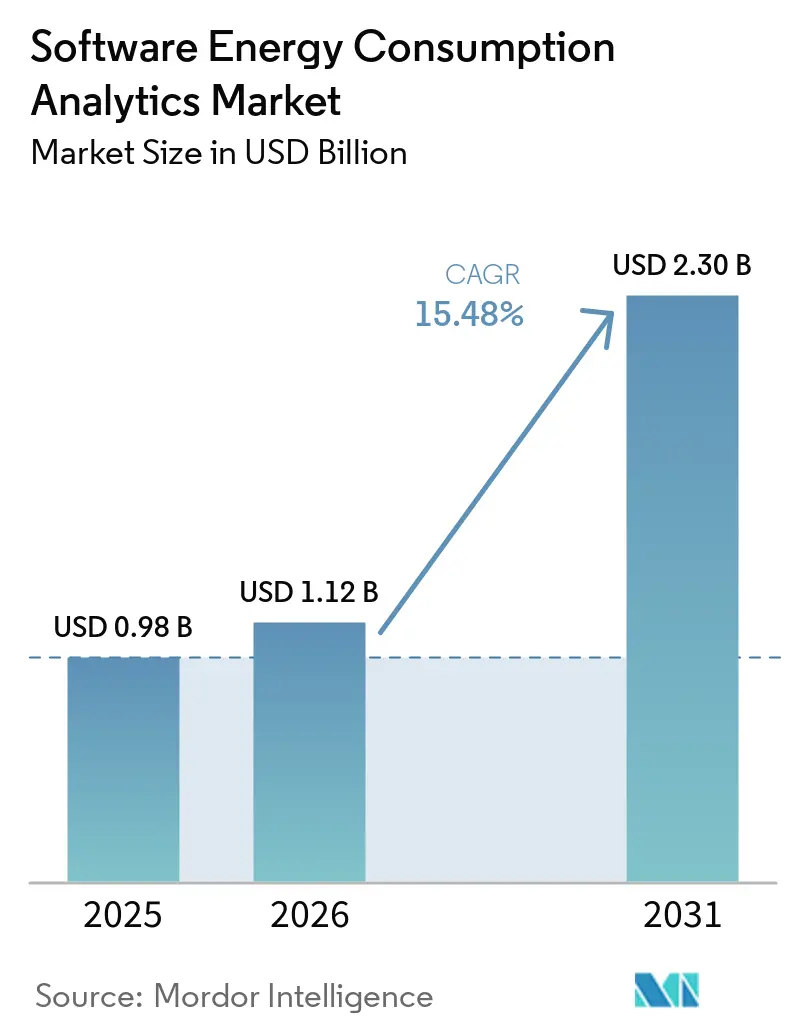
| Market Size (2026) | USD 1.12 Billion |
| Market Size (2031) | USD 2.30 Billion |
| Growth Rate (2026 - 2031) | 15.48% CAGR |
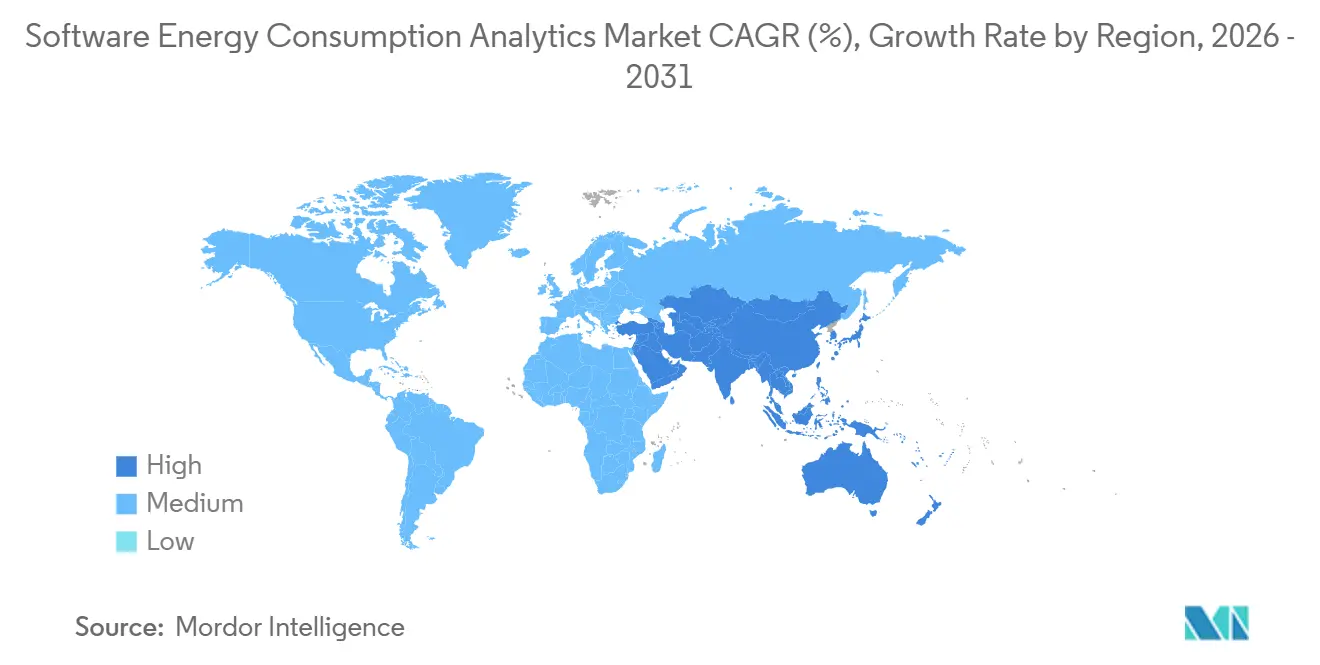
| Fastest Growing Market | Asia-Pacific |
| Largest Market | Europe |
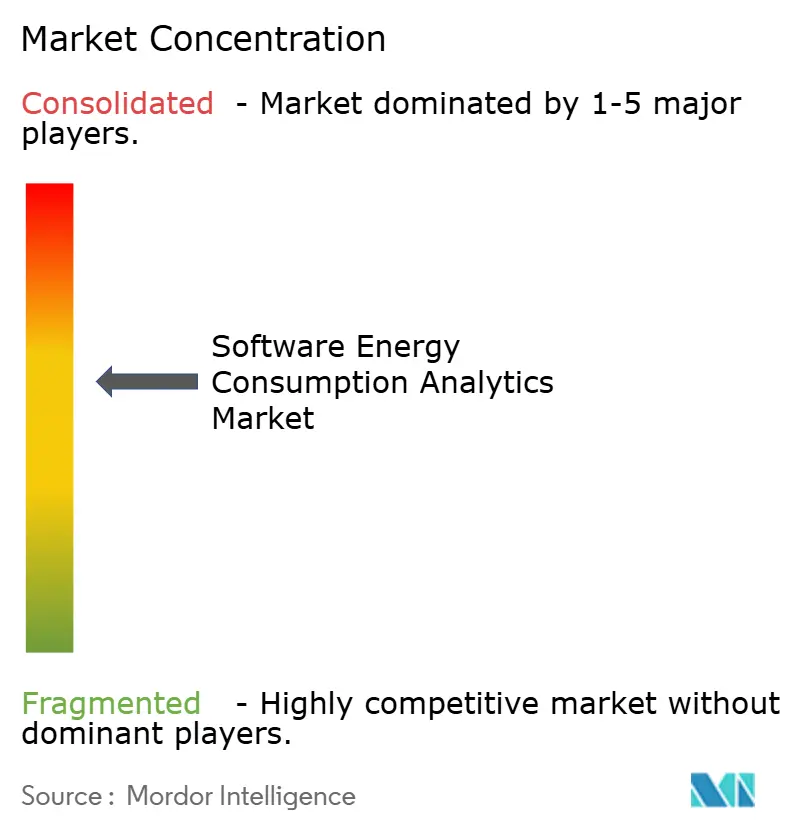
| Market Concentration | Medium |
Major Players *Disclaimer: Major Players sorted in no particular order Image © Mordor Intelligence. Reuse requires attribution under CC BY 4.0. | |
Software Energy Consumption Analytics Market Analysis by Mordor Intelligence
The software energy consumption analytics market was valued at USD 0.98 billion in 2025 and is forecast to reach USD 2.30 billion by 2031, advancing at a CAGR of 15.48% from 2026 to 2031. Growth is being supported by stricter energy reporting rules across major economies, wider use of IoT metering infrastructure, and faster enterprise adoption of cloud-native platforms that can process high-volume consumption data in near real time. Utility cost pressure remains the clearest near-term demand driver, as the October 2025 transposition deadline under the EU Energy Efficiency Directive has turned many compliance expectations into enforceable national obligations. The software energy consumption analytics market is also benefiting from a feedback loop around AI data centers, because these facilities are both major users of energy analytics tools and a major source of demand for the AI features built into them. Competition is staying active because large platform vendors are extending broad software suites while specialist vendors are winning with faster integrations and more flexible architectures. Adoption is still moving unevenly in industrial and regulated utility settings because implementation talent is limited, and cybersecurity concerns rise when IT analytics tools connect to OT environments.
Key Report Takeaways
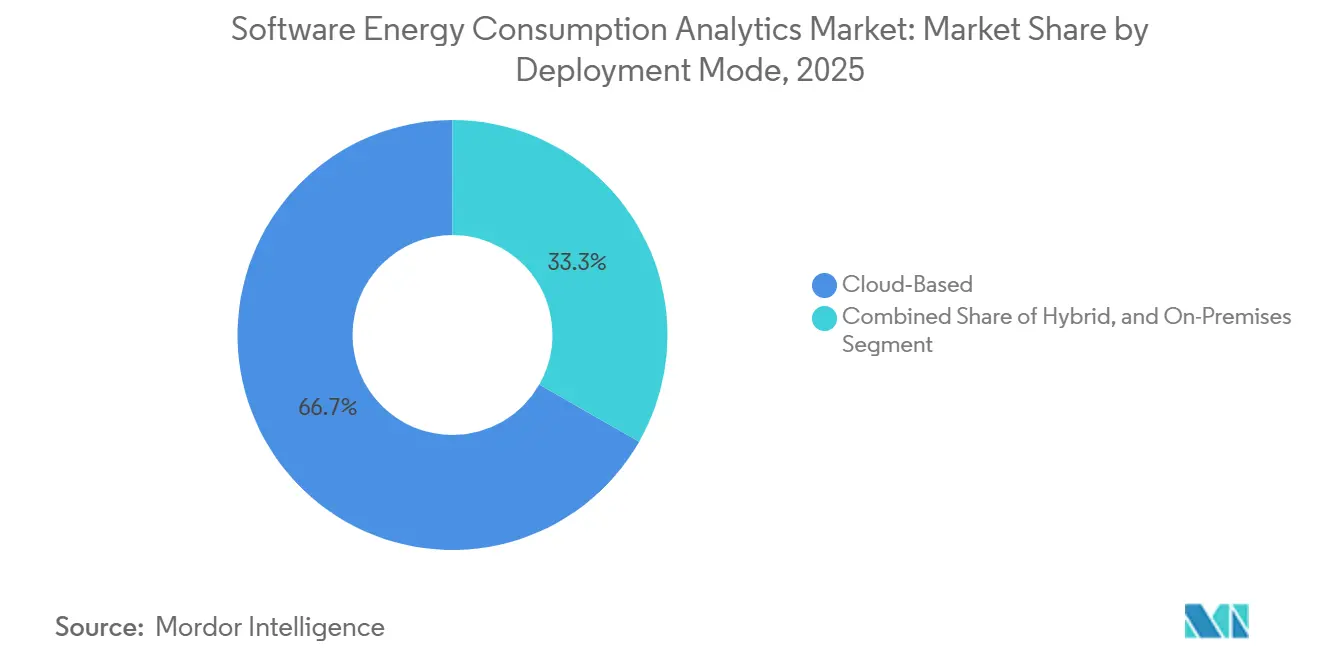
- By deployment mode, cloud-based solutions held 66.74% of the software energy consumption analytics market share in 2025, while hybrid deployment is projected to expand at a 16.25% CAGR through 2031.
- By component, software accounted for 70.12% of the software energy consumption analytics market size in 2025, while services are projected to grow at a 15.92% CAGR through 2031.
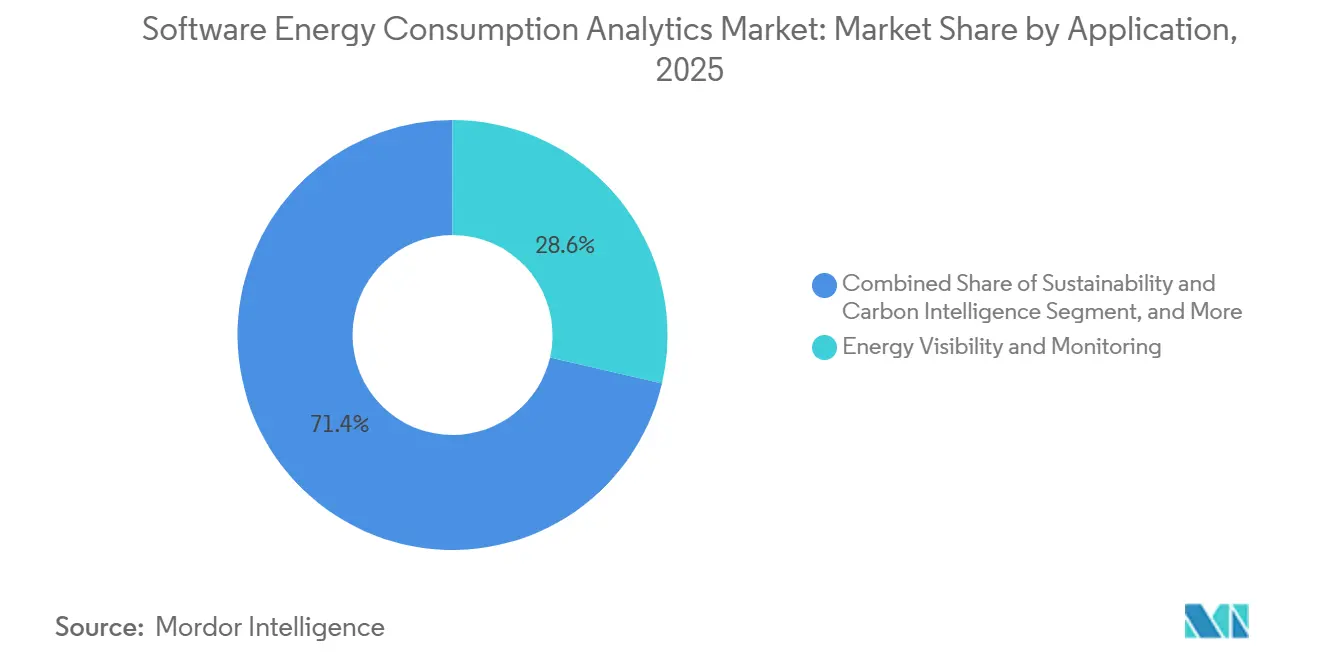
- By application, energy visibility and monitoring accounted for 28.63% of the software energy consumption analytics market size in 2025, while sustainability and carbon intelligence is projected to expand at a 16.78% CAGR through 2031.
- By end-use industry, IT and telecom held 26.41% of revenue in the software energy consumption analytics market in 2025, while retail and e-commerce is projected to grow at a 15.89% CAGR through 2031.
- By geography, Europe captured 34.56% of the software energy consumption analytics market share in 2025, while Asia-Pacific is projected to expand at a 16.34% CAGR through 2031.
Note: Market size and forecast figures in this report are generated using Mordor Intelligence’s proprietary estimation framework, updated with the latest available data and insights as of January 2026.
Global Software Energy Consumption Analytics Market Trends and Insights
Drivers Impact Analysis*
| Driver | (~) % Impact on CAGR Forecast | Geographic Relevance | Impact Timeline |
|---|---|---|---|
| Rising Utility Cost Pressure and Energy Efficiency Mandates | +3.2% | Global, with concentrated compliance urgency in EU and North America | Short term (≤ 2 years) |
| Rapid Smart Meter and IoT Telemetry Expansion | +2.8% | APAC core, spill-over to Middle East and Africa and South America | Medium term (2-4 years) |
| Shift Toward Cloud Native Energy Intelligence Platforms | +2.4% | North America and EU, spill-over to APAC | Short term (≤ 2 years) |
| AI Enabled Load, Anomaly, and Benchmark Analytics Adoption | +2.1% | Global, with early gains in North America and Germany | Medium term (2-4 years) |
| Data Center Power Optimization and Sustainability Reporting Demand | +1.7% | North America, EU, APAC hyperscale hubs | Short term (≤ 2 years) |
| Digital Twin Based Software Energy Profiling in Large Enterprises | +1.3% | North America, EU, industrial China | Long term (≥ 4 years) |
| Source: Mordor Intelligence | |||
Rising Utility Cost Pressure and Energy Efficiency Mandates
Energy efficiency rules have shifted from policy targets to operational requirements, driving greater buyer urgency in the software energy consumption analytics market.[1]European Parliament and Council, “Directive (EU) 2023/1791 on Energy Efficiency (Recast),” EUR-Lex, eur-lex.europa.eu The recast EU Energy Efficiency Directive required member states to transpose its provisions into national law by October 2025, which tightened compliance timelines for large energy users. Article 11 requires enterprises that consume more than 85 TJ annually to implement ISO 50001-certified energy management systems, while those that consume more than 10 TJ must complete periodic energy audits. Those obligations make manual tracking across many sites difficult to maintain at audit-ready quality, which raises the value of automated monitoring, reporting, and record retention tools. Once these platforms are installed, energy reporting becomes a recurring workflow rather than a one-time exercise, which supports longer subscription cycles in the software energy consumption analytics market.
Rapid Smart Meter And IoT Telemetry Expansion
Smart meter and IoT rollouts are increasing the amount of consumption data that enterprises can capture and review across buildings, plants, and distributed sites. This matters for the software energy consumption analytics market because higher-frequency meter feeds support load profiling, anomaly detection, benchmarking, and device-level pattern recognition. The move beyond simple monthly billing records is changing buyer expectations, as users now want near-real-time visibility rather than static retrospective reports. That shift also raises the bar for software design, since vendors need better filtering, prioritization, and workflow tools so operators can act on the data without getting buried in alerts. The demand effect is strongest in large rollout markets across Asia-Pacific, where metering expansion is widening the future buyer base for the software energy consumption analytics market.
Shift Toward Cloud Native Energy Intelligence Platforms
Enterprise buyers are moving away from server-hosted tools and toward cloud-native platforms that update continuously and connect more easily with billing, meter, and sustainability data streams in the software energy consumption analytics market.[2]SAP, “SAP DER Enables the Energy Flexibility Market,” SAP News, news.sap.com This transition reduces the infrastructure burden for mid-sized customers, broadening the addressable market beyond the largest enterprises. It also fits the way IT teams now govern operational data, so procurement decisions increasingly follow the same logic used for other enterprise software platforms. SAP launched its Distributed Energy Resources solution on SAP Business Technology Platform in March 2026, and Schneider Electric introduced Resource Advisor+ in January 2026 with AI-enabled energy and sustainability functions delivered through a cloud model. Oracle reinforced this direction in April 2026 when it expanded its Utilities AI Data Platform with self-service machine learning within a cloud architecture, which strengthened the case for cloud delivery across the software energy consumption analytics market.
AI Enabled Load, Anomaly, and Benchmark Analytics Adoption
AI-based load forecasting, anomaly detection, and benchmarking are becoming standard expectations in the software energy consumption analytics market. The near-term value of these features is less about headline claims and more about reducing the staff time needed to review alerts, identify waste, and prioritize corrective actions. Spacewell addressed that issue in April 2026 by grouping anomalies by likely impact, which directly targeted alert fatigue in multi-site portfolios.[3]Spacewell, “What’s New in Spacewell Energy, Axis Scaling for Data Comparison and Detection of High Impact Anomalies,” Spacewell, spacewell.com Oracle added AI tools for load growth forecasting and meter data workflows in April 2026, while C3 AI expanded its work with Shell in June 2026 to deepen asset-level reliability analytics across a very large installed base. As vendors fold these functions into core products, legacy monitoring tools are facing shorter replacement cycles in the software energy consumption analytics market.
Restraints Impact Analysis*
| Restraint | (~) % Impact on CAGR Forecast | Geographic Relevance | Impact Timeline |
|---|---|---|---|
| Legacy IT and OT Integration Complexity | -1.8% | Global, with greatest friction in North America industrial and EU utilities | Medium term (2-4 years) |
| Weak Data Quality and Energy Baseline Standardization | -1.4% | APAC emerging markets, South America, Africa | Medium term (2-4 years) |
| Cybersecurity, Privacy, and Data Sovereignty Constraints | -1.1% | EU and North America regulated utilities, Middle East sovereign environments | Long term (≥ 4 years) |
| Specialized Implementation Talent Shortage | -0.8% | Global, most acute in APAC and South America | Short term (≤ 2 years) |
| Source: Mordor Intelligence | |||
Legacy IT and OT Integration Complexity
Legacy operational technology remains one of the clearest deployment barriers in the software energy consumption analytics market. Many industrial sites still run older control systems and proprietary protocols that were not designed for continuous connection with modern enterprise analytics layers. That raises project cost because buyers often need middleware, staged migration plans, and temporary parallel operations before they can trust live data feeds. The problem is even harder in regulated environments, where security reviews and operating approvals can add months to deployment timelines. Vendors that already connect to common historians and OT data stores enter these accounts with an advantage, but integration friction still slows adoption across the software energy consumption analytics market.[4]International Energy Agency, “Energy and AI,” IEA, iea.blob.core.windows.net
Weak Data Quality And Energy Baseline Standardization
Weak data quality and inconsistent baseline definitions slow time-to-value after deployment in the software energy consumption analytics market. Energy data often arrives through utility bills, interval meter files, SCADA exports, and building systems that use different units, time resolutions, and site boundaries. The IEA reported that organizations pursuing AI-driven energy optimization often cited weak data management and governance as a leading barrier to scaling beyond pilot programs. This fragmentation favors vendors that can normalize large volumes of multi-format inputs before more advanced analytics even begin. It also creates a durable competitive moat for platforms built on the breadth of ingestion and a disciplined approach to data preparation, rather than on analytics features alone.
*Our forecasts treat driver/restraint impacts as directional, not additive. The impact forecasts reflect baseline growth, mix effects, and variable interactions.
Segment Analysis
By Deployment Mode: Cloud Dominates, Hybrid Gains Momentum
Cloud-based deployment held a 66.74% share in 2025, giving it the leading position in the software energy consumption analytics market. This result reflects the wider move to software-as-a-service across enterprise operations. Cloud platforms handle large meter datasets more efficiently and support continuous updates without site-level infrastructure refreshes. They also simplify connections with IoT devices, billing systems, data warehouses, and sustainability reporting tools. That combination has made the cloud the default choice for buyers who want faster rollout and lower ownership costs.
Hybrid deployment is projected to grow at a 16.25% CAGR from 2026 to 2031, which makes it the fastest-growing mode in the software energy consumption analytics market. The appeal is strongest among organizations that want to keep sensitive OT data on-site while still using cloud AI and benchmarking services. Bidgely's UtilityAI Pro reflected this direction by enabling utilities to run custom AI models in their own cloud environments, including AWS, Snowflake, and Databricks, while still leveraging shared platform capabilities. On-premises tools are losing relative weight as vendors such as SAP and Oracle continue to favor cloud-native roadmaps with stronger analytics and AI layers.


By Component: Software Leads, Services Accelerate
Software accounted for 70.12% of the component mix in 2025, giving it the largest share in the software energy consumption analytics market. That outcome aligns with how vendors monetize the category through recurring licenses and platform subscriptions. Continuous data ingestion, model updates, and regulatory changes are easier to manage through software than through one-time project work. The lead also shows that buyers are prioritizing scalable systems of record before they expand service intensity. In the software energy consumption analytics industry, that bias keeps platform control at the center of vendor strategy.
Services are projected to grow at a 15.92% CAGR from 2026 to 2031 as more customers ask vendors to support deployment, analytics, and reporting workflows in the software energy consumption analytics market. This pattern is strongest where compliance programs force companies to combine technology rollout with operating changes across many facilities. Schneider Electric pushed this mix further in January 2026 when it launched Resource Advisor+ with the Sera AI agent, which blended software delivery with embedded energy expertise. The services opportunity should remain durable because skilled teams that understand both energy systems and data models are still limited across the software energy consumption analytics industry.
By Application: Visibility Foundation, Carbon Intelligence Ascends
Energy visibility and monitoring held a 28.63% share in 2025, making it the largest application in the software energy consumption analytics market. That leads matters because every higher-value use case depends on clean consumption data, dashboards, and site-level baselines. Without that base layer, forecasting, optimization, and carbon reporting lack reliable inputs at enterprise scale. The category also tends to renew well because buyers rarely remove the monitoring layer once it is linked to facilities, meters, and bills. This foundation effect keeps visibility tools central even as buyer expectations continue to widen.
Sustainability and carbon intelligence are projected to expand at a 16.78% CAGR from 2026 to 2031, which makes it the fastest-growing application in the software energy consumption analytics market. Buyers are placing more weight on this area as Scope 1-3 disclosure expectations and internal decarbonization targets move closer to day-to-day operating decisions. AWS launched its Sustainability Console in 2026 to support Scope 1-3 reporting at both the organization and site levels, demonstrating that granular emissions visibility is moving closer to core infrastructure workflows. Demand is also rising in data center and procurement settings where teams need stronger power tracking, better forecast accuracy, and more responsive electricity purchasing support.
By End-Use Industry: IT And Telecom Anchors, Retail Rises Fast
IT and telecom accounted for 26.41% of revenue in 2025, giving it the leading end-use position in the software energy consumption analytics market. That result reflects the energy intensity of hyperscale data centers and telecom networks. These operators also face direct pressure from investors, customers, and internal efficiency programs to document energy performance with more precision. As AI workloads grow, they are also among the first to refresh monitoring tools when analytics features improve. This makes the segment an anchor account base for both suite vendors and specialists in the software energy consumption analytics market.
Retail and e-commerce are projected to grow at a 15.89% CAGR from 2026 to 2031, making it the fastest-growing end-use segment in the software energy consumption analytics market. Multi-site retailers need consistent benchmarking across large store portfolios, and that scale is difficult to manage with manual review. GridPoint's installed base across more than 20,000 commercial buildings and cumulative customer energy savings of nearly USD 1.5 billion in March 2026 demonstrate how strong the commercial use case has become. Manufacturing, utilities, oil and gas, food and beverage, construction, government, and BFSI are broadening demand as they use analytics for load profiling, certification support, procurement decisions, and distributed asset oversight.
Geography Analysis
Europe held 34.56% of the software energy consumption analytics market share in 2025, making it the largest regional market. The region's lead came from binding energy efficiency targets, mandatory sustainability reporting, and a mature digital base that supports faster analytics adoption. The recast EED required member states to transpose its provisions by October 2025, which increased compliance pressure on large energy users through audit and management system obligations. Germany, the United Kingdom, France, and Italy formed the core demand cluster, with Germany standing out as EED-related requirements moved into national compliance practice. Buyers in this region are increasingly screening vendors for audit-ready reporting, disciplined GHG accounting, and support for ISO 50001 workflows.
North America remained the second-largest geography in the software energy consumption analytics market. The United States is the main innovation center, with vendors such as GridPoint, Bidgely, Uplight, Sense Labs, and EnergyCAP shaping many of the commercial and utility use cases seen across the software energy consumption analytics market. Oracle highlighted utilities such as Exelon and El Paso Electric in May 2026 for results driven by AI, cloud, and customer innovation, reflecting the depth of enterprise adoption in the region. Canada adds steady demand, while Mexico and parts of South America are emerging through industrial efficiency programs and cross-border deployments managed by larger regional groups.
Asia-Pacific is projected to grow at a 16.34% CAGR from 2026 to 2031, which makes it the fastest-growing geography in the software energy consumption analytics market. China and India are driving much of that expansion through decarbonization policies, smart meter rollouts, and large-enterprise digitization. Japan, South Korea, and Australia are also supporting demand through grid modernization, virtual power plant activity, and more granular electricity market operation. Wipro and Kongsberg Digital announced an April 2026 partnership to deliver AI-powered digital twin solutions for the energy and utilities sector, underscoring how quickly advanced analytics capabilities are spreading across the region. The Middle East and Africa remain earlier-stage markets, but sovereign energy programs in the Gulf and compliance-led demand in South Africa and Nigeria are gradually widening the future buyer base for the software energy consumption analytics market.

Competitive Landscape
The software energy consumption analytics market remained moderately fragmented in 2026, with no single company controlling the field. Competition is spread across enterprise suite vendors such as Oracle, SAP, IBM, Teradata, and SAS Institute, industrial and OT specialists such as Schneider Electric, AVEVA, Aspen Technology, and Bentley Systems, and pure-play platforms such as Bidgely, GridPoint, Uplight, EnergyCAP, Energyworx, Spacewell, Sense Labs, and Smarter Grid Solutions. Large incumbents usually compete by extending existing ERP, utility, or infrastructure software stacks with native energy modules. Specialists win when they offer faster integrations to meters, billing systems, cloud warehouses, and site data that buyers already use. This split keeps the software energy consumption analytics market open enough for challengers, even when the largest vendors carry stronger installed bases.
Oracle strengthened the suite-vendor playbook in April 2026 by expanding its Utilities AI Data Platform with self-service machine learning for load growth forecasting and GenAI support in asset workflows. SAP followed a similar path with its March 2026 Distributed Energy Resources launch and its May 2026 Sustainability AI Agents roadmap, which tied energy, operational, and emissions workflows more closely together. On the specialist side, C3 AI deepened its long-standing work with Shell in June 2026 and expanded reliability analytics beyond anomaly detection to AI-agent-based root-cause analysis across more than 13,000 assets. Palantir's 5-year strategic relationship with BP also showed that some vendors were competing for full operational visibility rather than for one isolated energy application.
A major opening remains in the mid-market, where companies now have smart meters and cloud access but still lack the internal teams needed to operationalize the data. Another opening sits between carbon intelligence and real-time operations, where buyers want live emissions accounting tied directly to moment-by-moment consumption decisions. AVEVA's March 2026 collaboration with NVIDIA pointed toward that direction by combining CONNECT, digital twin workflows, AVEVA PI System telemetry, and real-time anomaly detection for gigawatt-scale AI factory environments. The software energy consumption analytics market should therefore stay competitive and innovation-led, rather than consolidating quickly around a small group of dominant vendors.
Software Energy Consumption Analytics Industry Leaders
Oracle Corporation
International Business Machines Corporation
Schneider Electric SE
SAP SE
Siemens AG
- *Disclaimer: Major Players sorted in no particular order

Recent Industry Developments
- June 2026: C3 AI and Shell expanded their multi-year collaboration to scale reliability AI deployment across Shell's global asset operations, extending predictive maintenance capabilities beyond anomaly detection to include AI agent-based root cause analysis and remediation across a program monitoring more than 13,000 pieces of equipment. The expanded agreement runs on C3 AI Reliability and the C3 Agentic AI Platform deployed on Microsoft Azure, building on a program that delivered hundreds of millions of dollars in economic value since its inception in 2018.
- May 2026: SAP announced that new Sustainability AI Agents would be made generally available by end-2026, embedded within SAP Business Suite and designed to integrate procurement decisions, operational data, and GHG accounting into enterprise-wide autonomous decarbonization workflows, operating within defined governance and compliance parameters.
- May 2026: ETAP announced the release of ETAP 2026, a digital twin platform for continuous energy intelligence across the full electrical lifecycle, incorporating cloud-leveraging technologies and advanced power systems analytics engineered for high-regulation industrial and utility environments.
- April 2026: Wipro and Kongsberg Digital announced a strategic partnership to deploy next-generation AI-powered digital twin solutions for the energy and utilities sector, combining physics-based engineering models, real-time operations data, and enterprise AI into a unified operational environment with applications across plants, grids, and distributed assets.


Global Software Energy Consumption Analytics Market Report Scope
The Software Energy Consumption Analytics market refers to platforms and services that enable organizations to measure, monitor, and optimize the energy usage of applications, IT infrastructure, and digital workloads. These solutions provide functionalities such as energy visibility and monitoring, application-level energy optimization, cloud and data center efficiency management, forecasting and predictive analytics, and sustainability intelligence with carbon attribution.
The Software Energy Consumption Analytics market report is segmented by Deployment Mode (Cloud-Based, On-Premises, and Hybrid), Component (Software, and Services), Application (Energy Visibility and Monitoring, Application Energy Optimization, Cloud and Data Center Optimization, Forecasting and Predictive Analytics, and Sustainability and Carbon Intelligence), End-Use Industry (IT and Telecom, BFSI, Industrial Manufacturing, Energy and Utilities, Oil and Gas, Retail and E-Commerce, Food and Beverage Manufacturing, Construction and Infrastructure, Government and Public Sector, and Other End-User Industries), and Geography (North America, South America, Europe, Asia-Pacific, Middle East, and Africa). The Market Forecasts are Provided in Terms of Value (USD).
| Cloud Based |
| On Premises |
| Hybrid |
| Software |
| Services |
| Energy Visibility and Monitoring |
| Application Energy Optimization |
| Cloud and Data Center Optimization |
| Forecasting and Predictive Analytics |
| Sustainability and Carbon Intelligence |
| IT and Telecom |
| BFSI |
| Industrial Manufacturing |
| Energy and Utilities |
| Oil and Gas |
| Retail and E-Commerce |
| Food and Beverage Manufacturing |
| Construction and Infrastructure |
| Government and Public Sector |
| Other End-User Industries |
| North America | United States |
| Canada | |
| Mexico | |
| South America | Brazil |
| Rest of South America | |
| Europe | Germany |
| United Kingdom | |
| France | |
| Italy | |
| Spain | |
| Russia | |
| Rest of Europe | |
| Asia-Pacific | China |
| India | |
| Japan | |
| South Korea | |
| Australia | |
| Rest of Asia-Pacific | |
| Middle East | Turkey |
| Saudi Arabia | |
| United Arab Emirates | |
| Rest of Middle East | |
| Africa | South Africa |
| Nigeria | |
| Rest of Africa |
| By Deployment Mode | Cloud Based | |
| On Premises | ||
| Hybrid | ||
| By Component | Software | |
| Services | ||
| By Application | Energy Visibility and Monitoring | |
| Application Energy Optimization | ||
| Cloud and Data Center Optimization | ||
| Forecasting and Predictive Analytics | ||
| Sustainability and Carbon Intelligence | ||
| By End-Use Industry | IT and Telecom | |
| BFSI | ||
| Industrial Manufacturing | ||
| Energy and Utilities | ||
| Oil and Gas | ||
| Retail and E-Commerce | ||
| Food and Beverage Manufacturing | ||
| Construction and Infrastructure | ||
| Government and Public Sector | ||
| Other End-User Industries | ||
| By Geography | North America | United States |
| Canada | ||
| Mexico | ||
| South America | Brazil | |
| Rest of South America | ||
| Europe | Germany | |
| United Kingdom | ||
| France | ||
| Italy | ||
| Spain | ||
| Russia | ||
| Rest of Europe | ||
| Asia-Pacific | China | |
| India | ||
| Japan | ||
| South Korea | ||
| Australia | ||
| Rest of Asia-Pacific | ||
| Middle East | Turkey | |
| Saudi Arabia | ||
| United Arab Emirates | ||
| Rest of Middle East | ||
| Africa | South Africa | |
| Nigeria | ||
| Rest of Africa | ||


Key Questions Answered in the Report
What is the current size of the software energy consumption analytics market?
The software energy consumption analytics market stood at USD 0.98 billion in 2025 and is forecast to reach USD 2.30 billion by 2031 at a 15.48% CAGR from 2026 to 2031.
Which region leads software energy consumption analytics adoption?
Europe led in 2025 with 34.56% share, supported by compliance requirements under the recast EU Energy Efficiency Directive and strong enterprise reporting needs.
Which deployment model is most widely used for energy analytics software?
Cloud-based deployment led with 66.74% share in 2025 because it supports easier integration, continuous updates, and lower infrastructure burden.
What is the fastest-growing application area in this field?
Sustainability and carbon intelligence is the fastest-growing application, with a projected 16.78% CAGR from 2026 to 2031 as disclosure expectations and decarbonization workflows become more operational.
Which end-use sector generates the most demand?
IT and telecom held the largest revenue share at 26.41% in 2025 because data centers and telecom networks face high energy intensity and tighter reporting pressure.
Why are retailers adopting these platforms more quickly?
Retail and e-commerce is projected to grow at a 15.89% CAGR through 2031 because multi-site operators need portfolio-wide benchmarking and manual analysis does not scale across hundreds of locations.
Page last updated on:


