Real-Time Grid Carbon Intensity Software Market Size and Share
Market Overview
| Study Period | 2020 - 2031 |
|---|---|
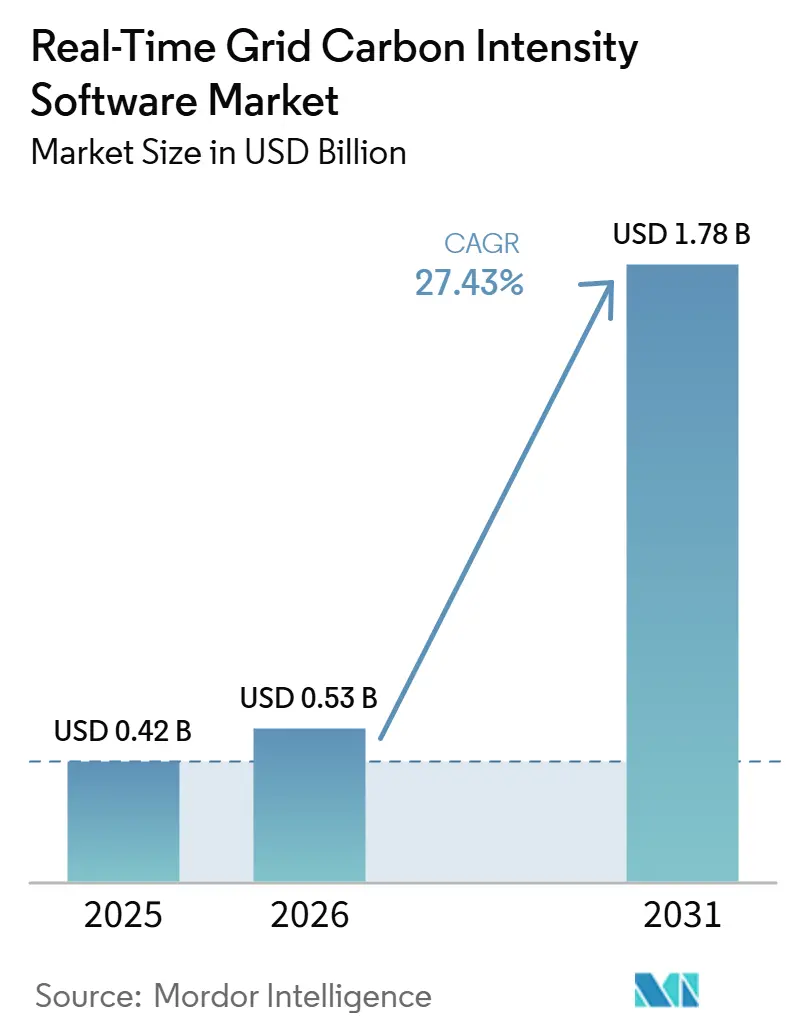
| Market Size (2026) | USD 0.53 Billion |
| Market Size (2031) | USD 1.78 Billion |
| Growth Rate (2026 - 2031) | 27.43% CAGR |
| Fastest Growing Market | Asia-Pacific |
| Largest Market | North America |
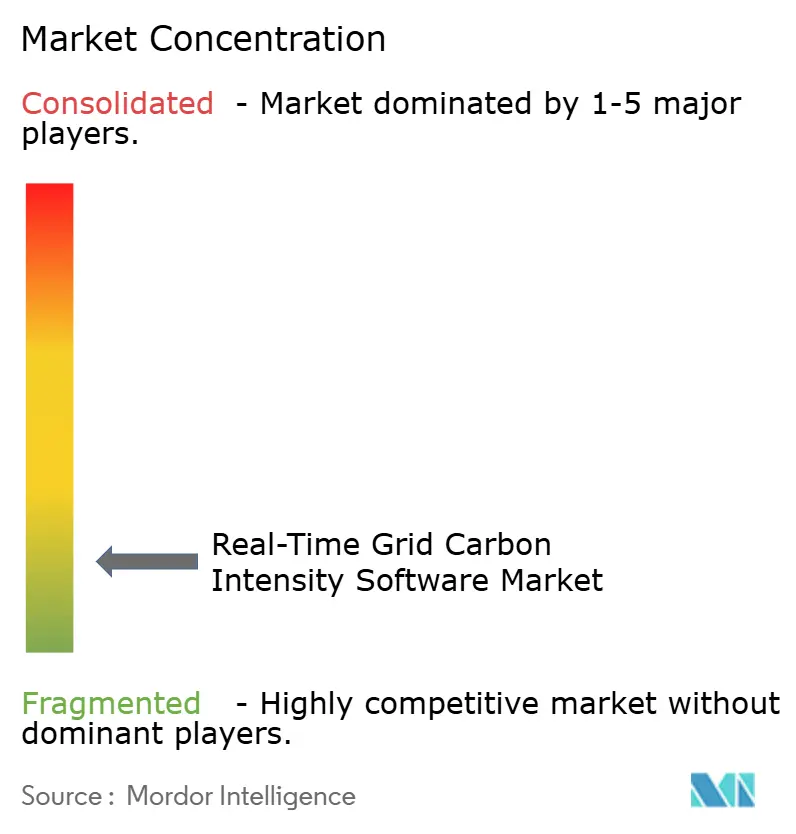
| Market Concentration | Low |
Major Players *Disclaimer: Major Players sorted in no particular order Image © Mordor Intelligence. Reuse requires attribution under CC BY 4.0. | |
Real-Time Grid Carbon Intensity Software Market Analysis by Mordor Intelligence
The real-time grid carbon intensity software market size is projected to expand from USD 0.42 billion in 2025 and USD 0.53 billion in 2026 to USD 1.78 billion by 2031, registering a CAGR of 27.43% between 2026 to 2031. The real-time grid carbon intensity software market is growing because enterprises no longer treat grid carbon data as a once-a-year reporting input and now use it as a live operating signal across cloud workloads, energy procurement, and compliance records. The real-time grid carbon intensity software market is also benefiting from the move toward hourly and location-specific Scope 2 accounting, which raises the value of software that can capture, calculate, store, and explain emissions data in a persistent way. The spread of API-ready grid data infrastructure across North America, Europe, and Asia-Pacific has made the real-time grid carbon intensity software market more scalable because enterprises can now embed carbon signals into standard systems instead of relying on manual lookups. Competition in the real-time grid carbon intensity software market is shifting away from raw data coverage alone and toward forecast quality, methodology translation, and integration with ERP, sustainability, and developer environments. This means the most durable opportunities in the real-time grid carbon intensity software market sit above the raw signal layer, especially where vendors can create switching costs through workflow integration, audit readiness, and decision support.
Key Report Takeaways
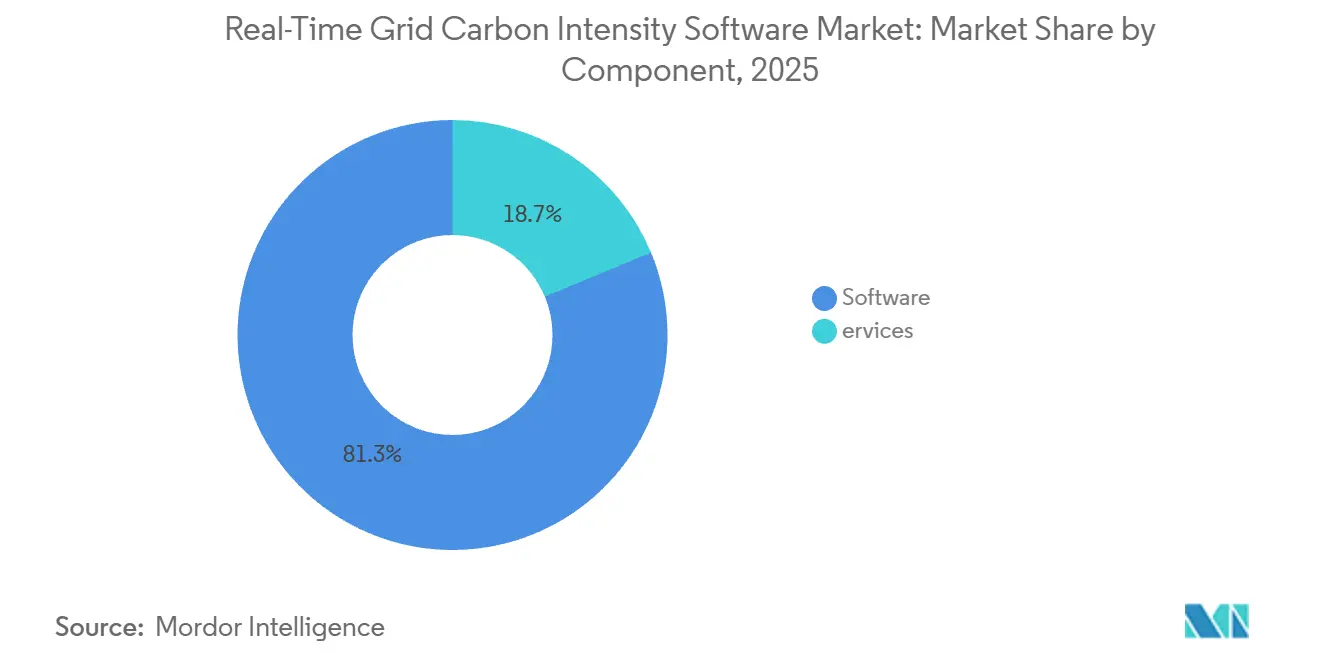
- By component, software accounted for 81.26% of the real-time grid carbon intensity software market size in 2025, while services is projected to expand at a 31.08% CAGR through 2031.
- By deployment mode, cloud held 62.41% of the real-time grid carbon intensity software market size in 2025, while hybrid is projected to grow at a 32.47% CAGR through 2031.
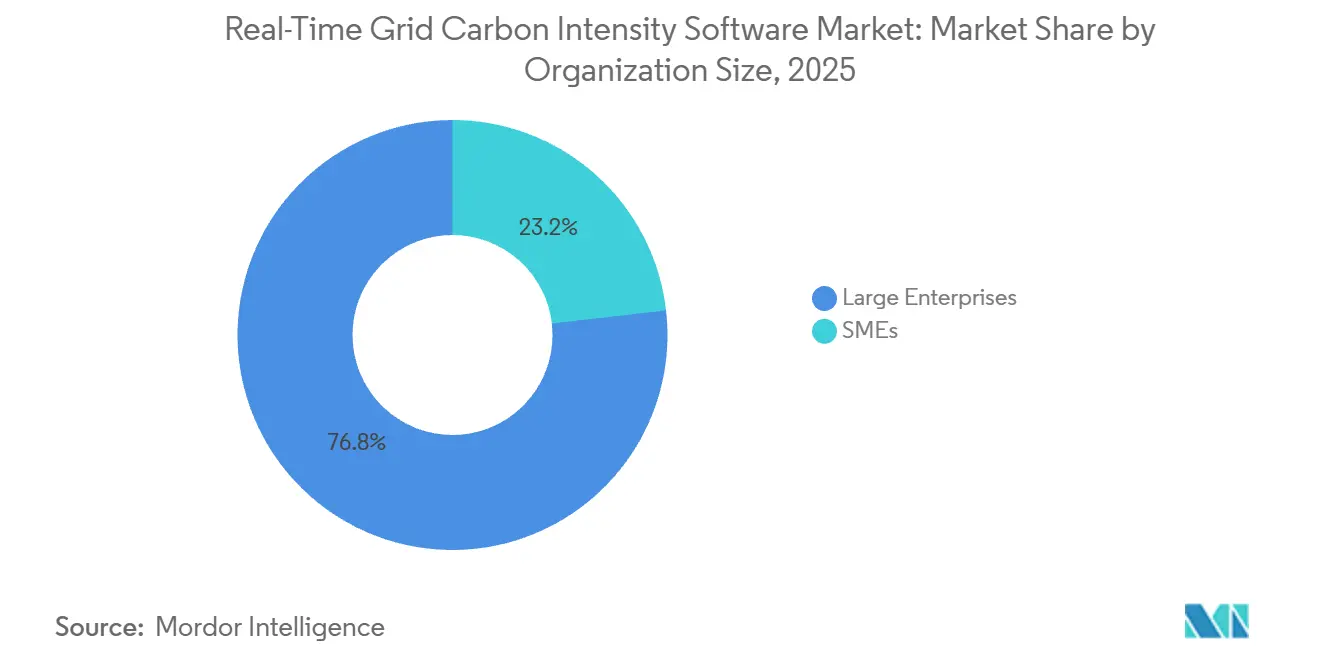
- By organization size, large enterprises held 76.83% of the real-time grid carbon intensity software market share in 2025, while SMEs are projected to advance at a 29.86% CAGR through 2031.
- By end-user industry, IT and telecom led with a 29.34% revenue share in 2025, while energy and utilities is projected to expand at a 31.74% CAGR through 2031.
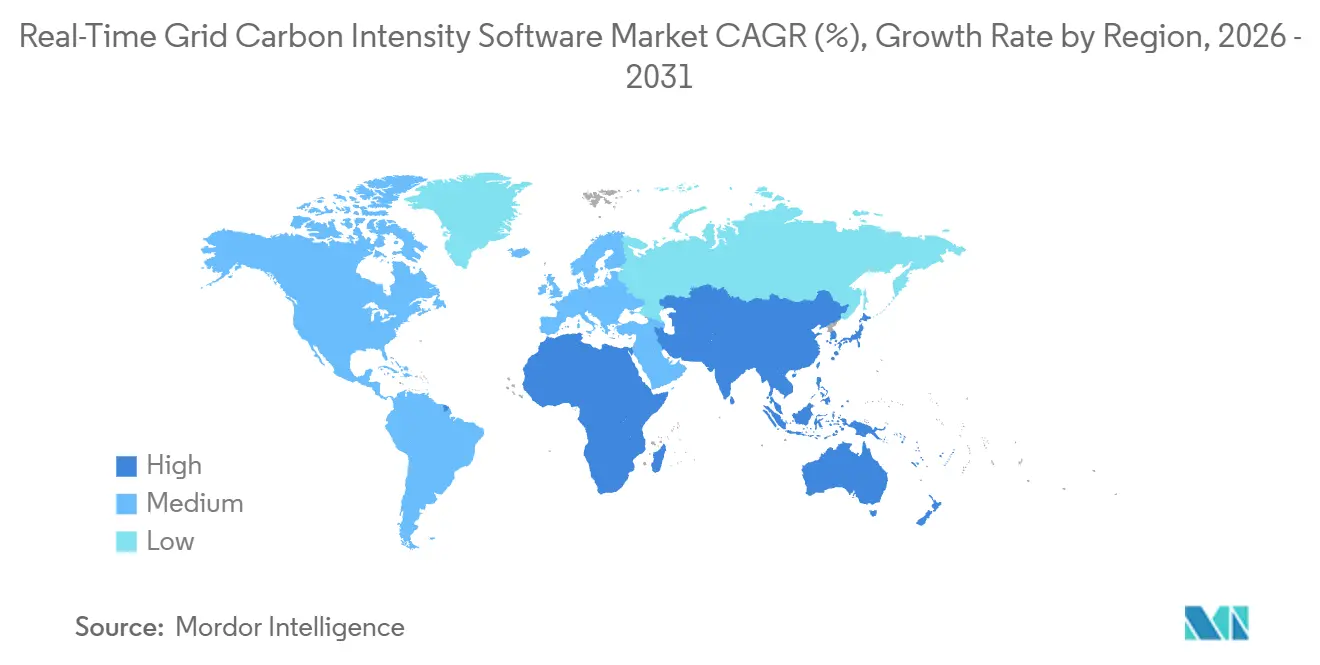
- By geography, North America held 41.28% share of the real-time grid carbon intensity software market in 2025, while Asia-Pacific is projected to grow at a 30.52% CAGR through 2031.
Note: Market size and forecast figures in this report are generated using Mordor Intelligence’s proprietary estimation framework, updated with the latest available data and insights as of January 2026.
Global Real-Time Grid Carbon Intensity Software Market Trends and Insights
Drivers Impact Analysis*
| Driver | (~) % Impact on CAGR Forecast | Geographic Relevance | Impact Timeline |
|---|---|---|---|
| Rising Demand for Hourly Scope 2 Auditability | +6.5% | Global, with concentration in North America and EU | Short term (≤ 2 years) |
| Expansion of Carbon-Aware Cloud and AI Workloads | +5.8% | Global, North America and Asia-Pacific core | Short term (≤ 2 years) |
| Grid Data APIs Becoming Enterprise Infrastructure Primitives | +5.0% | Global | Medium term (2-4 years) |
| Tightening Rules for Machine-Readable Emissions Disclosure | +4.3% | EU core, spill-over to North America and Asia-Pacific | Short term (≤ 2 years) |
| Growth of 24/7 Carbon-Free Energy Procurement | +3.2% | North America, EU, Asia-Pacific | Medium term (2-4 years) |
| Higher Accuracy Requirements for Location-Based Emissions Accounting | +2.6% | Global | Medium term (2-4 years) |
| Source: Mordor Intelligence | |||
Rising Demand for Hourly Scope 2 Auditability
The real-time grid carbon intensity software market is gaining momentum because hourly Scope 2 accounting is turning carbon data retention into a formal control function rather than a reporting convenience. The GHG Protocol’s December 2024 development plan proposed hourly matching and deliverability as core elements of the next Scope 2 revision, which raised expectations for continuous records tied to the timing and location of electricity use.[1]GHG Protocol, “Scope 2 Standard Development Plan,” GHG Protocol, ghgprotocol.org That change matters because enterprises need a persistent log of local grid intensity at the moment of consumption, and that requirement fits software platforms better than static factors or periodic spreadsheets. The real-time grid carbon intensity software market also benefits because hourly auditability reaches beyond the first wave of regulated filers and starts to shape supplier requests, assurance work, and internal controls. WattTime and REsurety’s March 2025 launch of an open hourly marginal emissions platform showed that auditors, academics, regulators, and smaller climate actors are already consuming this kind of data, which supports broader normalization of sub-hourly evidence standards.
Expansion of Carbon-Aware Cloud and AI Workloads
The real-time grid carbon intensity software market is also being lifted by the spread of carbon-aware computing across cloud operations, data workloads, and energy-intensive digital infrastructure. As organizations try to align workload timing with cleaner grid conditions, the value of software rises when it can provide live carbon signals at the point where scheduling and operating decisions are made. This gives the real-time grid carbon intensity software market a direct link to enterprise cloud administration, because the carbon signal becomes useful only when it can be consumed inside software tools that teams already use every day. AWS reinforced that direction in March 2026 when it launched the AWS Sustainability Console with programmatic Scope 1, 2, and 3 reporting by region and service using both location-based and market-based methods. The practical result is that specialist signal providers and enterprise platforms are becoming more interdependent, because cloud sustainability interfaces expand distribution for high-quality grid carbon data instead of removing the need for it.
Grid Data APIs Becoming Enterprise Infrastructure Primitives
The real-time grid carbon intensity software market is moving into a phase where grid carbon data APIs are treated less like specialty tools and more like standard enterprise infrastructure. This shift matters because once carbon signals sit inside ERP systems, developer pipelines, energy platforms, and reporting tools, changing providers becomes harder, and the commercial value moves toward reliability and interoperability. Vendors that can expose clean, machine-readable data through low-friction APIs are therefore better placed in the real-time grid carbon intensity software market than vendors that depend on manual workflows or one-off integration work. AWS’s 2026 console release and WattTime’s continuing API expansion both support this pattern, because they show that buyers expect carbon data to be accessible in programmatic form inside normal operating environments. As that expectation spreads, the real-time grid carbon intensity software market should continue to favor vendors that pair broad API availability with documented methodology and dependable refresh cycles.
Tightening Rules for Machine-Readable Emissions Disclosure
The real-time grid carbon intensity software market is also advancing because machine-readable emissions disclosure rules are pushing companies toward more timely and more defensible electricity emissions records. The Global Renewables Alliance linked this shift to frameworks and market changes that support granular carbon accounting, including the spread of hourly transparency requirements and new market structures across major regions. In practice, that makes the real-time grid carbon intensity software market more attractive to manufacturers, cloud operators, and energy buyers who need a clear provenance chain behind each emissions figure used in disclosures or supply chain documentation. India’s move to 15-minute settlement intervals under the National Electricity Policy 2026 is one example of how grid data structures are becoming more compatible with granular carbon accounting in fast-growing markets. The real-time grid carbon intensity software market gains from this because software can preserve data lineage, methodology mapping, and audit trails in ways that simple data feeds cannot.
Restraints Impact Analysis*
| Restraint | (~) % Impact on CAGR Forecast | Geographic Relevance | Impact Timeline |
|---|---|---|---|
| Sparse or Delayed Grid Telemetry in Some Regions | -2.8% | MEA and South America core, spill-over to parts of Asia-Pacific | Long term (≥ 4 years) |
| Integration Friction Across DevOps, FinOps, and EHS Stacks | -2.2% | Global, most acute in North America and EU | Medium term (2-4 years) |
| Methodology Disputes Between Average and Marginal Emissions | -1.6% | Global | Long term (≥ 4 years) |
| Security and Confidentiality Limits on Utility Data Sharing | -1.1% | EU and regulated markets | Medium term (2-4 years) |
| Source: Mordor Intelligence | |||
Sparse Or Delayed Grid Telemetry in Some Regions
The real-time grid carbon intensity software market still faces a structural ceiling in regions where underlying grid telemetry is sparse, delayed, or inconsistent. WattTime’s October 2024 global expansion to 210 countries and territories showed how broad geographic coverage often depends on mixed data environments rather than uniformly robust real-time reporting.[2]WattTime, “WattTime Expands Marginal Emissions Dataset Globally to Cover Nearly 100% of World’s Electricity Consumption,” WattTime, watttime.org That creates a quality gap inside the real-time grid carbon intensity software market, because buyers in mature regions can often work with higher-precision signals than buyers in parts of Africa, South Asia, and South America. The Global Renewables Alliance also pointed to the scale of grid modernization still needed worldwide, which helps explain why telemetry quality remains uneven across many high-growth power systems. Until more markets improve direct reporting, vendors in the real-time grid carbon intensity software market will continue to balance statistical estimation with rising enterprise demands for verifiable, time-specific data.
Integration Friction Across DevOps, FinOps, and EHS Stacks
The real-time grid carbon intensity software market is also constrained by the fact that carbon signal data has to move across technical, financial, and compliance teams that often use different systems and work to different timelines. A signal can be accurate and timely, but it still loses value if it cannot flow cleanly from workload operations into cost attribution and then into disclosure records. This slows deployment in the real-time grid carbon intensity software market, especially when companies want one auditable methodology to serve both optimization and reporting use cases. The need to reconcile hourly matching concepts from the GHG Protocol with enterprise-grade control environments makes integration discipline more important than many buyers first expect. The restraint is significant because vendors have to solve for governance, data lineage, and workflow fit at the same time, not just for signal delivery.
*Our forecasts treat driver/restraint impacts as directional, not additive. The impact forecasts reflect baseline growth, mix effects, and variable interactions.
Segment Analysis
By Component: Software Layer Anchors Enterprise Carbon Stacks
Software held 81.26% share of revenue in 2025, which made it the largest component in the real-time grid carbon intensity software market. That lead reflected buyer preference for platforms that can ingest live grid signals, calculate emissions, preserve data lineage, and produce disclosure-ready output in one environment rather than across disconnected tools. The software layer becomes more valuable as carbon accounting shifts toward time-specific and location-specific records, because those records need consistent methods and continuous storage instead of periodic updates. The GHG Protocol’s proposed move toward hourly matching supports that direction, since it favors tools that can document timing, deliverability, and methodology choices in a persistent way. In the real-time grid carbon intensity software industry, this means core product differentiation is moving toward documented calculation logic, audit support, and integration depth rather than simple dashboard visibility.
Services is the smaller component, but it is projected to expand at a 31.08% CAGR through 2031, which makes it the fastest-growing sub-segment in this dimension. Growth in services follows the same pattern seen across the real-time grid carbon intensity software market, where clients increasingly need help with implementation, method mapping, and cross-functional operating design. The service requirement becomes stronger when companies try to connect hourly Scope 2 data with supplier engagement, Energy Attribute Certificates, and broader decarbonization planning. The September 2025 collaboration among Flexidao, ACT, and Green Project Technologies showed how software, certificate delivery, and supplier engagement can be packaged into one decarbonization workflow for corporate value chains. As the real-time grid carbon intensity software market matures, services should remain important wherever enterprises need to operationalize granular data without breaking audit continuity.


By Deployment Mode: Cloud Leads as Hybrid Infrastructure Gains Ground
Cloud retained a 62.41% share in 2025, giving it the leading deployment position in the real-time grid carbon intensity software market. That result was logical because most real-time signal ingestion, workload monitoring, and sustainability analytics already happen in cloud-connected environments. Cloud deployment also fits the operating model of the real-time grid carbon intensity software market, since live emissions signals are most useful when they sit close to the applications and compute workloads they are meant to inform. AWS’s Sustainability Console strengthened this model by placing programmatic emissions reporting inside normal cloud administration workflows, with visibility by region and service.[3]Amazon Web Services, “Announcing the AWS Sustainability Console, Programmatic Access, Configurable CSV Reports, and Scope 1-3 Reporting in One Place,” AWS News Blog, aws.amazon.com Even so, on-premises systems continue to matter in regulated settings where internal control, local storage, and restricted data processing remain part of enterprise policy.
Hybrid deployment is projected to grow at a 32.47% CAGR through 2031, which makes it the fastest-growing mode in this segment of the real-time grid carbon intensity software market. The appeal of hybrid architecture comes from a practical split, with cloud services handling signal ingestion and analytics while local environments retain compliance records and sensitive internal data. This layout matches the needs of enterprises that want sub-hourly visibility without giving up control over archiving, governance, or retention rules. Flexidao’s work with Google to convert 10.5 TWh of energy purchases across 7 countries into hourly certificates under the EnergyTag Granular Certificate Scheme Standard showed how data can move across cloud APIs, analytical tools, and compliance systems in a coordinated model. As a result, hybrid deployment is likely to stay one of the clearest structural opportunities within the real-time grid carbon intensity software market over the forecast period.
By Organization Size: Large Enterprises Anchor Demand as SMEs Accelerate
Large enterprises commanded a 76.83% share of revenue, giving them a clear lead in the real-time grid carbon intensity software market. Their early lead came from having dedicated sustainability teams, larger integration budgets, and broader incentives to connect emissions data across regions, business units, and reporting cycles. Large organizations also face stronger pressure to maintain method consistency across procurement, disclosure, and workload operations, which supports spending on enterprise-grade carbon intelligence platforms. In the real-time grid carbon intensity software industry, those buyers often set the functional standard for the rest of the value chain because supplier requirements tend to follow large-enterprise operating models. That is why the real-time grid carbon intensity software market remains anchored by multinational users that can justify deep integration and long implementation programs.
SMEs are projected to expand at a 29.86% CAGR through 2031, which makes them the fastest-growing organization size segment in the real-time grid carbon intensity software market. Their growth is being driven less by internal ambition alone and more by regulatory and commercial cascade from larger customers that now ask suppliers for better electricity emissions records. Once large enterprises start applying granular Scope 2 and Scope 3 expectations through procurement channels, smaller firms need software that can capture cleaner data without a large sustainability engineering team. The real-time grid carbon intensity software market is becoming more accessible to these firms because API-based delivery lowers upfront integration effort and makes adoption more modular. Over time, this should widen the user base, even though SMEs will still depend on products that simplify data handling and reduce the burden of method interpretation.
By End-User Industry: IT And Telecom Lead as Energy and Utilities Sprints
IT and telecom held 29.34% share in 2025, which made it the largest end-user segment in the real-time grid carbon intensity software market. This leadership reflects the fact that cloud operators and digital infrastructure providers were among the first to treat grid carbon intensity as a live operating variable instead of a back-office disclosure input. Their need is practical, since emissions signals can affect workload scheduling, energy matching, customer reporting, and the credibility of broader clean energy commitments. AWS’s March 2026 rollout of a programmatic sustainability console reinforced the link between cloud administration and granular emissions visibility inside enterprise environments. The real-time grid carbon intensity software market therefore remains closely tied to the digital infrastructure stack, where adoption can scale quickly once carbon data becomes part of standard operational tooling.
Energy and utilities is projected to grow at a 31.74% CAGR through 2031, which makes it the fastest-growing end-user segment in the real-time grid carbon intensity software market. This growth comes from the sector’s dual position, since utilities are both upstream sources of grid data and downstream users of carbon tracking software. Utilities increasingly need software to support green tariff credibility, customer reporting, and compliance with more granular market and dispatch structures. The Global Renewables Alliance highlighted how 24-7 carbon-free energy procurement, hourly transparency, and market reforms are reshaping the way electricity attributes are measured and used across power systems. That creates a strong runway for the real-time grid carbon intensity software market, especially where utilities can turn verified carbon data into a customer-facing service rather than a hidden back-end function.
Geography Analysis
North America held 41.28% share in 2025, which gave it the largest regional position in the real-time grid carbon intensity software market size in 2025. The region’s lead reflects dense cloud infrastructure, early interest in sub-hourly carbon accounting, and broad enterprise willingness to embed emissions data into software environments. AWS added momentum in March 2026 by launching a standalone sustainability console with region-level and service-level emissions reporting through an open API, which made programmatic carbon visibility more accessible to enterprise cloud users. South America remains smaller, but it is gaining relevance as exporters and corporate power buyers place greater value on time-accurate electricity emissions records. The Global Renewables Alliance noted that corporate procurement of off-site power purchase agreements reached 63.3 GW in 2025, and that broader move supports interest in hourly certificates and granular carbon accounting across regions with active renewable portfolios.
Europe is the second-largest region in the real-time grid carbon intensity software market and remains the clearest regulatory shaping force for granular electricity emissions accounting. Germany’s grid carbon intensity fell from 456 g CO2e/kWh in 2023 to 425 g CO2e/kWh in 2024, with a preliminary 2025 figure of 416 g CO2e/kWh, which showed that average decarbonization does not remove the need for time-sensitive tracking.[4]Institut für Energie- und Umweltforschung Heidelberg, “Belastung Des Klimas Durch Den Deutschen Strommix Rückläufig,” ifeu, ifeu.de In February 2025, 50Hertz and TenneT, working with FfE, launched the Green Grid Compass to provide hourly CO2 intensity and renewable share data across European bidding zones with independently audited methodology. That combination of regulatory pressure, open reference infrastructure, and audited methods gives Europe a strong influence on how products in the real-time grid carbon intensity software market are designed.
Asia-Pacific is projected to advance at a 30.52% CAGR through 2031, which makes it the fastest-growing geography in the real-time grid carbon intensity software market. The region is expanding quickly because corporate clean energy commitments are rising at the same time that grid data systems are becoming more granular and more usable. The Global Renewables Alliance reported that the UN 24-7 Carbon-Free Energy Compact added 20 new Asia-Pacific signatories between 2024 and 2025 and that 88% of new RE100 members in 2025 came from Asia-Pacific, which indicates strong momentum in procurement behavior. The same report pointed to India’s 15-minute settlement intervals and China’s unified electricity trading market as structural enablers for more granular data use. Japan adds another layer of maturity because its transmission system operators published hourly emission factors for FY2024, which created a usable public reference set for location-based accounting. The Middle East is still at an early stage, and Africa remains constrained by telemetry gaps, but both regions could become more relevant where exporters and large industrial users face stricter carbon documentation demands.

Competitive Landscape
The real-time grid carbon intensity software market is fragmented and split across several layers of competition rather than controlled by a single dominant vendor. One layer includes purpose-built signal specialists such as WattTime, Electricity Maps, Singularity Energy, and Climatiq, while another includes broader enterprise platforms such as AWS, Google, SAP, IBM, Microsoft, and Schneider Electric. This structure means the real-time grid carbon intensity software market competes on different terms depending on the customer problem, with some buyers prioritizing raw signal quality and others prioritizing audit workflow, ERP fit, or cloud integration. No vendor appears to hold a dominant global position at the signal-provider level, which keeps competitive pressure high and leaves room for regional or use-case specialization. WattTime’s expansion to nearly full global electricity coverage and its open emissions platform with REsurety show how data breadth and public access can strengthen positioning, but those advantages do not remove the need for strong integration and method controls.
A second competitive axis in the real-time grid carbon intensity software market is the degree to which vendors can turn carbon data into usable enterprise infrastructure. AWS made a strategic move in March 2026 when it launched a standalone sustainability console with open API access, which placed emissions reporting deeper inside standard cloud administration and widened the distribution path for granular carbon intelligence. Flexidao made a different but equally important move by supporting Google’s conversion of 10.5 TWh of energy purchases into hourly certificates across 7 countries, which showed that standards-aligned execution can become a powerful entry barrier in carbon-aware procurement.[5]Flexidao, “Flexidao Supports Google in Converting Global Portfolio of Energy Purchases into Hourly Certificates,” Flexidao, flexidao.com These examples suggest that the real-time grid carbon intensity software market rewards vendors that can connect data quality with verified operational outcomes.
A third axis is methodology trust, because customers in the real-time grid carbon intensity software market need systems that can explain how figures were produced and how they align with evolving accounting rules. The GHG Protocol’s ongoing Scope 2 revision keeps this issue active, since buyers want software that will remain usable as hourly matching and deliverability concepts mature. Europe’s Green Grid Compass also matters here because independently audited public infrastructure can raise the baseline expectation for transparency and comparability across vendors. Over the forecast period, the strongest positions in the real-time grid carbon intensity software market are likely to remain with vendors that combine high-quality signal access, standards-aware methodology, and low-friction integration into the systems enterprises already trust.
Real-Time Grid Carbon Intensity Software Industry Leaders
Electricity Maps
WattTime
Singularity Energy
REsurety, Inc.
Schneider Electric SE
- *Disclaimer: Major Players sorted in no particular order

Recent Industry Developments
- March 2026: AWS launched the AWS Sustainability Console, a standalone service providing programmatic Scope 1-3 emissions reporting by AWS region and service using both location-based and market-based methods via an open API. It replaced the legacy Customer Carbon Footprint Tool, deprecated on June 30, 2026.
- March 2026: WattTime released its updated North America data model, retrained on 2021-2024 grid data reflecting a 27% decrease in coal and 18% increase in natural gas generation. The update improved CO2 reduction opportunity for users by 25% and enhanced forecast precision through an improved ML pipeline and weather inputs.
- September 2025: Flexidao, ACT, and Green Project Technologies announced an integrated supply chain decarbonization solution combining Flexidao’s clean energy intelligence software, ACT’s Energy Attribute Certificate products, and GPT’s supplier engagement platform. The offering was designed to deliver closed-loop Scope 2 and 3 emissions reduction across corporate value chains.
- March 2025: REsurety and WattTime jointly launched Grid Emissions Data, a free global platform providing hourly marginal electricity emissions data for the prior 3 calendar years at node and sub-regional resolution. The platform addressed demand from auditors, regulators, and smaller climate actors for open-access reference data.


Global Real-Time Grid Carbon Intensity Software Market Report Scope
The real-time grid carbon intensity software market comprises software platforms that collect, process, forecast, and deliver real-time and predictive electricity grid carbon intensity data to enable organizations to make carbon-aware operational decisions. These solutions aggregate data from utilities, independent system operators (ISOs), transmission system operators (TSOs), renewable energy sources, and carbon data providers to provide accurate, location-specific, and time-sensitive emissions insights. By integrating real-time grid carbon intensity information with enterprise applications, cloud platforms, and operational systems, the software enables organizations to optimize energy consumption, reduce Scope 2 greenhouse gas (GHG) emissions, improve sustainability performance, and support regulatory compliance.
The Real-Time Grid Carbon Intensity Software Market Report is Segmented by Component (Software, and Services), Deployment Mode (Cloud, On-Premises, and Hybrid), Organization Size (Large Enterprises, and SMEs), End-User Industry (IT and Telecom, Retail and Ecommerce, Industrial Manufacturing, Energy and Utilities, BFSI, Media and Entertainment, Healthcare and Lifesciences, Government and Public Administration, and Other End-User Industries), and Geography (North America, South America, Europe, Asia-Pacific, Middle East, and Africa). The Market Forecasts are Provided in Terms of Value (USD).
| Software |
| Services |
| Cloud |
| On-Premises |
| Hybrid |
| Large Enterprises |
| SMEs |
| IT and Telecom |
| Retail and Ecommerce |
| Industrial Manufacturing |
| Energy and Utilities |
| BFSI |
| Media and Entertainment |
| Healthcare and Lifesciences |
| Government and Public Administration |
| Other End-User Industries |
| North America | United States |
| Canada | |
| Mexico | |
| South America | Brazil |
| Argentina | |
| Rest of South America | |
| Europe | Germany |
| United Kingdom | |
| France | |
| Spain | |
| Italy | |
| Russia | |
| Rest of Europe | |
| Asia-Pacific | China |
| India | |
| Japan | |
| South Korea | |
| Australia and New Zealand | |
| Rest of Asia-Pacific | |
| Middle East | Saudi Arabia |
| United Arab Emirates | |
| Turkey | |
| Rest of Middle East | |
| Africa | South Africa |
| Nigeria | |
| Egypt | |
| Rest of Africa |
| By Component | Software | |
| Services | ||
| By Deployment Mode | Cloud | |
| On-Premises | ||
| Hybrid | ||
| By Organization Size | Large Enterprises | |
| SMEs | ||
| By End-User Industry | IT and Telecom | |
| Retail and Ecommerce | ||
| Industrial Manufacturing | ||
| Energy and Utilities | ||
| BFSI | ||
| Media and Entertainment | ||
| Healthcare and Lifesciences | ||
| Government and Public Administration | ||
| Other End-User Industries | ||
| By Geography | North America | United States |
| Canada | ||
| Mexico | ||
| South America | Brazil | |
| Argentina | ||
| Rest of South America | ||
| Europe | Germany | |
| United Kingdom | ||
| France | ||
| Spain | ||
| Italy | ||
| Russia | ||
| Rest of Europe | ||
| Asia-Pacific | China | |
| India | ||
| Japan | ||
| South Korea | ||
| Australia and New Zealand | ||
| Rest of Asia-Pacific | ||
| Middle East | Saudi Arabia | |
| United Arab Emirates | ||
| Turkey | ||
| Rest of Middle East | ||
| Africa | South Africa | |
| Nigeria | ||
| Egypt | ||
| Rest of Africa | ||


Key Questions Answered in the Report
What is the current and forecast value of real-time grid carbon intensity software?
The sector stood at USD 0.53 billion in 2026 and is forecast to reach USD 1.78 billion by 2031, growing at a 27.43% CAGR.
Which component leads revenue generation in this space?
Software led with 81.26% share in 2025 because buyers preferred integrated platforms for signal ingestion, emissions calculation, and audit-ready output.
Which deployment model is growing the fastest?
Hybrid is the fastest-growing deployment mode with a 32.47% CAGR through 2031, driven by the need to combine cloud analytics with local record retention.
Which customer group accounts for most spending?
Large enterprises led with 76.83% share in 2025 because they had stronger budgets, dedicated sustainability teams, and more complex reporting requirements.
Which end-user segment offers the strongest growth outlook?
Energy and utilities is projected to expand at a 31.74% CAGR through 2031 as utilities become both data providers and users of granular carbon intelligence.
Which region is likely to expand the fastest through 2031?
Asia-Pacific is expected to post the fastest regional growth at a 30.52% CAGR, supported by stronger corporate clean energy commitments and more granular grid data structures.
Page last updated on:


