Home Energy Management Market Size and Share
Market Overview
| Study Period | 2020 - 2031 |
|---|---|
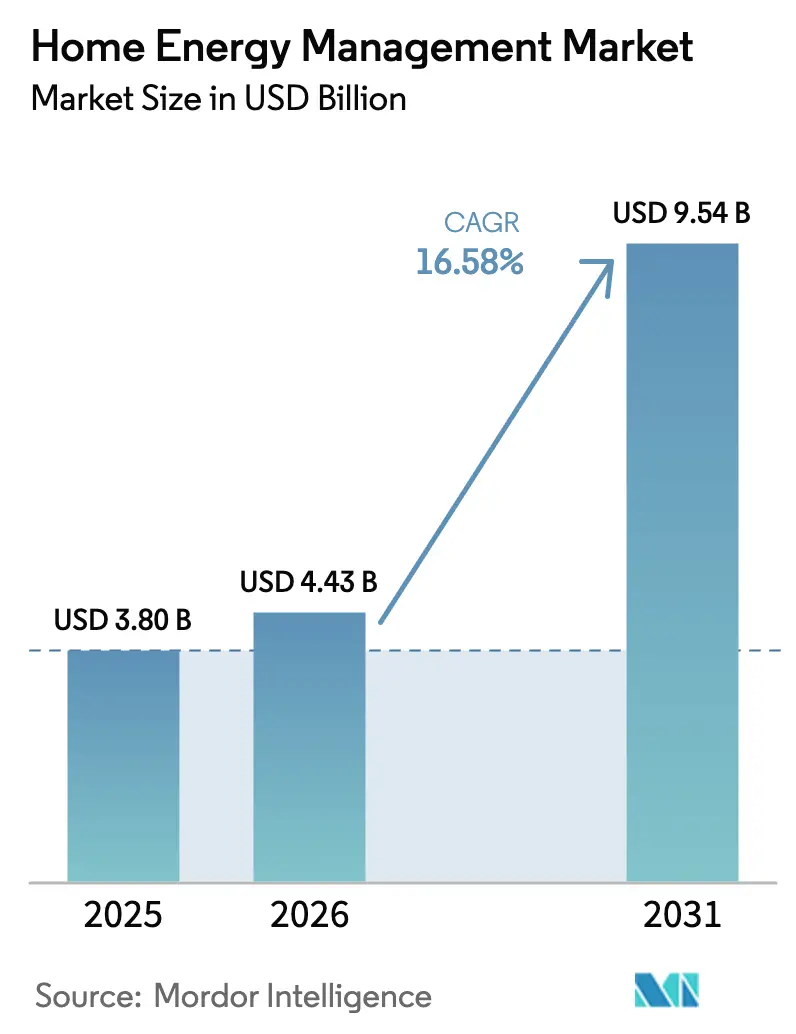
| Market Size (2026) | USD 4.43 Billion |
| Market Size (2031) | USD 9.54 Billion |
| Growth Rate (2026 - 2031) | 16.58% CAGR |
| Fastest Growing Market | Asia Pacific |
| Largest Market | North America |
| Market Concentration | Medium |
Major Players*Disclaimer: Major Players sorted in no particular order Image © Mordor Intelligence. Reuse requires attribution under CC BY 4.0. | |
Home Energy Management Market Analysis by Mordor Intelligence
Home energy management market size in 2026 is estimated at USD 4.43 billion, growing from 2025 value of USD 3.80 billion with 2031 projections showing USD 9.54 billion, growing at 16.58% CAGR over 2026-2031. Declining prices for IoT sensors and connectivity modules, stricter building-energy codes, and higher retail electricity tariffs are the core forces expanding residential demand for intelligent load control and consumption insights. Utility-backed incentives that reward automated demand response, together with the wider roll-out of rooftop solar and residential storage, are positioning connected platforms as the operating layer that harmonizes distributed assets with household comfort. Leading vendors continue to blend hardware with cloud analytics in a bid to create service-based revenue streams, while open-protocol initiatives seek to curb ecosystem lock-in. Competitive intensity is also rising as appliance makers, traditional electrical OEMs, and pure-play software firms vie for wallet share in an addressable base that now includes both new builds and retrofit properties.
Key Report Takeaways
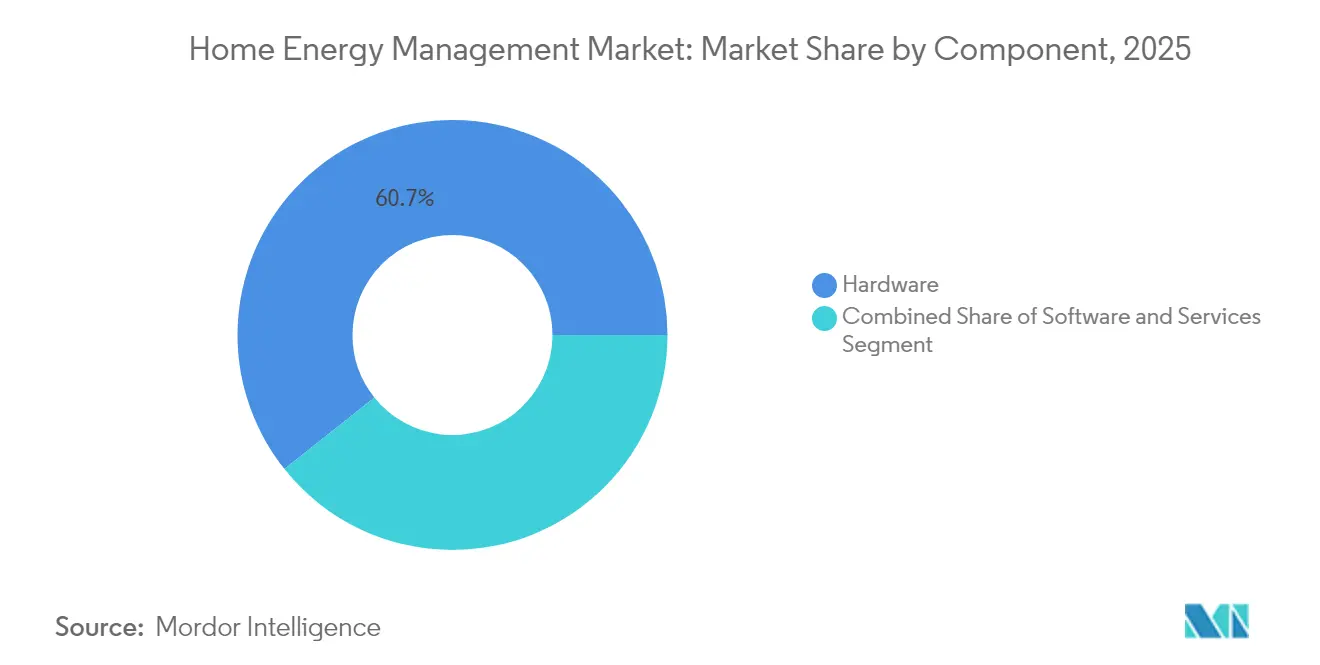
- By component, hardware captured 60.72% of the Home energy management market share in 2025, whereas software is set to post the fastest 15.95% CAGR through 2031.
- By technology, Wi-Fi led with 35.92% revenue share in 2025; Z-Wave is projected to advance at a 11.68% CAGR to 2031.
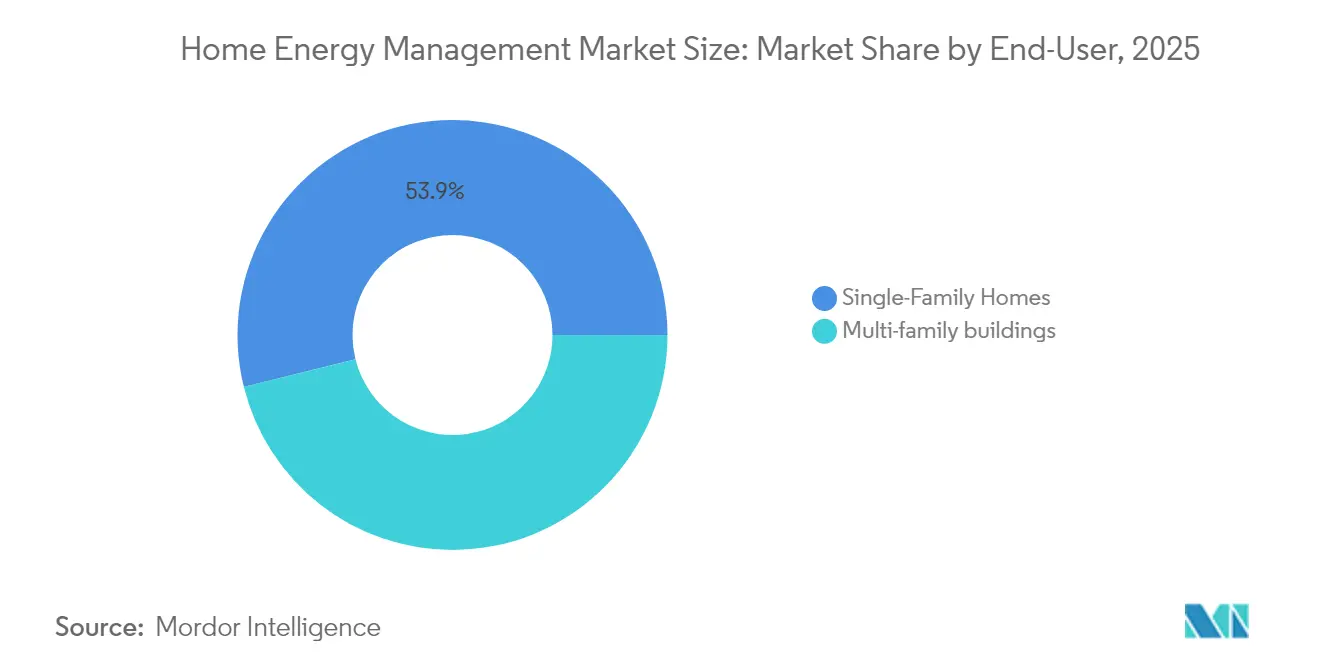
- By end user, multi-family residences held 46.12% share of the Home energy management market size in 2025, while single-family homes are forecast to expand at a 21.35% CAGR through 2031.
- By installation type, new construction accounted for 62.64% of the Home energy management market size in 2025; retrofit activity is growing at a 9.96% CAGR.
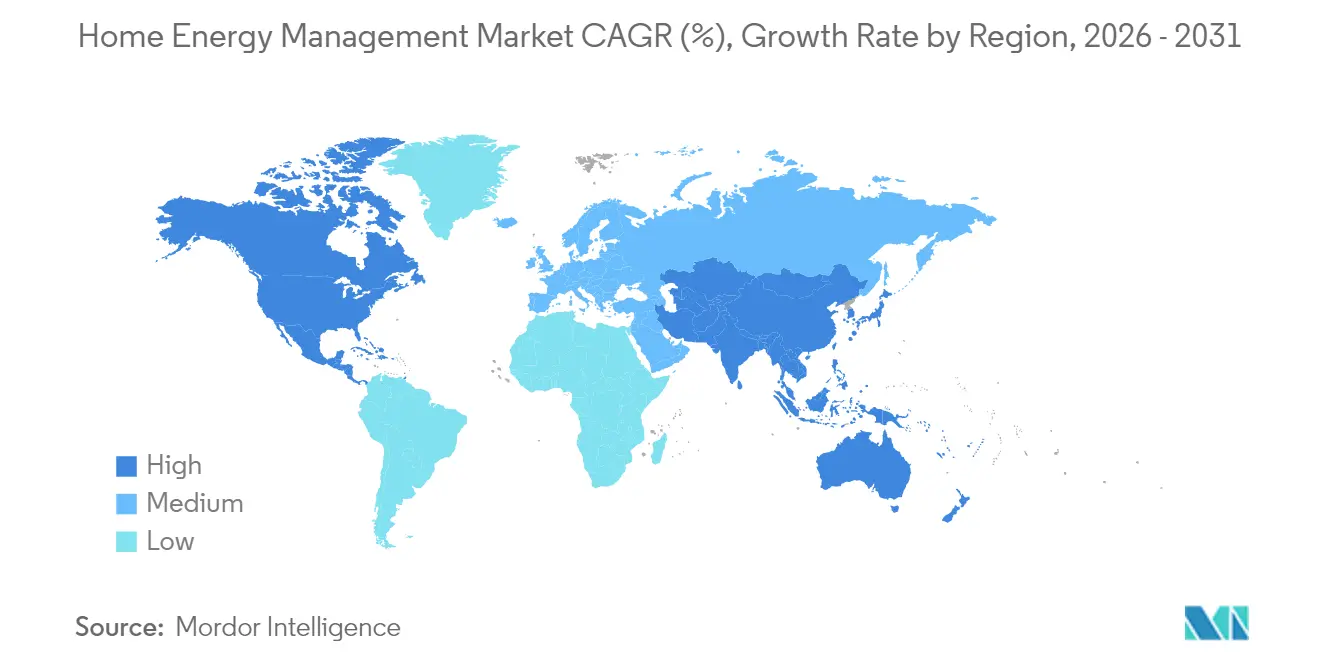
- By geography, North America commanded 39.48% of the Home energy management market share in 2025, yet Asia-Pacific is the fastest-growing region with a 16.26% CAGR.
Note: Market size and forecast figures in this report are generated using Mordor Intelligence’s proprietary estimation framework, updated with the latest available data and insights as of 2026.
Global Home Energy Management Market Trends and Insights
Drivers Impact Analysis*
| Driver | (~) % Impact on CAGR Forecast | Geographic Relevance | Impact Timeline |
|---|---|---|---|
| Rising Adoption of Smart Home Technologies | 3.2% | Global, with North America and Europe leading | Medium term (2-4 years) |
| Growing Focus on Energy Efficiency and Sustainability | 2.8% | Global, particularly the EU and California | Long term (≥ 4 years) |
| Falling prices for IoT sensors, connectivity modules, and cloud services | 4.1% | Global, with Asia-Pacific manufacturing advantages | Short term (≤ 2 years) |
| Building codes in major markets now mandate energy-efficiency features | 2.9% | North America, EU, select Asia-Pacific markets | Medium term (2-4 years) |
| Widespread rooftop solar adoption drives demand for integrated home energy management systems | 2.4% | Global, concentrated in high-solar regions | Long term (≥ 4 years) |
| Rising electricity tariffs and time-of-use pricing motivate consumers to actively manage appliances and shift loads to lower-cost periods | 1.4% | Global, with regional variations in pricing structures | Short term (≤ 2 years) |
| Source: Mordor Intelligence | |||
Rising Adoption of Smart Home Technologies
Smart-device penetration keeps climbing as households seek convenience and control. The typical connected U.S. residence now operates about 8 smart devices, giving platforms rich datasets to orchestrate HVAC, lighting, and appliances. Large integrated providers such as Vivint surpassed 2 million customers in 2024, validating end-to-end offerings that meld security, automation, and energy management. AI-driven software optimizes loads ahead of peak windows, producing 10–30% consumption cuts without sacrificing comfort. High satisfaction levels among device owners underpin ongoing upgrades to whole-home orchestration.
Growing Focus on Energy Efficiency and Sustainability
Buildings account for one-third of global energy demand and carbon emissions, spurring policies that view efficiency as the “first fuel” for mitigation. Advanced codes can trim energy use by up to 70%, and countries that have adopted mandatory standards now exceed 88. Corporate commitments add further weight, illustrated by Schneider Electric customers reporting substantial avoided emissions through its energy-saving portfolio. Expanded tax credits for solar and storage tighten the business case for integrated management, turning sustainability objectives into household-level purchases.
Falling Prices for IoT Sensors, Connectivity Modules and Cloud Services
Economies of scale in Asia-Pacific manufacturing are driving 15–20% annual cost declines across sensors and radio modules. At the same time, commoditized cloud infrastructure has cut the operating expense of ingesting and analyzing granular consumption data. Edge-ready microcontrollers now handle on-device analytics, reducing bandwidth fees and latency. These tailwinds lower upfront system prices, unlocking price-sensitive segments and accelerating retrofit viability across mature housing stocks.
Building Codes Mandating Energy-Efficiency Features
Regulators are embedding efficiency into mandatory standards. The 2024 International Energy Conservation Code boosts new-build site-energy savings by 7.8% and formally recognizes smart controls as a compliance path. Federal agencies have likewise adopted updated codes for financed housing, and the EU’s April 2024 Code of Conduct for Energy Smart Appliances stipulates interoperable demand-flexibility features[2]Joint Research Centre, “EU Code of Conduct for Energy Smart Appliances,” ec.europa.eu. Such policies guarantee baseline demand and streamline product design by converging around common performance thresholds.
Restraint Impact Analysis*
| Restraint | (~) % Impact on CAGR Forecast | Geographic Relevance | Impact Timeline |
|---|---|---|---|
| Up-front purchase and professional installation costs | -2.1% | Global, particularly price-sensitive emerging markets | Short term (≤ 2 years) |
| Data-privacy concerns over granular household consumption patterns | -1.8% | Global, with heightened sensitivity in EU and California | Medium term (2-4 years) |
| Lack of interoperability standards across Zigbee, Z-Wave, Wi-Fi and proprietary protocols | -1.4% | Global, affecting ecosystem development | Medium term (2-4 years) |
| Limited consumer awareness in emerging economies | -1.2% | Asia-Pacific, Latin America, MEA emerging markets | Long term (≥ 4 years) |
| Source: Mordor Intelligence | |||
Up-front Purchase and Professional Installation Costs
Comprehensive whole-home systems often require Multi thousand-dollar budgets that cover hardware, electrical upgrades, and professional commissioning. Installation labor can add 20–40% to the invoice, stretching payback periods for households with modest consumption profiles. Recent code compliance estimates suggest incremental construction costs of up to USD 31,000 in certain markets, underlining affordability hurdles. Subscription models and falling component costs are starting to compress barriers, yet access remains uneven in lower-income demographics.
Data-Privacy Concerns Over Granular Household Consumption Patterns
Smart meters and sub-metering devices expose detailed occupancy and lifestyle data, raising fears of misuse and cyber intrusion. Surveys show a majority of consumers remain wary of sharing real-time load profiles. Stringent rules such as the EU GDPR impose explicit consent and data-handling obligations, elevating compliance costs. Industry adoption of privacy-preserving analytics and transparent governance frameworks is essential to bolster trust and unlock mass-market acceptance.
*Our forecasts treat driver/restraint impacts as directional, not additive. The impact forecasts reflect baseline growth, mix effects, and variable interactions.
Segment Analysis
By Component: Hardware Dominance Meets Software Acceleration
Hardware contributed 60.72% of the Home energy management market share in 2025, anchored by smart meters, connected load centers, thermostats, and residential batteries that form the physical backbone of every deployment. Hardware revenue will continue to rise as new-build codes incorporate smart controls into baseline specifications; however, the segment’s growth rate is slower than the aggregate Home energy management market because many devices are already becoming commoditized, and prices continue to fall. Software, in contrast, is scaling at a 15.95% CAGR through 2031, fueled by cloud dashboards, predictive analytics, and utility program integrations that extend value long after the initial install. Vendors now bundle AI engines that forecast load curves and automate tariff-aware scheduling, prompting customers to opt for subscription contracts that secure recurring service revenue.
The two segments are converging as suppliers seek to gain end-to-end control of the customer stack. Device manufacturers embed secure firmware that unlocks premium functions via over-the-air updates, while software specialists release branded sensors to capture higher-resolution data. This vertical integration trend is widening the Home energy management market size because households gain more features from a single purchase, shortening payback periods and encouraging upgrades. Platforms such as Schneider Electric’s EcoStruxure illustrate the blend, coupling thermostats, inverters and smart panels with a SaaS layer that reports real-time carbon intensity and alerts users to demand-response events.


By Technology: Wi-Fi leads yet Z-Wave gains ground
Wi-Fi accounted for 35.92% of 2025 revenue, riding on near-universal router penetration and high bandwidth that supports video diagnostics and firmware streaming. Homeowners favor Wi-Fi because it avoids additional hubs, and installers can troubleshoot remotely through standard network tools. The downside is higher standby power draw and possible congestion in crowded 2.4 GHz bands, which can degrade battery-powered sensors. Z-Wave is closing the gap with a 11.68% CAGR, using sub-1 GHz links that travel farther through walls and mandatory Security 2 encryption that calms privacy anxieties.
Product designers increasingly adopt multiprotocol chips so gateways can translate Zigbee, Thread and legacy proprietary radios into a single interface, reducing ecosystem lock-in risks. These hybrids smooth user experience and expand the Home energy management market because buyers no longer fear stranded assets when they add new appliances. Standards such as Matter further encourage cross-brand compatibility, a critical step for dense, sensor-rich dwellings that may host dozens of nodes. The outcome is a layered radio landscape where Wi-Fi powers bandwidth-hungry edge devices, low-energy protocols handle routine sensing and Z-Wave or Thread form self-healing backbones for whole-home automation.
By End User: Multi-family scale meets single-family autonomy
Multi-family buildings commanded 46.12% of the Home energy management market size in 2025 as property developers leveraged bulk buys and centralized commissioning to trim per-unit costs. Common-area dashboards allow facility managers to benchmark and optimize HVAC, lighting and EV charging across hundreds of apartments, producing portfolio-wide utility savings and higher green-building certifications. Bulk procurement also simplifies warranty and maintenance contracts, aligning with investor expectations for lower operating expenses and improved ESG scores.
Single-family homes are the momentum story, expanding at a 21.35% CAGR through 2031 as homeowners chase bill savings and resilience by pairing rooftop solar with battery storage. User-friendly mobile apps and declining hardware prices flatten the learning curve, while financing models that wrap equipment, installation and services into a single monthly payment remove upfront sticker shock. Together, these forces enlarge the Home energy management market because they tap the biggest slice of the housing stock and cultivate word-of-mouth adoption in suburban neighborhoods.
By Installation: Code-driven new builds spark retrofit innovation
New construction represented 62.64% of the Home energy management market share in 2025, reflecting building codes that now treat smart controls as a compliance pathway. Developers integrate panels with native circuit-level metering and pre-wire for solar inverters, shrinking incremental costs and eliminating future tear-outs. Lenders and insurers are also starting to favor high-performance homes, reinforcing demand for embedded energy intelligence.
Retrofit projects are growing at 9.96% CAGR because roughly 80% of existing homes pre-date modern standards and waste electricity daily. Manufacturers answer with meter-collar adapters, plug-and-play circuit sensors and load-center overlays that avoid invasive rewiring. Utility rebates and federal credits cover a sizable share of materials, trimming payback periods to well under 10 years for many households. This dual-channel dynamic broadens the Home energy management systems industry by ensuring both new buyers and long-time owners can access smart load management.
Geography Analysis
North America continues to anchor global revenues, driven by mature distribution channels, widespread smart meter roll-outs, and federal tax credits that favor integrated solar-plus-storage packages. Residential users are showing a growing appetite for whole-home backup systems powered by intelligent controllers that manage circuits during outages. State-by-state adoption of the 2024 IECC is creating consistent baseline demand for connected controls.
Asia-Pacific is the momentum engine, aided by government programs that prioritize flexible load management to balance surging rooftop solar and rapid EV uptake. China’s ambitious 100 GW storage target and Japan’s Green Growth Strategy are catalyzing local HEMS deployments aligned with distributed energy resources. Cost advantages from regional hardware production shorten payback periods and accelerate mainstream adoption in rapidly growing urban corridors.
Europe is experiencing steady expansion, driven by stringent efficiency mandates and high electricity tariffs. The April 2024 Code of Conduct for Energy Smart Appliances formalizes interoperability expectations, smoothing cross-border product launches. Northern markets leverage digital readiness and high renewable penetration, while southern nations deploy HEMS to maximize self-consumption of abundant solar generation. GDPR compliance remains a differentiator, favoring platforms with demonstrable data-protection credentials.

Competitive Landscape
The Home energy management market is characterised by moderate fragmentation and a gradual tilt toward platform concentration. Global electrical equipment leaders, such as Schneider Electric, Siemens, Eaton, and Honeywell, wrap connected load centers, smart breakers, and battery inverters with AI-enabled dashboards and utility-grade demand-response modules. Pure-play software entrants compete through device-agnostic analytics, seeking to monetize consumption insights rather than relying on hardware margins.
Vertical integration is gathering pace. OEMs are acquiring or partnering with software firms to secure ecosystem stickiness and generate recurring service revenues. Notable moves include Schneider Electric’s stake in Planon to strengthen building-software depth and Eaton’s alliance with Lunar Energy to deliver modular solar-storage-controller kits. Competitive differentiation now hinges on seamless commissioning, protocol interoperability, and consumer-friendly mobile interfaces.
Untapped opportunities persist in affordable retrofit packages, utility-orchestrated HEMS programs, and data-monetization services that share efficiency savings with homeowners. As regional codes converge on common interoperability and cyber-security goals, winning vendors will need to demonstrate certifications while still innovating on ease of use and value-added features.[3]Schneider Electric, “2024 Sustainability Impact Report,” se.com
Home Energy Management Industry Leaders
Schneider Electric
Siemens AG
Honeywell International Inc.
General Electric Company
Panasonic Corporation
- *Disclaimer: Major Players sorted in no particular order

Recent Industry Developments
- November 2024: Trane Technologies acquired BrainBox AI, bolstering artificial-intelligence capabilities for residential and commercial HVAC optimization.
- October 2024: Eaton partnered with Lunar Energy to launch modular home energy ecosystems integrating solar, storage, and smart load centers.
- September 2024: Eaton unveiled the AbleEdge solution, converting conventional load centers into interoperable smart panels that shorten installation time and reduce component count.
- September 2024: Mitsubishi Electric introduced Wi-Fi Heat Pump Energy Monitoring feature via their Wi-Fi Control App, enabling real-time energy consumption tracking and potential 10% energy savings through temperature optimization.


Research Methodology Framework and Report Scope
Market Definitions and Key Coverage
Our study defines the home energy management market as the collection of connected controllers, sensors, in-home displays, cloud software, and mobile applications that allow a residence to monitor, schedule, and optimize electricity flows across loads, rooftop solar, batteries, and electric-vehicle chargers. Measurement begins when data leave the main service panel or smart meter and extends to device-level analytics delivered through the platform.
Scope Exclusion: Stand-alone smart bulbs and basic programmable thermostats sold without a networking gateway are outside this assessment.
Segmentation Overview
- By Component
- Hardware
- Smart Meters
- Smart Thermostats
- Energy Storage Systems
- Smart Plugs and Outlets
- In-Home Displays (IHDs)
- Other Hardware
- Software
- Services
- Hardware
- By Communication Technology
- ZigBee
- Wi-Fi
- Z-Wave
- Bluetooth
- HomePlug
- Other Technologies
- By End-User
- Residential
- Single-Family Homes
- Multi-Family Housing
- Commercial
- Small Office / Home Office
- Retail and Hospitality
- Residential
- By Deployment Mode
- Cloud-Hosted Platforms
- On-premises / Local Gateway
- By Geography
- North America
- United States
- Canada
- Mexico
- South America
- Brazil
- Argentina
- Rest of South America
- Europe
- United Kingdom
- Germany
- France
- Italy
- Spain
- Nordics
- Rest of Europe
- Middle East and Africa
- Middle East
- Saudi Arabia
- United Arab Emirates
- Turkey
- Rest of Middle East
- Africa
- South Africa
- Egypt
- Nigeria
- Rest of Africa
- Middle East
- Asia-Pacific
- China
- India
- Japan
- South Korea
- ASEAN
- Australia
- New Zealand
- Rest of Asia-Pacific
- North America
Detailed Research Methodology and Data Validation
Primary Research
Mordor analysts interviewed utility program managers, solar-storage integrators, gateway chipset suppliers, and energy-services start-ups across North America, Europe, and Asia Pacific. These discussions validated penetration assumptions, typical hardware pricing, and customer adoption triggers before being looped back into the model.
Desk Research
Our team began with publicly available tier-one sources such as the US DOE Residential Energy Consumption Survey, the International Energy Agency's Efficiency Indicators, Eurostat household tariff files, and Japan's Agency for Natural Resources & Energy statistics. Trade association data from the Smart Electric Power Alliance, patent volumes pulled through Questel, plus company revenue snapshots from D&B Hoovers helped us benchmark technology diffusion and supplier scale. We also reviewed investor presentations and utility demand-side management reports that disclose program enrollments and installed gateway counts. This list is illustrative; many additional repositories supported data gathering and clarification.
Market-Sizing & Forecasting
We anchor the top-down model on household electricity spend and smart-meter stock per country, which are then multiplied by observed HEMS penetration rates and weighted average system prices. Select bottom-up checks, shipment roll-ups from leading hardware vendors and installer channel feedback, are applied to reconcile totals. Key variables include smart-meter penetration, retail kWh prices, rooftop PV plus battery installations, hardware ASP deflation, and utility dynamic-tariff coverage. A multivariate regression captures how these drivers move adoption, while scenario analysis nets the effect of proposed incentives. Where supplier data are missing, gap fills follow conservative regional analogs vetted through expert calls.
Data Validation & Update Cycle
Outputs pass a two-step analyst review that compares results with external indicators, flags anomalies, and triggers re-contacts when variances exceed preset thresholds. Reports refresh annually; interim updates occur after material regulatory or technology shifts, ensuring clients always receive our latest view.
Why Mordor's Home Energy Management Baseline Stays Dependable
Published figures often differ because firms choose unlike device scopes, price stacks, and refresh cadences. By keeping a consistent definition, updating inputs yearly, and cross-checking top-down totals with shipment evidence, Mordor delivers a balanced, transparent baseline.
Key gap drivers include broader device baskets used by some publishers, aggressive price-compression curves, or reliance on historical growth extrapolation rather than variable-based forecasts.
Benchmark comparison
| Market Size | Anonymized source | Primary gap driver |
|---|---|---|
| USD 3.80 B (2025) | Mordor Intelligence | - |
| USD 4.81 B (2024) | Global Consultancy A | Includes smart light controls and legacy thermostats; applies straight-line CAGR without price normalization |
| USD 5.80 B (2024) | Industry Association B | Counts utility smart-meter roll-outs as full HEMS installs; limited bottom-up validation |
| USD 4.18 B (2023) | Trade Journal C | Older base year, extrapolated forward with fixed growth factor, no adjustment for ASP decline |
In sum, Mordor's disciplined scope, driver-based modeling, and annual refresh cadence give decision-makers a reliable, reproducible starting point while highlighting precisely where and why other published numbers diverge.


Key Questions Answered in the Report
What is the current size of the Home energy management market?
The market reached USD 4.43 billion in 2026 and is on track to keep expanding through 2031.
How fast will the Home energy management market grow between 2026 and 2031?
Analysts project a 16.58% compound annual growth rate, lifting revenues to USD 9.54 billion by 2031.
Which region leads the Home energy management market today?
North America holds the largest regional share at 39.48% in 2025 thanks to mature smart-home infrastructure and generous federal incentives.
Which segment is forecast to grow the fastest?
Software is the breakout segment, advancing at a 15.95% CAGR as vendors shift toward cloud analytics and subscription services.
How do recent building codes affect demand for home energy management systems?
Updated standards such as the 2024 International Energy Conservation Code make smart controls a compliance pathway, guaranteeing steady demand in new residential construction.
What are the main barriers to wider adoption?
High upfront installation costs and household data-privacy concerns remain the two most significant hurdles, though falling hardware prices and stronger security practices are easing each challenge.
Page last updated on:


