
Blockchain In Energy Market Size and Share
Market Overview
| Study Period | 2020 - 2031 |
|---|---|
| Market Size (2026) | USD 3.46 Billion |
| Market Size (2031) | USD 9.92 Billion |
| Growth Rate (2026 - 2031) | 23.48 % |
| Fastest Growing Market | Asia-Pacific |
| Largest Market | Europe |
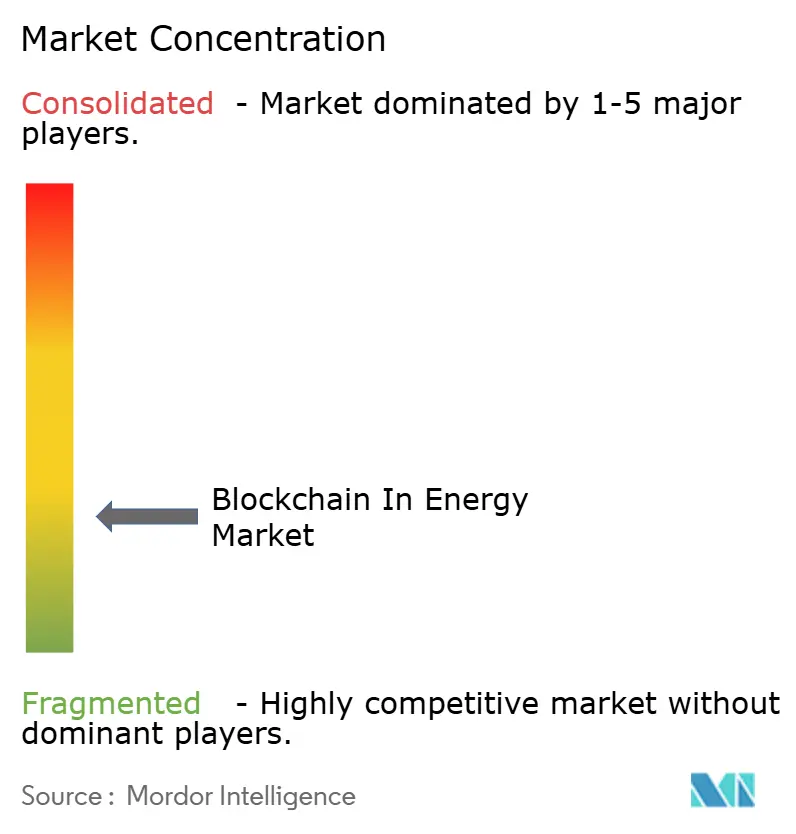
| Market Concentration | Low |
Major Players *Disclaimer: Major Players sorted in no particular order Image © Mordor Intelligence. Reuse requires attribution under CC BY 4.0. | |
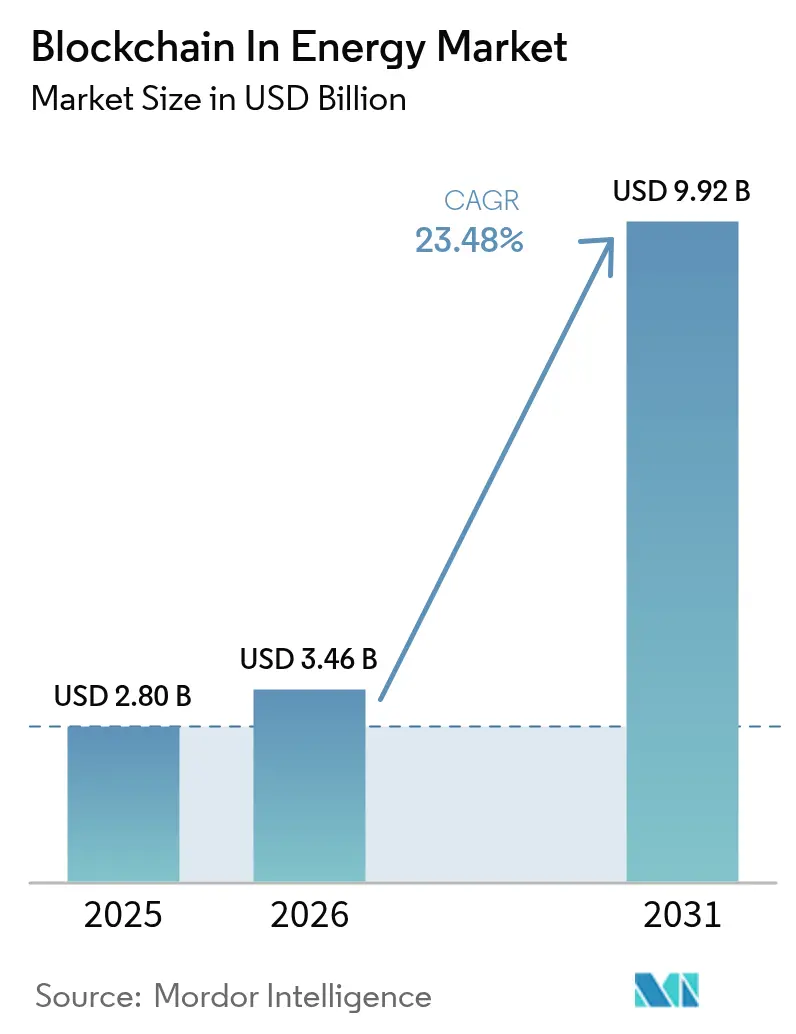
Blockchain In Energy Market Analysis by Mordor Intelligence
Blockchain In Energy Market size market size in 2026 is estimated at USD 3.46 billion, growing from 2025 value of USD 2.80 billion with 2031 projections showing USD 9.92 billion, growing at 23.48% CAGR over 2026-2031.
The rapid expansion is supported by Europe’s strong regulatory frameworks, Asia-Pacific’s venture-capital stimulus and rising corporate demand for 24/7 carbon-free energy certificates. Utility-backed pilots are graduating to commercial platforms that automate peer-to-peer (P2P) trading, monetize distributed energy resource (DER) flexibility and integrate variable tariffs that mirror real-time grid conditions. The emergence of energy-efficient proof-of-stake protocols, exemplified by Solana’s 69% energy-consumption reduction, lowers transaction costs and removes a key barrier to scale. Venture funding into token-based DER roll-outs validates investor confidence, while smart contracts enable electric-vehicle (EV) fleets and stationary batteries to earn grid-service revenues. Combined, these dynamics position the blockchain in energy sector market for sustained double-digit growth through 2030.
Key Report Takeaways
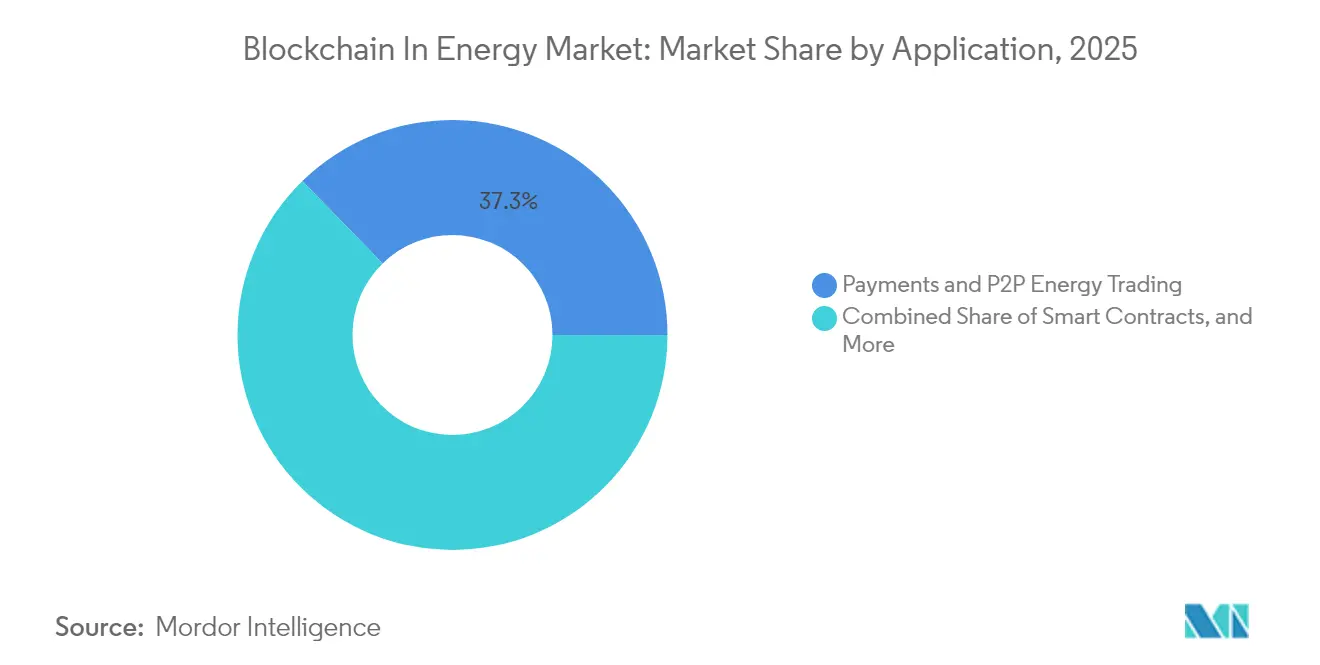
- By application, payments and P2P energy trading led with 37.30% of the blockchain in energy sector market share in 2025, while smart contracts for DER flexibility are projected to expand at 28.74% CAGR through 2031
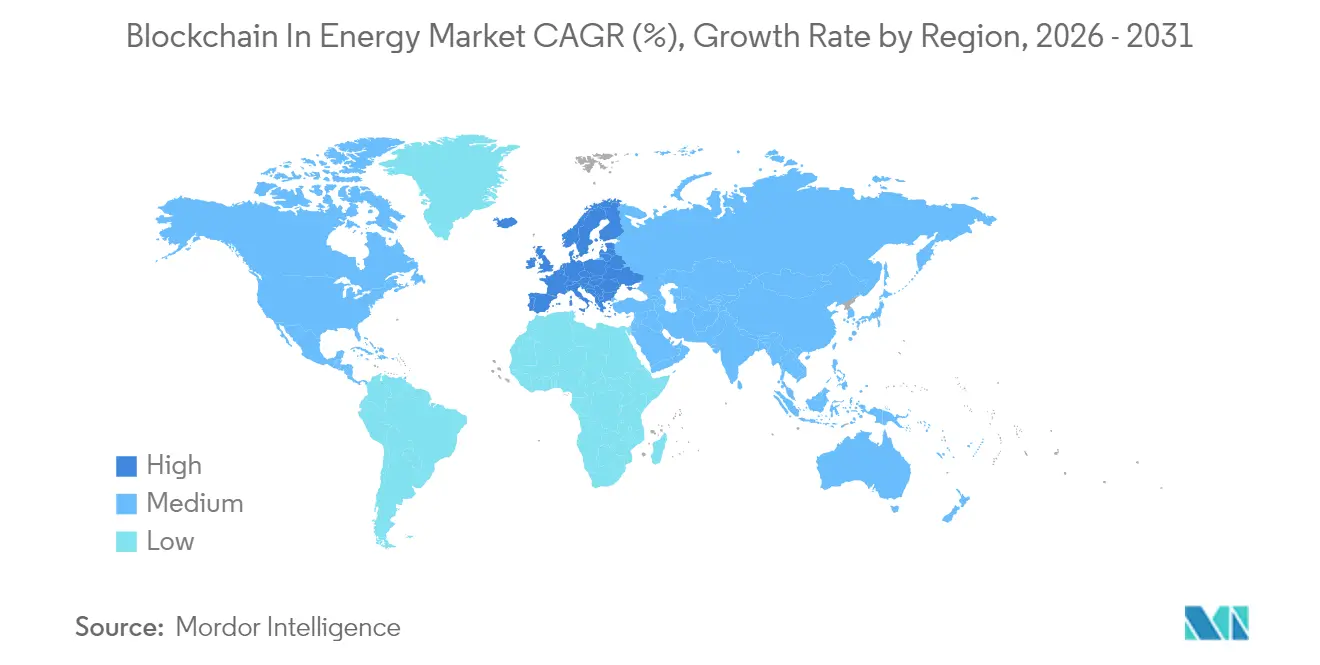
- By region, Europe dominated with 31.60% revenue share in 2025; Asia-Pacific is forecast to advance at a 27.10% CAGR to 2031
Note: Market size and forecast figures in this report are generated using Mordor Intelligence’s proprietary estimation framework, updated with the latest available data and insights as of 2026.
Market Trends and Insights
Drivers Impact Analysis of Blockchain In Energy Market*
| Driver | (~) % Impact on CAGR Forecast | Geographic Relevance | Impact Timeline |
|---|---|---|---|
| Emergence of variable tariffs & P2P trading | +6.20% | Global, early adoption in Europe & Asia-Pacific | Medium term (2-4 years) |
| Utility-backed blockchain certificate programs | +5.80% | North America & Europe, expanding to Asia-Pacific | Short term (≤ 2 years) |
| VC funding surge into energy-token start-ups | +4.10% | Global, concentrated in North America & Europe | Long term (≥ 4 years) |
| Token-based financing for DER roll-outs | +3.70% | Asia-Pacific core, spill-over to North America | Medium term (2-4 years) |
| Source: Mordor Intelligence | |||
Emergence of Variable Tariffs & P2P Trading
Variable tariffs are replacing flat rates with real-time pricing that reflects supply–demand imbalances, creating arbitrage opportunities for prosumers. Austria’s smartCOMMUNITY platform lets households customize power-purchase agreements and trade surplus solar at competitive rates, aligning with the nation’s 100% renewable goal by 2030.[1]Power Ledger Pty Ltd, “Austrian smartCOMMUNITY Roll-out,” powerledger.io Japan’s KEPCO trial projected USD 18.5 billion in savings from abandoning fixed feed-in tariffs, showing how market-driven pricing can reshape national energy economics. Consortium blockchains deployed in rural microgrids deliver superior paybacks versus traditional net-metering, highlighting the commercial viability of distributed marketplaces. As participation rises, network effects deepen liquidity, accelerating adoption across the blockchain in the energy sector market.
Utility-Backed Blockchain Certificate Programs
Utilities are launching blockchain certificate schemes to comply with renewable mandates while retaining market influence. South Korea’s KEPCO partnership is building a national renewable-energy certificate (REC) standard on blockchain, ensuring transparent issuance and trade under regulatory supervision. In Canada, Alectra’s GridExchange demonstrates how a utility-operated marketplace pays DER owners for grid support without ceding control. Texas’s ERCOT REC program offers a proven trading mechanism that blockchain can enhance rather than replace, signaling that the most scalable deployments will collaborate with, not disrupt, incumbent operators
VC Funding Surge into Energy-Token Start-ups
Institutional investors are backing platforms that tokenize energy assets and pair blockchain with AI for predictive dispatch. Renewabl’s multi-million seed round, led by Helen Ventures, funds a ledger that tracks hourly emissions and recommends clean-energy purchases that could cut corporate Scope 2 and 3 emissions by up to 20%. Japan’s legal change allowing venture funds to hold crypto assets unlocks domestic capital for Web3 energy ventures, accelerating the Asia-Pacific innovation cycle. The funding influx positions tokenized energy as a new global commodity class, underpinning liquidity and growth for the blockchain in the energy sector market.
Token-Based Financing for DER Roll-Outs
Tokenized securities enable fractional investment in solar arrays and battery storage, lowering entry barriers for retail investors in regions where traditional project finance is constrained. Community projects use blockchain to record each investor’s share and automate dividend payments, boosting capital formation for renewables. Germany’s 1.9 GWh residential battery market benefits from network-fee exemptions, making token models especially attractive for storage projects. The upcoming EU Battery Regulation, which mandates blockchain-backed battery passports from 2027, further elevates the appeal of traceability-ready financing structures.
Restraints Impact Analysis of Blockchain In Energy Market*
| Restraint | (~) % Impact on CAGR Forecast | Geographic Relevance | Impact Timeline |
|---|---|---|---|
| Scalability & transaction-cost constraints | -4.80% | Global, acute in high-volume markets | Short term (≤ 2 years) |
| Fragmented energy-data standards | -3.20% | Global, varying by region | Medium term (2-4 years) |
| Source: Mordor Intelligence | |||
Scalability & Transaction-Cost Constraints
Legacy proof-of-work chains cannot process the micro-transactions needed for real-time grid balancing. Research on SNARK-based parallel execution shows 10,000-fold throughput gains, hinting at a viable path to utility scale.[2]Cryptology ePrint Archive, “SNARK-Based Parallel Execution,” eprint.ia Solana’s proof-of-stake network consumes only 0.00412 Wh per transaction, with total 2024 usage equal to 833 US homes, proving that energy-efficient consensus can cut both emissions and fees. Hybrid blockchains tested for EV energy trading blend proof-of-work security with proof-of-stake efficiency, demonstrating practical solutions for the blockchain in the energy sector market.
Fragmented Energy-Data Standards
Divergent technical and legal frameworks hinder cross-border energy token flows. The European Blockchain Services Infrastructure is advancing interoperability, yet member states still implement distinct data schemas that complicate scaling. China’s Green Certificate Trading System, optimized via Q-learning algorithms, illustrates national success that remains siloed from global markets. Industry consortia such as the Energy Web Foundation are drafting common protocols, but until regulators converge, fragmentation will temper growth in the blockchain energy sector market
*Our forecasts treat driver/restraint impacts as directional, not additive. The impact forecasts reflect baseline growth, mix effects, and variable interactions.
Blockchain In Energy Market Segment Analysis
By Application:
Smart Contracts Drive Grid ModernizationSmart contracts for DER flexibility accounted for USD 0.65 billion in 2025 and are poised to grow at a 28.74% CAGR to 2031. This sub-segment automates the dispatch of EV fleets and household batteries, minimizing human intervention and supporting grid stability during peak demand. Payments and P2P energy trading maintained the largest 37.30% share of the blockchain in the energy sector market size in 2025, proving immediate commercial viability for automated billing and settlement. Governance, risk, and compliance solutions are gaining momentum as hourly renewable-energy matching becomes standard in corporate procurement, underscoring the breadth of use cases now captured by the blockchain in the energy sector market.
Integrating AI with blockchain smart contracts is elevating operational efficiency. Microsoft and Flexidao’s hourly matching of offshore wind output with data center consumption shows how immutable ledgers prevent double-counting while advanced algorithms maximize synchronicity scores. Digital-identity frameworks relying on zero-knowledge proofs safeguard user privacy as EVs interact with smart grids, and energy-efficiency incentive schemes deliver token rewards for demand-response participation. Together, these evolving applications expand the blockchain in the energy sector industry toolkit and anchor long-term value creation across the grid.



Geography Analysis
Europe Blockchain in Energy Market
Europe contributed 31.60% of 2025 revenue, cementing its lead through cohesive policy instruments and sizable public outlays. The European Commission’s EUR 22.5 million Hamburg heating transition leverages blockchain to verify heat-source provenance, emphasizing state-level commitment to transparent energy systems. Regulatory sandboxes, such as the European Blockchain Sandbox that vetted Enoda’s ENSEMBLE platform, lower the compliance cost for innovators and accelerate commercialization. Austria’s P2P trading roll-out confirms that consistent policy support translates to commercial adoption and underpins the blockchain in the energy sector market.
APAC Blockchain in Energy Market
Asia-Pacific is the fastest-growing geography, projected at 27.10% CAGR. Japan’s revised fund rules allow limited partnerships to hold crypto, channeling domestic capital toward Web3 energy ventures. South Korea’s utility consortium is establishing blockchain-based REC markets under ministerial oversight, granting legitimacy that draws additional investment, tokenpost.kr. Australia’s vehicle-to-grid tariff research highlights how adaptive rate design maximizes both customer savings and grid support, offering a replicable blueprint for future blockchain platforms.
North America Blockchain in Energy Market
North America’s market advances on large-scale integration. The US Department of Energy’s 10-year vehicle-to-grid roadmap prioritizes cybersecurity and smart charging—the foundational layers for blockchain interoperability. California’s fast-charging pilots demonstrate cost reductions when renewable integration and grid services are optimized through distributed ledgers. Canada’s Alectra GridExchange provides a proof point for utility-operated marketplaces, preserving incumbent roles while embracing new transactional architectures.

Regulatory Landscape
Regulation is crystallizing around technical standards and compliance overlays that determine whether blockchain platforms can support market-facing energy processes such as metering data, certificates, and trading. IEEE 2418.5-2025, board approved in June 2025 and published in December 2025, provides a reference architecture for blockchain in power and energy systems, giving utilities and vendors a shared baseline for interoperability and security discussions. At the same time, the European Commission continues to drive blockchain standardization through its blockchain and web3 strategy and related digitalisation-of-energy initiatives, reinforcing requirements around data governance and energy-efficiency characteristics of digital infrastructure.
In the United States, the Department of Energy is supporting validation pathways for blockchain-enabled cyber-physical security through the Grid Modernization Laboratory Consortium, including the BLOSEM testing platform. In February 2026, Idaho National Laboratory released a standards and regulation risk mapping for digital energy systems, highlighting the compliance burden spanning grid cybersecurity expectations, consumer protection, and data privacy. Across jurisdictions, remaining issues include the legal enforceability of smart contracts for settlement, licensing and oversight for prosumer marketplaces, and alignment between electricity-market rules and digital-asset frameworks when tokens are used for certificates or financing structures.
Value Chain Analysis
The value chain begins with distributed ledger and protocol providers, including consensus and identity and privacy layers, and then moves through cloud and integration stacks that connect blockchain to operational technology and enterprise IT. Standards bodies such as IEEE and ITU-T increasingly influence upstream design choices: IEEE 2418.5-2025 provides an interoperable framework for blockchain in power systems, and ITU-T F.751.14 (June 2024) defines a reference architecture for traceability of renewable energy consumption information. These standards feed into platform vendors and system integrators that build applications for payments and P2P trading, renewable energy certificate registries, and smart-contract automation for DER flexibility.
Midstream participants include utilities, distribution system operators, aggregators, and energy-community platforms that provide metering access, grid constraints, and market interfaces. Smart meters, EV chargers, batteries, IoT gateways, and digital twins supply verifiable measurements, but integration remains a bottleneck where legacy utility systems, cross-chain interoperability, and fragmented data schemas limit scaling. Downstream, corporates and prosumers use blockchain-enabled certificates and hourly matching tools to substantiate procurement and emissions reporting, while tokenization models connect financiers and retail investors to DER and storage projects when traceability and automated payout logic are required for governance.
Competitive Landscape
Competitive intensity remains high as utilities, enterprise software vendors, and blockchain-native start-ups vie for share. IBM and SAP integrate ledger modules into existing energy-management suites, leveraging established customer bases. Specialists like Power Ledger and LO3 Energy focus on P2P offerings that bypass conventional billing while ensuring regulatory compliance. Utilities such as KEPCO and Alectra answer disruption by launching proprietary platforms, thereby anchoring customer relationships within the expanding blockchain in the energy sector market.
White-space opportunities include cross-border energy trading, where few platforms currently reconcile different REC standards and tariff structures. AI-enhanced blockchain systems—exemplified by Renewabl’s emissions-tracking ledger—promise proactive asset dispatch and real-time offset recommendations, highlighting a nascent battleground for intellectual property. Solana’s low-energy proof-of-stake network demonstrates that consensus innovation can yield both cost and sustainability advantages, suggesting protocol selection will influence competitive outcomes. Patent activity trends toward privacy-preserving analytics, with zero-knowledge proofs addressing data-sharing hesitations and potentially redefining competitive edge within the blockchain in energy sector market.
Blockchain In Energy Industry Leaders
SAP SE (SAP)
Accenture PLC
IBM Corporation
LO3 Energy Inc.
Accenture
- *Disclaimer: Major Players sorted in no particular order
Blockchain In Energy Market Companies Covered in this Report
- SAP SE
- Electron
- Accenture
- IBM
- LO3 Energy
- GREENEUM
- Drift Marketplace
- IOTA Foundation
- BTL Group
- Power Ledger
- ImpactPPA

Market Opportunities and Future Outlook
Operationalizing P2P trading beyond single-utility territories remains a key whitespace, especially for interstate or cross-border settlement where commissions and market operators require auditable data sharing and clear oversight. In February 2026, the India Smart Grid Forum documented an interstate P2P trading demonstration across the National Capital Region, involving PVVNL, TPDDL, and BRPL, supported by provisional six-month approvals from the Delhi Electricity Regulatory Commission and the Uttar Pradesh Electricity Regulatory Commission. Multi-operator setups like this raise demand for standardized identity, metering provenance, and dispute-resolution logic, all of which blockchain platforms can encode into repeatable market processes.
Another opportunity sits at the intersection of compliance-grade traceability and flexibility markets. Platforms need to prove not only the transactions, but also the attributes behind them, such as time, source, and avoided double counting. Siemens and Allgaeuer Ueberlandwerk launched the Pebbles pilot in Wildpoldsried, Germany (December 2024), using blockchain as an auditable registry for local power trading and distribution grid stability, reinforcing ledgers as system-of-record components in local market design. On the compliance side, Energy Web completed the EU LIFE Clean Energy Transition InEExS project (July 2026), demonstrating packaged, verifiable service models aligned with energy efficiency obligation programs such as EED Article 7, and creating a pathway for blockchain-backed measurement, reporting, and verification alongside certificate registries governed by emerging IEEE and ITU-T specifications.
Recent Industry Developments in Blockchain In Energy Market
- June 2026: Accenture partnered with TEPCO Solution Advance to embed AI and digital capabilities into TEPCOs operating model, positioning a utility-facing transformation program that can be extended to trusted data sharing and auditable workflows used in flexibility and certificate programs. The effort signals continued convergence of enterprise platforms (cloud, data, AI) with ledger-based assurance where utilities need verifiable settlement and reporting.
- April 2026: Accenture joined the Hedera Council, expanding the companys role in governing an enterprise-focused public distributed ledger and shaping how regulated-use cases are implemented. Council participation strengthens tooling and governance options for tokenization and compliance-grade workflows that energy market participants use for certificates, carbon accounting, and settlement automation.
- March 2026: SAP launched SAP Distributed Energy Resources on SAP Business Technology Platform to provide a data backbone for flexibility markets, including energy sharing and virtual power plants. The product move brings blockchain-adjacent trust and audit needs into mainstream utility and enterprise software stacks by emphasizing interoperable data orchestration for distributed assets.


Blockchain In Energy Market Report Scope and Research Methodology
Market Definition and Coverage
This market covers revenues generated from blockchain technology used inside energy sector workflows. The blockchain layer supports transactions, records, automation, identity, and compliance activities tied to energy value chains.
Scope exclusions: it excludes generic IT services and broad enterprise software that do not have a clear blockchain-enabled energy use case.
Segments Covered in This Report
- By Application
- Payments
- Smart Contracts
- Digital Identities
- Governance, Risk and Compliance (GRC)
- Other Applications
- By Geography
- North America
- United States
- Canada
- Europe
- United Kingdom
- Germany
- Netherlands
- Rest of Europe
- Asia-Pacific
- Japan
- Australia
- New Zealand
- Rest of APAC
- South America
- Brazil
- Mexico
- Rest of South America
- Middle East and Africa
- United Arab Emirates
- Israel
- Rest of Middle East and Africa
- North America
Data Sources, Market Sizing, and Validation
Desk Research
Desk research started with public baselines that can be checked and updated, such as energy supply and demand series from the International Energy Agency and the US Energy Information Administration. We also reviewed electricity and renewables statistics from the International Renewable Energy Agency, plus standards and policy signals from organizations such as the International Organization for Standardization and the European Commission.
To link technology adoption to energy sector needs, we reviewed peer-reviewed papers and conference publications on blockchain use in power markets, traceability, and settlement. We then cross-referenced association websites and reputable press coverage of pilots. Company filings, annual reports, and investor presentations were used to confirm which energy use cases are being commercialized and how offerings are packaged. In addition, paid subscriptions for company financials and intelligence, news and financials feeds, patent databases, and global contract and tender data were used selectively to cross-check timing, product focus, and deal activity. These desk sources are illustrative, and we also used other public references to clarify specific data points and validate assumptions.
Primary Interviews and Surveys
Primary work focused on interviews and surveys with energy utilities, oil and gas operators, renewable developers, grid and market operators, and solution teams involved in blockchain programs, so the practical adoption drivers and barriers could be understood. Because the scope is global, discussions were balanced across APAC, EMEA, and the Americas to check regional differences in regulation, market structure, and digitization maturity.
Distribution of primary research fieldwork respondents
| Company type | Respondent position | Region |
|---|---|---|
| Top tier: 39% | CXOs: 21% | APAC: 37% |
| Mid tier: 40% | Functional/Unit leaders: 30% | EMEA: 37% |
| Smaller Players: 21% | Managers: 49% | Americas: 26% |
Market-Sizing & Forecasting
Sizing began with a top-down build, where the addressable demand pool was reconstructed from energy digitization spend signals and then filtered by blockchain-relevant use cases across payments, smart contracts, digital identities, governance, and risk and compliance. The totals were then corroborated using selective bottom-up checks, including sampled deployment pricing, active project volumes referenced in tenders and announcements, and supplier and channel feedback to reduce over-counting.
The largest inputs came from the pace of utility digital transformation programs, the number and maturity of P2P energy trading and settlement initiatives, EV charging network digitization trends, renewable certificate and traceability needs, and regulatory or market rule changes that affect permissioned ledger adoption. Where a bottom-up view was thin for specific regions or use cases, the model used proxy indicators, such as adjacent software adoption rates, and confirmed adjustment factors during primary discussions.
For forecasting, scenario analysis was applied so high and low cases could be built around adoption speed, policy support, and project conversion rates, then consolidated into a base case. Growth rates were checked against expert expectations by region, and the final curve was aligned to realistic rollout cycles in energy markets rather than assuming instant scaling.
Data Validation & Update Cycle
Estimates were validated through cross-checks between model outputs and independent signals, such as deal activity, patenting direction, and the pipeline of pilots moving into production. Outliers were investigated, and when variance was large, follow-up outreach was used to re-check definitions, pricing assumptions, and what was actually counted as blockchain related revenue.
Before sign-off, the model and assumptions went through multi-step internal reviews to remove arithmetic and logic errors, and to ensure the narrative matched the data. Reports are refreshed annually, and interim updates are made when material events occur, such as regulation shifts or major adoption announcements. Just before delivery, a final pass is completed so the latest public information is reflected in the numbers.
Mordor Intelligence's the Energy Sector Global Blockchain Market Estimate Compared With Other Published Estimates
Published market sizes for blockchain in the energy sector can look far apart because authors do not always count the same revenue types and they often use different starting years. Differences also come from how quickly adoption is assumed to move from pilots into scaled deployments, which shifts the near-term base value.
The benchmark table shows a noticeable spread that mainly traces back to scope boundaries, application coverage, and the forecast window. In Mordor Intelligence's model, the market is counted across specific energy use cases such as payments, smart contracts, digital identities, and governance and compliance, with value captured as commercially realized revenues by geography, rather than broad blockchain spending.
Benchmark comparison
| Source | Market Size | Gaps in Research Methodology |
|---|---|---|
| Mordor Intelligence | USD 3.46 B (2026) | |
| Industry Publisher A | USD 4.40 B (2025) | Uses an earlier base year and a longer 2026 to 2036 horizon, and the scope appears to bundle a wider set of applications (including oil and gas, operations, and security), which can pull in adjacent software and services spend. |
| Research Portal B | USD 2.36 B (2024) | Starts from a smaller 2024 base and structures the market by components and end users, which can undercount platform and transaction related revenue if pilots and non-utility use cases are treated as outside the core market. |
Taken together, the comparison suggests that the most important step is agreeing on what revenue is truly tied to blockchain enabled energy workflows and when it is recognized. By keeping the scope tied to defined use cases and checking adoption pacing with repeatable indicators, the sizing stays easier to audit and update as new deployments move from pilots into real spend.


Key Questions Answered in the Report
What is the current size of the blockchain in energy sector market?
The market is valued at USD 3.46 billion in 2026 and is projected to grow to USD 9.92 billion by 2031.
Which application segment holds the largest market share?
Payments and peer-to-peer energy trading command 37.30% of 2025 revenue.
Which region is expanding the fastest?
Asia-Pacific is forecast to register a 27.10% CAGR between 2026 and 2031.
What is the biggest driver of adoption?
Variable tariffs paired with blockchain-enabled P2P trading contribute the highest positive impact on projected growth, at +6.2% of CAGR.
How are scalability issues being addressed?
Energy-efficient proof-of-stake networks and parallel-execution architectures are boosting throughput while slashing transaction energy use.
Who are the prominent players in the competitive lands
Key participants include IBM, SAP, Power Ledger, LO3 Energy, KEPCO and Alectra, alongside protocol developers such as Solana
Page last updated on:





