
Market Overview
| Study Period | 2020 - 2031 |
|---|---|
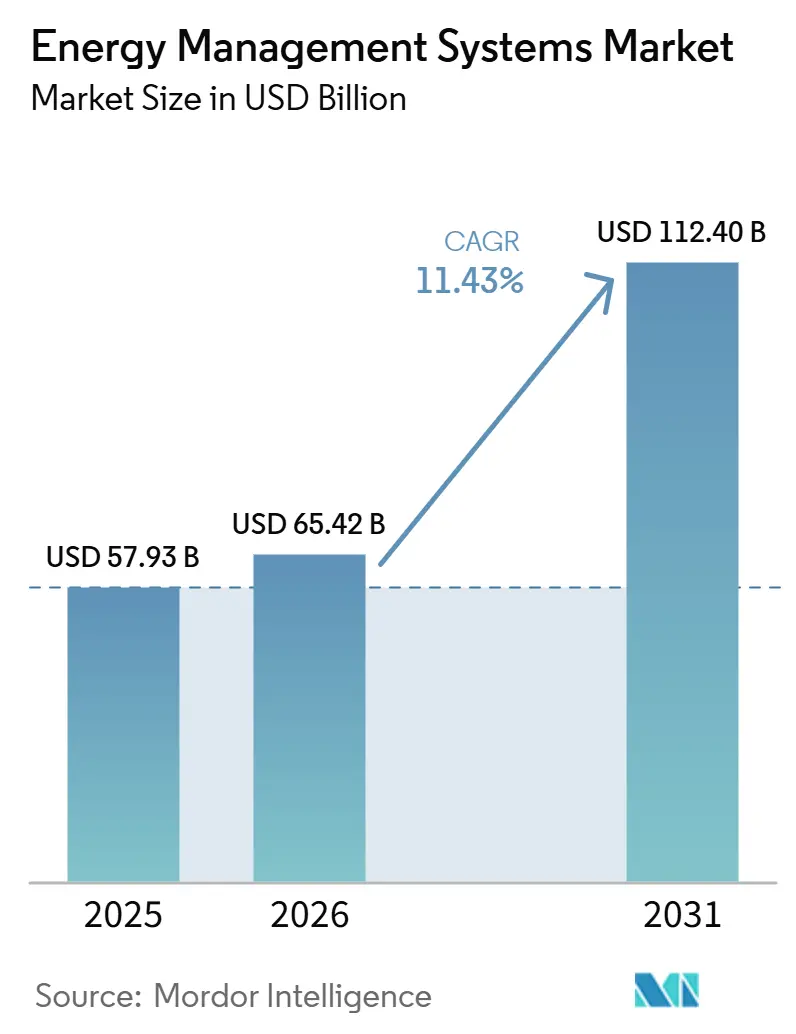
| Market Size (2026) | USD 65.42 Billion |
| Market Size (2031) | USD 112.40 Billion |
| Growth Rate (2026 - 2031) | 11.43 % |
| Fastest Growing Market | Asia Pacific |
| Largest Market | North America |
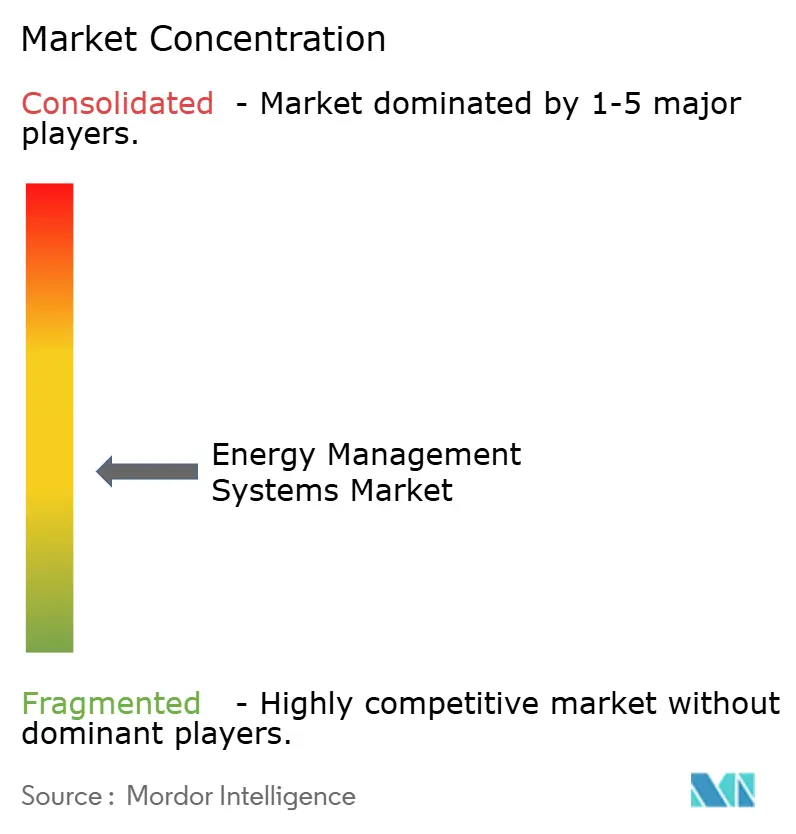
| Market Concentration | Medium |
Major Players *Disclaimer: Major Players sorted in no particular order Image © Mordor Intelligence. Reuse requires attribution under CC BY 4.0. | |
Energy Management Systems Market Analysis by Mordor Intelligence
The Energy Management Systems Market size is projected to expand from USD 57.93 billion in 2025 and USD 65.42 billion in 2026 to USD 112.40 billion by 2031, registering a CAGR of 11.43% between 2026 to 2031.
The surge reflects stricter decarbonization rules, rapid smart-grid deployment, and mounting corporate net-zero targets that elevate real-time energy optimization from optional to indispensable. Utilities are rolling out advanced metering infrastructure (AMI) at scale, giving operators the granular data they need to pair with AI-driven analytics for self-healing grid functions and lower operating costs. Commercial real-estate owners face mandatory net-zero building codes starting in 2026, driving a jump in demand for connected HVAC, lighting, and controls platforms. Meanwhile, firms signing large renewable power-purchase agreements require integrated systems capable of hourly tracking, certificate management, and carbon accounting. Beyond climate policy, volatile commodity prices and growing carbon costs sharpen the economic case for the Energy Management Systems market, as enterprises chase double-digit savings and resilience against supply-side shocks.
Key Report Takeaways
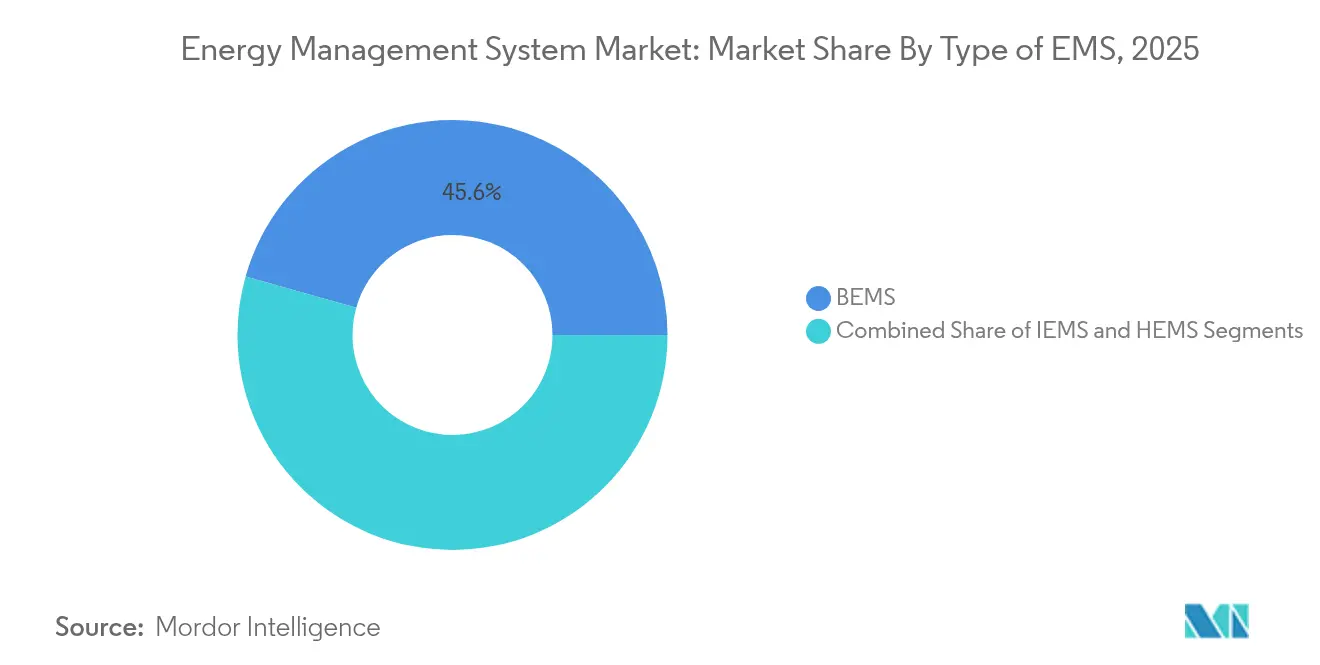
- By EMS type, Building Energy Management Systems led with 45.62% of Energy Management Systems market share in 2025, while Home Energy Management Systems are projected to expand at a 16.85% CAGR through 2031.
- By end user, the manufacturing segment held 31.05% share of the Energy Management Systems market size in 2025; healthcare facilities record the highest projected CAGR at 16.02% to 2031.
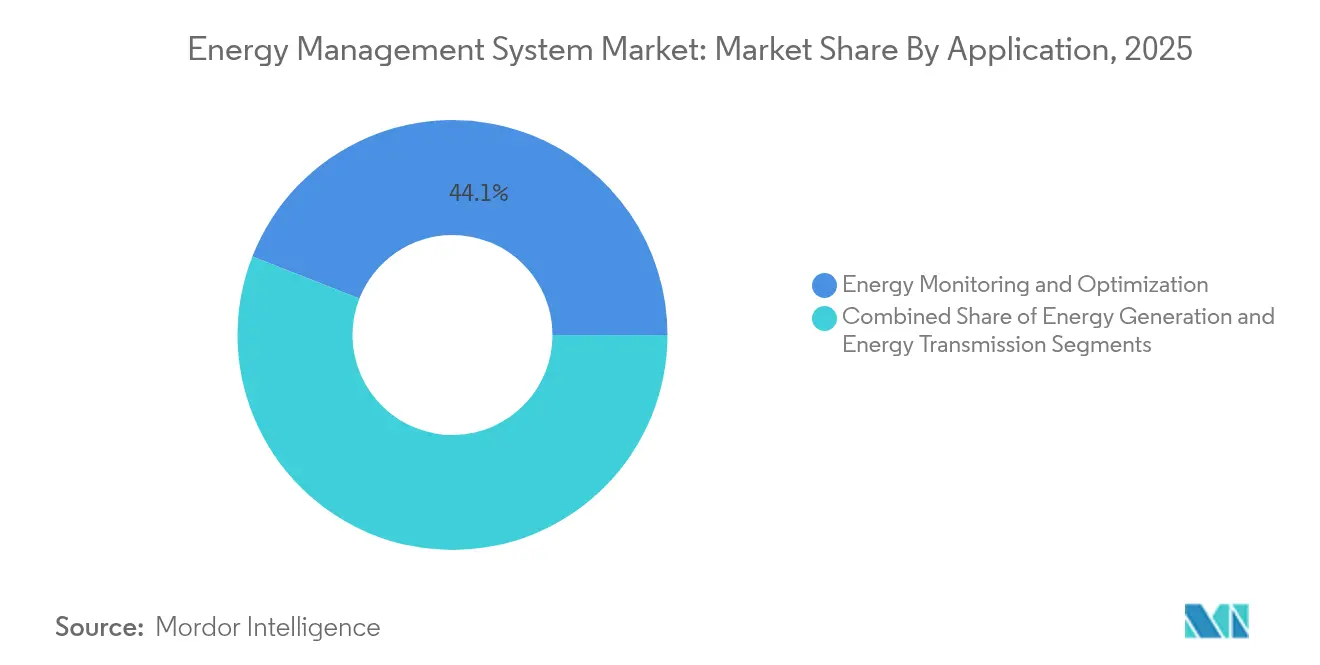
- By application, energy monitoring and optimization commanded a 44.05% share of the Energy Management Systems market size in 2025 and is advancing at a 15.60% CAGR through 2031.
- By component, software solutions captured 50.72% revenue share in 2025, whereas services exhibit the fastest growth at 15.61% CAGR to 2031.
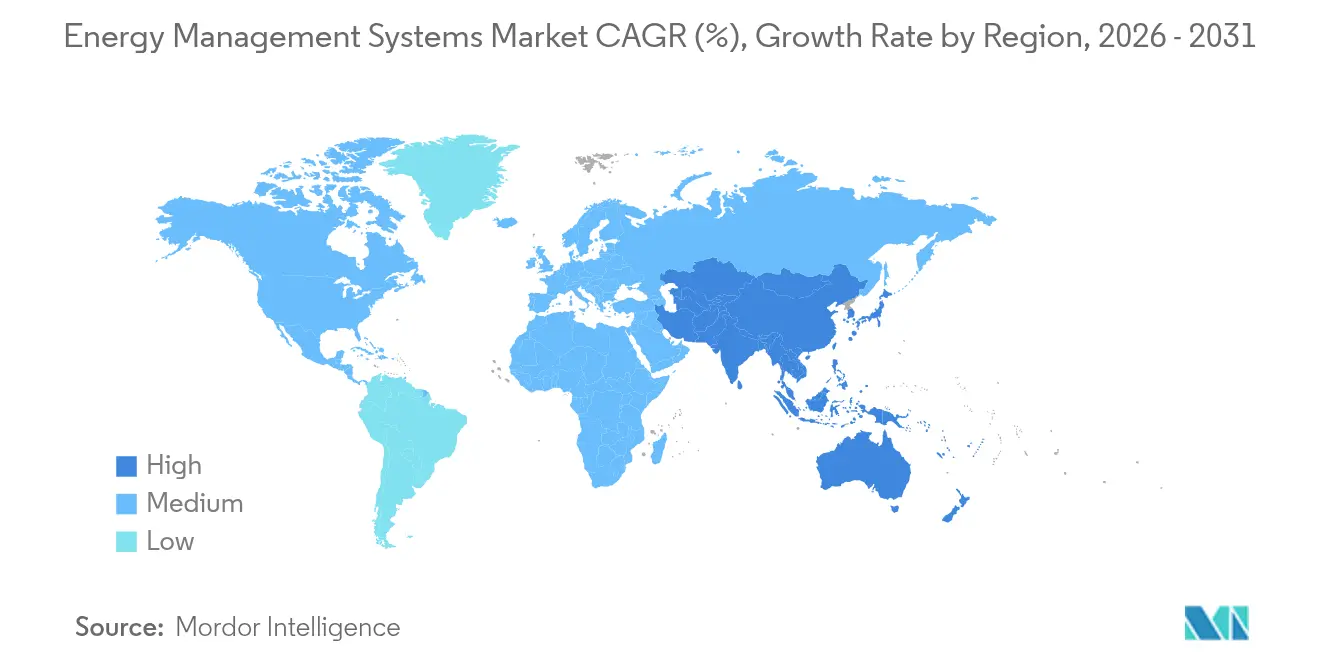
- By region, North America maintained a 35.18% share of the Energy Management Systems market in 2025; Asia-Pacific is the fastest-growing region at a 15.88% CAGR to 2031.
Note: Market size and forecast figures in this report are generated using Mordor Intelligence’s proprietary estimation framework, updated with the latest available data and insights as of 2026.
Market Trends and Insights
Drivers Impact Analysis of Energy Management Systems Market*
| Driver | (~) % Impact on CAGR Forecast | Geographic Relevance | Impact Timeline |
|---|---|---|---|
| Rapid roll-out of AMI | +3.2% | Global (North America, EU spearhead) | Medium term (2-4 years) |
| Mandatory net-zero building codes from 2026 | +2.8% | North America, EU; APAC follow | Short term (≤ 2 years) |
| AI-powered predictive maintenance | +2.1% | Global; early uptake in developed markets | Medium term (2-4 years) |
| Corporate PPAs requiring granular data | +1.9% | Global; concentrated in North America, EU | Long term (≥ 4 years) |
| Blockchain P2P energy trading pilots | +1.4% | EU, APAC; limited North America | Long term (≥ 4 years) |
| Source: Mordor Intelligence | |||


Rapid Roll-out of Advanced Metering Infrastructure Transforms Grid Intelligence
Utilities across mature economies accelerated AMI programs in 2024, installing millions of smart meters that stream interval data to cloud analytics engines. Eversource finished a 1.3 million-meter project spanning Massachusetts and Connecticut, while National Grid connected 3.4 million endpoints in the Northeast. The data feed underpins automated demand response, outage self-healing, and predictive load forecasting, all core modules in modern Energy Management Systems market platforms.[1]Eversource, “Advanced Metering Infrastructure,” eversource.com AI algorithms re-route power within seconds, cutting restoration times and trimming distribution losses. As distribution operators monetize grid services and accommodate renewables, AMI forms the essential layer linking field assets with cloud-based optimization.
Mandatory Net-Zero Building Codes Accelerate Commercial EMS Adoption
Jurisdictions such as New York City, Washington State, and California enacted rules that push large buildings toward net-zero operations, starting as early as 2026. Local Law 97 requires facilities over 25,000 ft² to cut emissions 40% by 2030, with steep fines for non-compliance. California’s Title 24 updates stipulate advanced controls and measurement, turning Energy Management Systems market deployments from voluntary upgrades into compliance necessities.[2]NYC Mayor’s Office, “Local Law 97 Compliance Guide,” nyc.gov Similar mandates ripple across Canada and the EU, expanding addressable demand for integrated HVAC, lighting, and renewable-ready platforms.
AI-Powered Predictive Maintenance Revolutionizes Utility Operations
Research from the University of Texas at Dallas demonstrated a graph-reinforcement-learning model that reconfigures distribution grids in microseconds, warding off outages and lowering OPEX by 15-25%. Coupled with growing IoT sensor penetration, utilities and heavy-industry sites can shift from time-based to condition-based maintenance, lengthening asset life and deferring capex. The Energy Management Systems market taps these algorithms to schedule equipment service, allocate workforce, and balance network loads—delivering quantifiable ROI that justifies enterprise-wide rollouts.
Corporate Power Purchase Agreements Drive Granular Energy Data Requirements
Corporate renewable PPAs surpassed 46 GW in 2024. Buyers committed to Science-Based Targets now demand hourly matching of consumption with clean power, as well as automated reporting for CDP and SEC climate disclosures. Energy Management Systems market vendors respond by integrating certificate registries, battery dispatch models, and tariff engines into unified dashboards that harmonize operations and sustainability accounting for multinationals like Microsoft and Google.
Restraints Impact Analysis of Energy Management Systems Market*
| Restraint | (~) % Impact on CAGR Forecast | Geographic Relevance | Impact Timeline |
|---|---|---|---|
| High up-front system integration costs | -2.4% | Global; acute in emerging markets | Short term (≤ 2 years) |
| Legacy OT/IT interoperability gaps | -1.8% | North America, EU; aging sites | Medium term (2-4 years) |
| Cyber-security liability | -1.2% | Global; stringent in developed markets | Long term (≥ 4 years) |
| Shortage of EMS-skilled technicians | -0.9% | APAC, MEA; limited LATAM | Long term (≥ 4 years) |
| Source: Mordor Intelligence | |||
High Up-Front System Integration Costs Constrain SME Market Penetration
Comprehensive deployments still command USD 50,000–500,000, a hurdle for cash-constrained facilities. Hardware, integration, and training extend payback to 18–36 months, delaying adoption in small enterprises. Energy-as-a-Service subscriptions now re-cast capex as opex, lowering entry barriers; Iris Ohyama’s 2025 launch of the ENEverse cloud suite typifies that pivot, bundling sensors, analytics, and remote operations into a no-hardware model.
Legacy OT/IT Interoperability Gaps Complicate Brownfield Deployments
Older plants rely on proprietary protocols and siloed data historians. Integration therefore demands gateways, edge controllers, and protocol translation, inflating project cost and risk. ABB and other automation majors ship universal I/O kits and low-code mapping tools that shrink retrofit timelines, yet brownfield complexity remains a drag on the Energy Management Systems market roll-out pace.[3]ABB, “Edge Gateway Integration White Paper,” abb.com
*Our forecasts treat driver/restraint impacts as directional, not additive. The impact forecasts reflect baseline growth, mix effects, and variable interactions.
Energy Management Systems Market Segment Analysis
By Type of EMS:
Building Systems Lead While Residential AcceleratesBuilding Energy Management Systems capture the largest slice of the Energy Management Systems market at 45.62% in 2025. Tighter codes, tenant sustainability reporting, and the premium on healthy indoor environments keep commercial campuses investing in advanced controls that trim 25–40% of utility spend. Home solutions post the fastest trajectory, rising at a 16.85% CAGR as rising electricity tariffs, smart-appliance penetration, and utility demand-response incentives nudge households toward voice-controlled thermostats and automated EV-charger scheduling. Integrated platforms now fuse occupancy sensors, PV inverters, and battery dispatch to create self-balancing nanogrids. Suppliers differ on architecture—edge hubs versus cloud-first—but all route data into AI engines for real-time optimization, broadening the Energy Management Systems market addressable base.
Recent advancements illustrate the shift from rule-based automation to predictive orchestration. C3.ai models combine physics-based equipment libraries with machine learning to anticipate load peaks and pre-condition HVAC for minimal energy intensity. Carrier’s BluEdge Command Center streams chiller-level data to remote engineers who tweak set points in minutes, achieving double-digit savings without on-site staff. The result is a feedback loop: verified savings fund further retrofits, cementing long-term service contracts that anchor vendor revenue.


By End User:
Manufacturing Dominance Challenged by Healthcare GrowthManufacturing facilities accounted for 31.05% of Energy Management Systems market share in 2025 owing to energy bills that routinely reach 20% of operating costs. Sectors such as cement, steel, and chemicals leverage high-speed sensors and digital twins to orchestrate furnaces, compressors, and process lines, seeking every kilowatt of productivity. Nevertheless, the healthcare vertical is expanding at a 16.02% CAGR. Hospitals run 24/7, with stringent humidity and temperature thresholds, making them ideal candidates for AI-guided HVAC and boiler sequencing. Apollo Hospitals reports 30% utility savings after deploying a cloud EMS that integrates medical equipment scheduling and cogeneration controls.
Power utilities, the second-largest end-user, rely on EMS modules for demand forecasting and renewables integration. IT and telecom operators apply similar logic inside data centers where cooling loads approach 40% of total consumption. As server densities jump with AI workloads, advanced airflow modeling and liquid-cooling optimization enter mainstream facility roadmaps. Residential and commercial mixed-use complexes round out demand, driven by net-metering policies and the urge to monetize rooftop solar.
By Application:
Monitoring Dominance Reflects Optimization PriorityEnergy monitoring and optimization occupied 44.05% of the Energy Management Systems market size in 2025 and is slated to grow at 15.60% CAGR as firms embrace continuous improvement loops. Sensors feed second-by-second consumption profiles into analytics dashboards that benchmark sites, flag anomalies, and auto-dispatch controls. Generation-side EMS modules coordinate rooftop solar, batteries, and diesel gensets to shave peaks and maximize self-consumption. Transmission-oriented features, such as fault-location and automated switching, support utilities pursuing reliability metrics and outage-minute reductions.
Convergence is accelerating. Schneider Electric’s One Digital Grid melds planning, operations, and customer engagement into one platform. Utilities can model DER hosting capacity, simulate storm impacts, and push tariff signals to behind-the-meter assets in a closed loop. The hybrid-cloud stack ensures data continuity from substation relays to mobile apps, helping regulators accept digital evidence for outage reporting.
By Component:
Software Leadership Drives Service GrowthSoftware maintained 50.72% revenue share in 2025 because algorithms and user experience dictate value creation. Edge gateways, IoT sensors, and controllers are commoditizing, but the machine-learning models that forecast, diagnose, and prescribe actions remain proprietary differentiators. Services, however, are gaining fastest at 15.61% CAGR as clients outsource not just installation but ongoing optimization. Subscription bundles wrap platform licenses with 24/7 network operations centers that fine-tune parameters, respond to alarms, and verify savings—solving the skilled-labor shortage outside OECD markets.
Market leaders push toward outcome-based contracts. Iris Ohyama offers guaranteed-savings models paid from realized utility cuts, while ABB’s Energy-Efficiency-as-a-Service targets industrial multinationals that prefer predictable monthly fees over sporadic capex. These shifts expand the Energy Management Systems market by drawing in customers previously deterred by capital constraints.
Geography Analysis
North America Energy Management Systems Market
North America retains its pole position with 35.18% of Energy Management Systems market revenue in 2025. Federal funding through the Inflation Reduction Act and state tax credits catalyze metering, EV-charging, and building-retrofit projects. Utilities such as Eversource and National Grid added millions of smart endpoints in 2024, laying the data fabric that underpins advanced analytics. Schneider Electric responded with a USD 700 million expansion across U.S. plants to localize production of switchgear, microgrid controllers, and software R&D, signalling confidence in policy stability and customer demand.
Europe Energy Management Systems Market
Europe follows closely, propelled by the European Green Deal and Fit-for-55 package that stipulate 55% emission cuts versus 1990 by 2030. Member states embed digital-building requirements in local codes, fostering robust demand for integrated building analytics. Germany’s roll-out of P2P trading sandboxes and the Netherlands’ aggressive heat-pump incentives showcase regulatory breadth. Investment appetite surfaced when TPG paid EUR 6.7 billion for Techem, attracted by recurring revenues from sub-metering and efficiency services. Utilities accelerate grid-edge digitization to handle variable renewable flows, further enlarging the Energy Management Systems market.
APAC Energy Management Systems Market
Asia-Pacific is the growth engine with a projected 15.88% CAGR. China invests in ultra-high-voltage transmission and AI-enhanced dispatch centers to balance its 1,200 GW of wind–solar capacity planned by 2030. Japan’s subsidies for Home EMS and Building EMS, backed by JPY 4 billion earmarked in 2025, bolster vendor pipelines. India’s Smart Cities Mission embeds EMS requirements in tenders for public buildings and street-lighting networks, while Southeast Asian economies seek grid-stability solutions to cope with rapid rooftop-solar adoption. Multinationals setting up regional manufacturing hubs specify EMS from day one, accelerating greenfield demand.

Regulatory Landscape
Energy management system adoption is increasingly shaped by energy-efficiency mandates and compliance frameworks that move organizations from periodic audits toward continuous monitoring and verified performance. In the European Union, Directive (EU) 2023/1791 stands as the governing energy-efficiency framework, with the previous Directive 2012/27/EU formally repealed on October 12, 2025, reinforcing requirements that elevate structured energy management programs for large enterprises and public-sector entities.
Across regions, recognized standards such as ISO 50001 remain a common reference point used by regulators and programs to define credible energy management practices and auditability. The IEA has highlighted the recurring policy package used globally (regulation, information, incentives), while also noting regulatory volatility in 2025 around Minimum Energy Performance Standards (MEPS) changes across multiple countries. This volatility increases the need for EMS platforms that can adapt to differing compliance evidence and reporting requirements by jurisdiction.
Value Chain Analysis
The value chain spans sensing and control hardware (smart meters, submeters, sensors, controllers, gateways), communications and data infrastructure (on-premise and edge compute, cloud platforms, cybersecurity tooling), core software (monitoring, analytics, optimization, forecasting, DER orchestration), and services (engineering, integration, commissioning, managed operations, and performance contracting). Utilities and building owners increasingly procure end-to-end stacks from large automation and electrical vendors, while industrial customers often combine OT suppliers (drives, PLCs, SCADA) with analytics, carbon-accounting, and reporting layers that connect to enterprise systems.
Interoperability and standardization influence supplier selection, integration cost, and time-to-value. IEC 63402-1:2025 (published June 2025) specifies requirements and an architecture for customer energy management systems between the Point of Common Coupling and smart devices in residential or commercial premises, supporting multi-vendor ecosystems. In Europe, the European Commission issued Recommendation (EU) 2024/2002 (July 2024) linked to Directive (EU) 2023/1791 and emphasized the role of standards such as ISO 50001 for high-quality energy management systems. Recommendation (EU) 2024/2476 (September 2024) addressed energy services market transparency through model contracts, reinforcing the services layer (audits, ESCO delivery, and ongoing optimization) as a key route to deployment.
Competitive Landscape
The Energy Management Systems market remains moderately fragmented, with the top five suppliers controlling roughly 45% of global revenue. Incumbent automation companies—Schneider Electric, Siemens, ABB, and Honeywell—bundle hardware, software, and services into end-to-end offers, leveraging global channels and balance sheets to win multi-region deals. Acquisition pipelines are robust: ABB bought Siemens’ wiring-accessories arm in China to deepen its smart-building stack, and Trane added BrainBox AI to embed self-learning HVAC control in its chiller fleet. These moves illustrate a race to infuse AI into legacy portfolios and secure data access at the edge.
Specialist entrants target niches. Edgecom Energy applies generative AI to flatten industrial peaks, while blockchain startups pilot secure settlement layers for micro-trades of rooftop-solar output. Device makers such as Tesla file patents on hierarchical energy-distribution grids that automate DER orchestration, foreshadowing next-generation architectures. Competitive intensity therefore swivels from pure features to ecosystems: vendors that curate open APIs, app marketplaces, and developer communities stand to lock in partners and expand use cases.
Pricing models shift as well. Subscription, outcome-based, and revenue-sharing contracts spread risk between provider and customer, appealing to CFOs wary of capex. Vendors differentiate by cybersecurity posture, given rising liability for critical-infrastructure incidents. Firms able to certify to ISA/IEC 62443 and maintain 24/7 security operation centers gain an advantage, especially in healthcare, finance, and utility verticals where downtime tolerances are minimal. Collectively, these dynamics anchor a vibrant yet consolidating Energy Management Systems market.
Energy Management Systems Industry Leaders
IBM Corporation
Rockwell Automation, Inc.
General Electric
Schneider Electric
Eaton
- *Disclaimer: Major Players sorted in no particular order
Energy Management Systems Market Companies Covered in this Report
- Schneider Electric
- Siemens AG
- Honeywell International Inc.
- ABB Ltd.
- General Electric
- Eaton Corporation
- Rockwell Automation Inc.
- Johnson Controls
- IBM Corporation
- Oracle Corporation
- SAP SE
- Cisco Systems
- Enel X
- Autogrid Systems
- Itron Inc.
- Honeywell Smart Energy
- Mitsubishi Electric
- Yokogawa Electric
- Tendril (Uplight)
- WAGO Kontakttechnik

Market Opportunities and Future Outlook
Compliance-driven demand continues to open whitespace for standardized, certifiable, and audit-ready EMS deployments, especially where regulations shift organizations from episodic audits to fully functional management systems. Germanys Energy Efficiency Act (EnEfG) requires companies to implement fully functional energy or environmental management systems (ISO 50001 or EMAS) by June 30, 2026, pushing demand for platforms that can sustain continuous data capture, governance workflows, and verifiable reporting across multi-site operations.
Standards-led interoperability and API modernization create opportunities for vendors that reduce integration friction across heterogeneous assets, including grid, DER, buildings, and industrial processes. In June 2026, IEC published the IEC 61970:2026 series for Energy Management System Application Program Interfaces (EMS-API), supporting utility-grade data exchange and integration architectures. Asset operators are also adopting software layers to coordinate renewables and storage portfolios as unified fleets, including Powernaut completing deployment of its Energy Operations Workspace across a 350 MW solar and battery storage portfolio for Dutch IPP DSG in June 2026. This reinforces demand for EMS capabilities spanning forecasting, dispatch coordination, and operational workflows across distributed sites.
Recent Industry Developments in Energy Management Systems Market
- June 2026: Schneider Electric launched EcoCare for Building Management Systems in the US, offering 24/7 monitoring with AI-driven analytics and expert support aligned to predictive maintenance. The move strengthens managed-service delivery in building EMS by bundling software intelligence with ongoing operational support, helping customers maintain performance across dispersed building portfolios.
- November 2025: Schneider Electric unveiled EcoStruxure Foresight Operation, an AI-powered platform designed to unify building and electrical systems for predictive operational intelligence. The launch underscores the shift from point solutions to converged platforms that centralize visibility and control across energy assets, improving the commercial case for enterprise-wide standardization.
- December 2024: Schneider Electric announced new solutions positioned to address energy and sustainability challenges associated with rising AI-driven loads in facilities. This broadened focus on higher-density power and cooling environments increases EMS relevance in data centers and complex commercial sites where energy monitoring and optimization are central to operational continuity.


Energy Management Systems Market Report Scope and Research Methodology
Market Definition and Coverage
For this study, the energy management systems market includes the software, hardware, and related services used to measure, monitor, analyze, and optimize energy use across buildings, industrial sites, homes, and grid-connected operations.
Scope exclusions: Standalone power generation equipment and pure electrical installation work are excluded unless they are sold as part of an energy management system deployment.
Segments Covered in This Report
- By Type of EMS
- Building EMS (BEMS)
- Industrial EMS (IEMS)
- Home EMS (HEMS)
- By End-User
- Manufacturing
- Power and Energy
- IT and Telecommunication
- Healthcare
- Residential and Commercial
- By Application
- Energy Generation
- Energy Transmission
- Energy Monitoring and Optimization
- By Component
- Hardware
- Software
- Services
- By Geography
- North America
- United States
- Canada
- Mexico
- South America
- Brazil
- Argentina
- Chile
- Rest of South America
- Europe
- Germany
- United Kingdom
- France
- Italy
- Spain
- Netherlands
- Russia
- Rest of Europe
- Asia Pacific
- China
- India
- Japan
- South Korea
- ASEAN
- Rest of Asia Pacific
- Middle East and Africa
- Middle East
- GCC (Saudi Arabia, UAE, Qatar, etc.)
- Turkey
- Rest of Middle East
- Africa
- South Africa
- Nigeria
- Kenya
- Rest of Africa
- Middle East
- North America
Data Sources, Market Sizing, and Validation
Desk Research
Desk inputs were first used to frame the demand pool and align definitions across regions and end users. We referenced public and official sources such as the International Energy Agency (IEA), the US Energy Information Administration (EIA), the US Department of Energy (DOE), Eurostat, and the International Organization for Standardization (ISO) to capture energy baselines, sector energy use patterns, and governance signals that influence adoption.
To translate those signals into a workable market model, we also reviewed company annual reports, investor presentations, association websites, and reputable press coverage on building efficiency programs, smart grid rollouts, and industrial digitization. In parallel, paid subscriptions covering company financials and intelligence, news and financials, and patent databases were used selectively to cross-check product positioning and investment intensity. The desk sources listed here are illustrative only, and many other public references were used to collect data, validate assumptions, and clarify gaps.
Primary Interviews and Surveys
Primary work focused on validating how energy management systems are bought, deployed, and priced across commercial buildings, industrial facilities, utilities, and residential channels, then confirming the split between software, hardware, and services. We also stress-tested assumptions on upgrade cycles, cloud adoption, and typical project scope, with coverage spread across APAC, EMEA, and the Americas so regional policy and energy price differences were captured.
table_heading must match the primary respondent-distribution label used in this study.
Distribution of primary research fieldwork respondents
| Company type | Respondent position | Region |
|---|---|---|
| Top tier: 36% | CXOs: 15% | APAC: 43% |
| Mid tier: 49% | Functional/Unit leaders: 28% | EMEA: 33% |
| Smaller Players: 15% | Managers: 57% | Americas: 24% |
Market-Sizing & Forecasting
Sizing started with a top-down build where energy consumption by sector, the addressable building and industrial base, and the pace of smart grid and monitoring deployments were used to reconstruct the potential EMS demand pool. Once the pool was set, penetration rates and average spend per site were applied by use case, and then converted into value across software, hardware, and services.
To keep totals realistic, the outputs were corroborated using selective bottom-up approximations, such as sampled ASP x volume checks, supplier and channel feedback on deal sizes, and service attachment rates. Electricity price pressure and demand charges were among the most sensitive inputs, alongside energy intensity trends in manufacturing and commercial buildings, rollout of smart meters and grid automation, the share of cloud-based deployments, and the typical retrofit versus new-build mix. Where bottom-up signals were thin for smaller countries, proxies were applied using energy use per facility and income or industrial output, followed by adjustment after interview feedback.
For forecasting, scenario analysis was used, since adoption can move faster or slower depending on efficiency incentives, grid modernization funding, and enterprise decarbonization targets. Assumptions for penetration and ASP progression were refreshed with primary feedback, then stress-tested for policy delays and macro shifts so the final trajectory stayed plausible.
Data Validation & Update Cycle
Validation was done through triangulation across independent checks so the final market size could be traced back to clear demand and spending drivers. We compared the model against signals such as regional energy spending trends, deployment activity around smart metering and building upgrades, and the expected split of software, hardware, and services. Where large variances appeared, we investigated the drivers before sign-off.
A multi-step analyst review was used to catch unit errors, currency timing issues, and double counting between components and services. If a mismatch appeared, follow-ups were triggered with interviewees to re-confirm adoption rates, pricing bands, and scope boundaries. Reports are refreshed annually, with interim updates when material events occur, and a final pre-delivery review is completed so the published view stays current.
Mordor Intelligence's Energy Management Systems Market Size Measured Against Other Published Estimates
Published market sizes for energy management systems often diverge because the product scope is not the same across studies, and because the base year and currency timing can shift reported values. Differences also show up when one estimate leans more heavily on enterprise software spend, while another includes broader building automation layers under the same label.
Key gap drivers in this market usually come from what is counted as an energy management system (pure monitoring and optimization versus wider automation suites), whether services are treated as one-time implementation or also include recurring managed services, and how deployment moves toward cloud and is priced over time. By tracking site-level adoption signals, checking component splits, and refreshing currency conversion timing, Mordor Intelligence places the 2026 value at USD 73.49 B, which can look higher than narrower software-only totals and still remain below estimates that also count broader automation functions.
Benchmark comparison
| Source | Market Size | Gaps in Research Methodology |
|---|---|---|
| Mordor Intelligence | USD 73.49 B (2026) | |
| Industry Association A | USD 35.90 B (2024) | Anchors sizing in 2024 and can apply a tighter definition of EMS, which may undercount multi-site industrial deployments and recurring service revenue that build over a longer rollout cycle. |
| Global Consultancy B | USD 49.50 B (2024) | Uses 2024 as the stated base year and may weight hardware-led installations differently, so totals shift when service attachment and cloud subscription ramp are not aligned to typical upgrade and retrofit cycles. |
The table mainly shows timing and scope choices at work rather than a single right number. When categories are kept consistent across software, hardware, and services, and the model is tied back to adoption rates and project economics, the result is easier to reproduce and use for planning.


Key Questions Answered in the Report
What is the current size of the Energy Management Systems market?
The Energy Management Systems market size is USD 73.49 billion in 2026 and is projected to reach USD 150.83 billion by 2031.
Which EMS type holds the largest share today?
Uilding Energy Management Systems lead with 45.62% of Energy Management Systems market share in 2025.
Which region is growing fastest for EMS vendors?
Asia-Pacific is forecast to expand at a 15.88% CAGR through 2031, outpacing all other regions.
Why are services growing faster than software or hardware?
Enterprises prefer subscription models that shift capex to opex, driving 15.61% CAGR in managed services and Energy-as-a-Service bundles.
What restrains EMS adoption among smaller facilities?
High integration costs, legacy equipment incompatibility, and limited access to skilled technicians remain key barriers, though cloud subscriptions are lowering entry hurdles.
How do AI-powered EMS platforms improve utility operations?
AI models forecast demand, detect faults, and reroute power automatically, delivering 15–25% OPEX reduction and faster outage recovery for utilities.
Page last updated on:


 Your data is secure and never sold or shared.


