Smart Electric Drive For Electric Vehicles Market Size and Share
Market Overview
| Study Period | 2019 - 2030 |
|---|---|
| Market Size (2025) | USD 3.65 Billion |
| Market Size (2030) | USD 13.65 Billion |
| Growth Rate (2025 - 2030) | 30.19% CAGR |
| Fastest Growing Market | Asia Pacific |
| Largest Market | Asia Pacific |
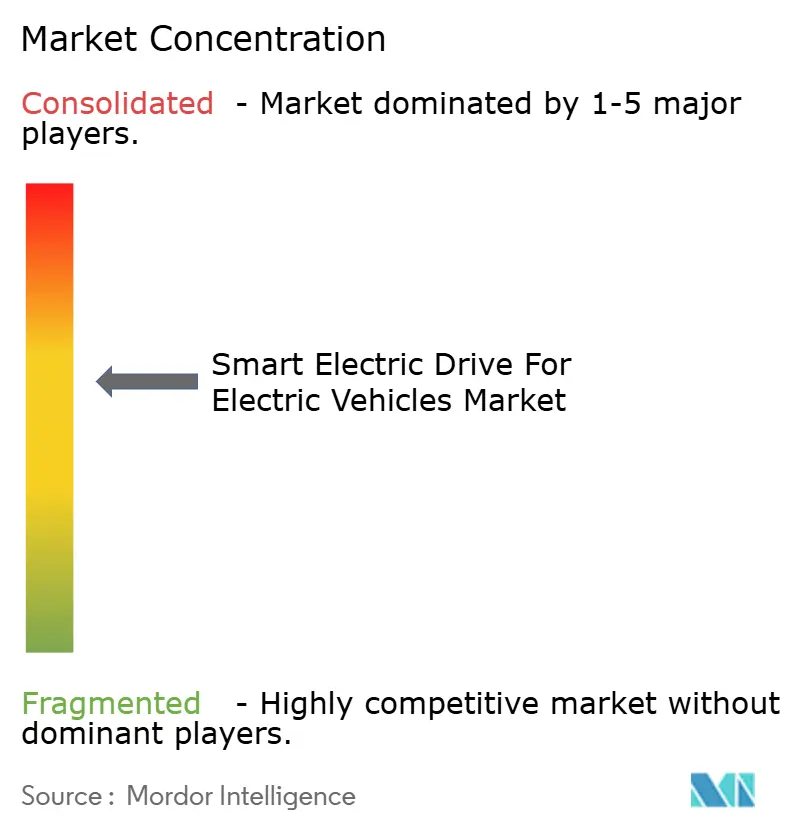
| Market Concentration | Medium |
Major Players *Disclaimer: Major Players sorted in no particular order Image © Mordor Intelligence. Reuse requires attribution under CC BY 4.0. | |
Smart Electric Drive For Electric Vehicles Market Analysis by Mordor Intelligence
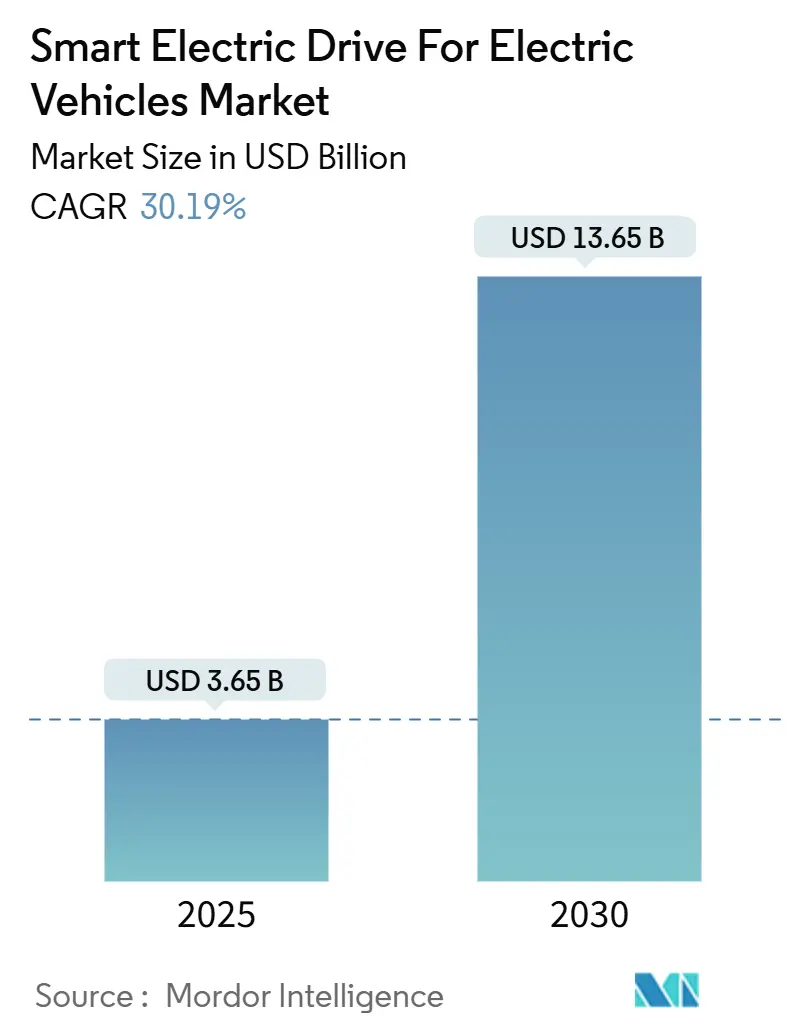
The smart electric drive for electric vehicles market size stands at USD 3.65 billion in 2025 and is projected to expand to USD 13.65 billion by 2030, advancing at a 30.19% CAGR. Regulatory deadlines that phase out internal-combustion engines, falling battery costs, and integration of artificial intelligence into power electronics align to create sustained demand momentum. Wider use of 800 V architectures built around silicon-carbide inverters boosts charging speed and vehicle efficiency, supporting faster consumer adoption. Automakers are shifting investments toward software-defined powertrains, turning the drivetrain into a central node for autonomous and connected-services revenue. Supply-chain control over wide-bandgap semiconductors is emerging as a competitive differentiator that shapes partnership strategies among OEMs and tier-one suppliers.
Key Report Takeaways
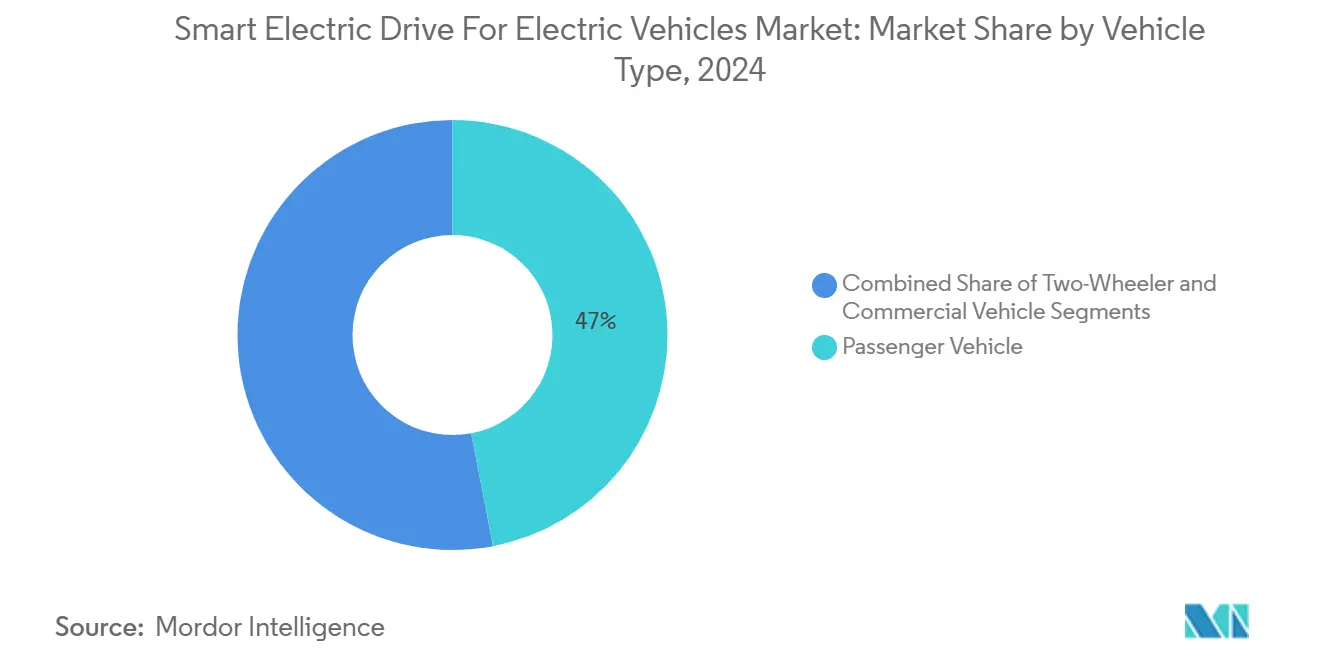
- By vehicle type, passenger vehicles led with 46.98% of the smart electric drive for electric vehicles market share in 2024, while commercial vehicles are projected to record the fastest CAGR at 33.83% through 2030.
- By electric vehicle type, battery electric vehicles captured 59.24% of the smart electric drive for electric vehicles market size in 2024 and are forecasted to advance at a 30.99% CAGR to 2030.
- By drive type, front-wheel-drive systems held 42.18% revenue share of the smart electric drive for electric vehicles market in 2024; all-wheel-drive configurations represent the fastest growing segment at a 30.41% CAGR between 2025 and 2030.
- By component type, motors accounted for 34.73% of the smart electric drive for electric vehicles market size in 2024, whereas power electronics and inverters are expected to expand at the highest CAGR of 32.21% during the forecast period.
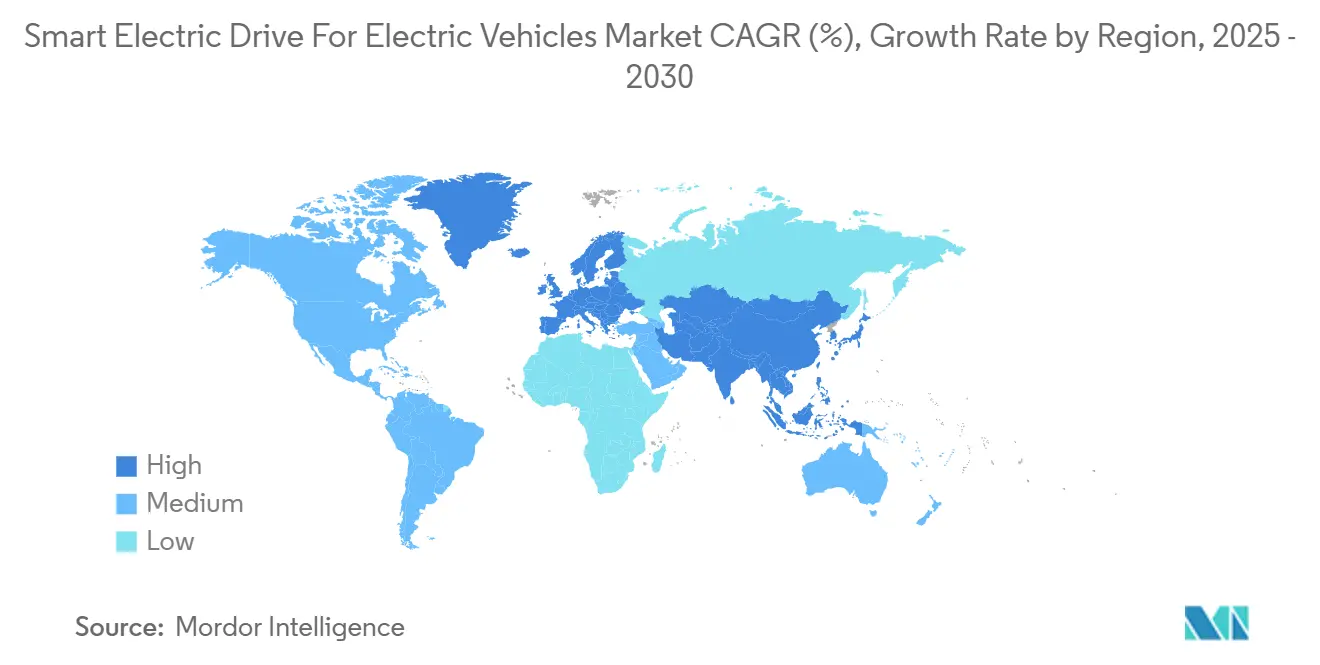
- Asia-Pacific commanded 43.92% of the regional smart electric drive for electric vehicles market share in 2024 and is set to post the strongest 30.83% CAGR through 2030.
Global Smart Electric Drive For Electric Vehicles Market Trends and Insights
Drivers Impact Analysis*
| Driver | (~) % Impact on CAGR Forecast | Geographic Relevance | Impact Timeline |
|---|---|---|---|
| Zero-Emission Vehicles | +6.2% | Global, with EU and North America leading | Medium term (2-4 years) |
| Battery-Cost Decline | +5.1% | Global, APAC manufacturing advantage | Long term (≥ 4 years) |
| 3-in-1 E-Axles | +4.8% | APAC core, spill-over to North America and EU | Medium term (2-4 years) |
| SiC/GaN 800 V Architectures | +4.3% | Global, premium segment first | Long term (≥ 4 years) |
| OTA Efficiency Tuning | +3.1% | North America and EU early adoption | Short term (≤ 2 years) |
| Last-Mile Fleet Electrification | +2.8% | Urban centers globally | Medium term (2-4 years) |
| Source: Mordor Intelligence | |||
Regulatory Push for Zero-Emission Vehicles
Mandates that require zero-emission sales quotas add demand certainty that accelerates procurement decisions for smart electric drivetrains. Canada will prohibit new internal-combustion light-duty sales after 2035, setting clear investment signals for automakers[1]“Zero Emission Vehicle Mandate,” Transport Canada, canada.ca. Similar rules in the European Union and several U.S. states elevate compliance costs for gasoline models, making electric alternatives more attractive. These policies also specify cybersecurity and functional-safety requirements, which directly influence design choices for controllers, inverters, and thermal systems. The result is a synchronized global roadmap that compresses development timelines and favors suppliers with validated platforms.
Battery-Cost Decline and Higher Energy Density
Pack prices moving toward the USD 100 per kWh threshold support total-cost-of-ownership parity for fleet operators. Tesla’s 4680 cylindrical cell boosts energy density by 16% and lowers structural weight, which allows drivetrain designers to downsize cooling hardware while extending range[2]“4680 Battery Cell Technology,” Tesla Inc., tesla.com. Higher density also frees vehicle packaging space, facilitating modular e-axle integration strategies across multiple vehicle classes. As fast-charge capability improves, fleet operators shorten operational downtime, lifting utilization rates and strengthening the economic case for adoption.
Integration of 3-in-1 E-Axles Reducing System Cost
Combining motor, inverter, and reduction gear into a sealed module removes high-voltage cabling and redundant housings, cutting system cost and mass. Suppliers such as Schaeffler report double-digit percentage savings, encouraging OEMs to specify integrated units on next-generation platforms. Assembly efficiency rises because plants install a single component rather than three, while reduced parts count improves reliability metrics. Cost benefits are most pronounced in entry-level passenger cars and light-commercial vehicles where margin sensitivity is high.
Adoption of SiC 800 V Architectures
Silicon-carbide power modules switch faster and run cooler than silicon IGBTs, enabling smaller radiators and lighter cables. Infineon’s CoolSiC portfolio shows switching-loss reductions of up to 80%, translating into extended real-world driving range. The 800 V baseline also supports sub-10-minute fast charging, addressing range anxiety and enhancing fleet uptime. Component qualification standards are evolving in parallel, and suppliers with dedicated SiC capacity gain a strategic edge while wafer availability remains tight.
Restraints Impact Analysis*
| Restraint | (~) % Impact on CAGR Forecast | Geographic Relevance | Impact Timeline |
|---|---|---|---|
| Cost of Smart Drive Modules | -5.7% | Global, cost-sensitive markets most affected | Short term (≤ 2 years) |
| Reliability Challenges | -5.4% | Global, extreme climate regions amplified | Medium term (2-4 years) |
| Supply-Chain Bottlenecks | -5.2% | Global, APAC manufacturing dependency | Medium term (2-4 years) |
| Cyber-Security Risks | -4.9% | North America and EU regulatory focus | Long term (≥ 4 years) |
| Source: Mordor Intelligence | |||
High Upfront Cost of Smart Drive Modules
Smart electric drive systems command premium pricing that creates adoption barriers in price-sensitive market segments, particularly affecting commercial vehicle fleets, where total cost of ownership calculations must justify higher initial investments against uncertain residual values and maintenance cost projections. Smart electric drive assemblies integrate advanced semiconductors, sensors, and over-the-air update capability, which elevates bill-of-materials values by as much as one-third relative to conventional e-motors. Commercial fleets in emerging economies face cash-flow constraints that delay large-scale procurement. Economies of scale and design-to-manufacture guidelines are expected to narrow the differential over the next 24 months as production volumes rise.
Thermal-Management and Reliability Challenges
Advanced power electronics and integrated motor designs generate heat loads that exceed conventional cooling system capabilities, requiring sophisticated thermal management solutions that increase system complexity and potential failure modes in demanding operating environments. Failure modes such as power-module delamination and wire-bond fatigue shorten service life, elevating warranty risk. Suppliers address these issues through insulated metal substrates, oil-based cooling jackets, and predictive health-monitoring algorithms that schedule maintenance before functional failure.
*Our forecasts treat driver/restraint impacts as directional, not additive. The impact forecasts reflect baseline growth, mix effects, and variable interactions.
Segment Analysis
By Vehicle Type : Commercial Fleets Drive Acceleration
passenger vehicles retained the largest 46.98% of the smart electric drive for the electric vehicles market share in 2024. Commercial vehicles achieved the fastest 33.83% CAGR through 2030. Route predictability in last-mile delivery fleets lets machine-learning algorithms schedule regenerative-braking events that lower total energy draw and extend maintenance intervals. Municipal zero-emission zones now restrict diesel vans, so operators view smart drives as compliance tools that also improve driver satisfaction and brand image. Two-wheeler demand remains concentrated in Asian megacities where compact e-axles deliver high torque at low voltage, meeting local licensing rules while reducing traffic emissions. These combined forces keep the commercial segment on an acceleration path that outpaces broader passenger-car electrification.
Fleet owners increasingly integrate drivetrain telemetry with cloud dashboards to forecast component health and optimize charging windows. BorgWarner’s iM-575 e-axle illustrates the heavy-duty specifications required for stop-and-go cycles, combining sealed liquid cooling and 97% peak inverter efficiency. City depots that install megawatt-class chargers shorten vehicle dwell time, which raises daily utilization and strengthens the investment case. Insurance providers also discount premiums when predictive-maintenance data cut roadside breakdown risk, improving fleet economics further. These operational advantages reinforce the segment’s leadership in CAGR expansion.


By Electric Vehicle Type : BEV Dominance Accelerates
Battery electric vehicles captured 59.24% of the smart electric drive for the electric vehicles market size in 2024 and are forecasted to grow at a 30.99% CAGR, underscoring a decisive market pivot away from transitional hybrid architectures. Purpose-built skateboard platforms position the battery low in the chassis, freeing cabin volume and improving roll stability while simplifying smart-drive packaging. Plug-in hybrids still attract buyers in regions with sparse public charging; however, their dual-powertrain complexity raises warranty cost and slows production line takt times. Conventional hybrids face similar limitations and trend downward as OEM roadmaps reallocate capital toward full electrification. The data collectively confirm that BEVs are the primary engine of future demand across all major regions.
Smart electric drive for the electric vehicles market size growth in BEVs is amplified by higher voltage networks that shorten fast-charge stops. Tesla’s cell-to-pack design eliminates module housings, dropping structural mass and letting inverters operate closer to peak efficiency thresholds. New energy-density gains also shrink cooling requirements, creating space for advanced driver-assistance sensors. As charging infrastructure expands, consumers become less sensitive to range anxiety, further accelerating BEV adoption. These synergies maintain the segment’s leadership in both volume and innovation velocity.
By Drive Type : AWD Integration Creates Premium Value
Front-wheel-drive configurations held 42.18% of the smart electric drive for electric vehicles market share in 2024 because they meet the cost targets of high-volume compact cars. All-wheel-drive systems, however, log a 30.41% CAGR as premium brands install dual-motor layouts that unlock real-time torque vectoring and enhanced stability. Rear-wheel-drive packages keep a foothold in performance niches where acceleration feel and chassis balance remain differentiators. Consumers in snowy regions increasingly select AWD variants when smart drives distribute power with millisecond precision, improving confidence on slick roads. This mix confirms that drivetrain choice is shifting from purely mechanical considerations to software-enabled performance features.
Next-generation modules incorporate disconnect clutches that isolate secondary axles during steady-state cruising to trim parasitic losses. Embedded control software evaluates traction, temperature, and driver inputs every millisecond, engaging motors only when additional torque delivers a measurable benefit. Automakers market these features as safety upgrades and energy-efficiency gains, helping justify higher sticker prices. Component suppliers respond by standardizing dual-inverter platforms that scale from compact SUVs to luxury sedans. As a result, drivetrain flexibility becomes a strategic lever for brand differentiation.

By Component Type: Power Electronics Lead Innovation
Motors provided 34.73% of the smart electric drive for electric vehicles market share in 2024, yet power electronics and inverters are expected to post the highest 32.21% CAGR through 2030. Silicon-carbide transistors switch at higher frequencies and lower temperatures than legacy silicon devices, allowing smaller radiators and tighter mounting envelopes. Battery packs integrate distributed temperature sensors and active cell-balancing circuits that feed real-time data to the inverter ECU, ensuring charging currents stay within material limits. E-brake boosters and high-voltage DC-DC converters expand the smart-drive system boundary beyond propulsion to cover vehicle-wide energy management tasks. These advances collectively raise drivetrain efficiency while shrinking overall system mass.
Suppliers such as Vitesco and Valeo win multi-year awards for 800 V inverter assemblies because they couple semiconductor packaging know-how with automotive-grade software. Continuous design iterations target lower inductance layouts that slash switching losses without inflating the bill-of-materials cost. Motor manufacturers push toward hairpin-winding stators and oil-spray cooling, squeezing incremental efficiency gains from electromagnetic design. Yet the biggest value creation now stems from holistic system control that harmonizes battery, inverter, and motor performance. This integration imperative is redefining competitive advantage across the component landscape.
Geography Analysis
Asia-Pacific retained 43.92% of the smart electric drive for electric vehicles market share in 2024 and is projected to log the highest 30.83% CAGR. Government subsidies for domestic battery and semiconductor production shorten supply lines and lower unit cost. China’s zero-emission freight regulations accelerate adoption among urban delivery fleets, while vertically integrated players such as BYD export complete e-axle systems to Europe and South America.
North America is driven by federal tax credits that require final assembly and critical-mineral sourcing inside the region. OEM announcements of new inverter and motor plants in the United States and Canada align with job-creation incentives. Regulatory attention on cybersecurity elevates specification complexity but also differentiates experienced suppliers. The Middle East and Africa represent emerging opportunities where the adoption of smart electric drive connects to renewable energy integration and urban air quality improvement initiatives.
As Euro 7 standards tighten particulate limits on gasoline engines and encourage a pivot toward BEVs in Europe. The European Commission sets detailed functional-safety and software-update rules that shape inverter and motor controller architectures. Premium brands use smart-drive capabilities such as torque vectoring to maintain performance positioning while meeting stricter CO₂ targets. Supply-chain reliance on imported battery materials remains a strategic risk, spurring investment in regional cathode and anode plants.

Competitive Landscape
The smart electric drive for electric vehicles market is moderately consolidated. Robert Bosch GmbH leverages deep systems expertise and global production capacity to win high-volume e-axle contracts. ZF Friedrichshafen AG utilizes decades of transmission know-how into compact integrated drive units suitable for passenger and light-commercial platforms. Japanese conglomerates such as Aisin and Denso strengthen positions through joint ventures that spread R&D expense and capture regional procurement quotas. This group of incumbents focuses on platform breadth, automotive-grade reliability, and global service networks as primary competitive levers.
Software-centric entrants pursue differentiation by offering cloud dashboards that push over-the-air efficiency updates, turning hardware into an upgradeable asset. These firms often partner with contract manufacturers for final assembly, allowing capital-light scaling while concentrating internal resources on control algorithms and cybersecurity. Established suppliers counter by bundling telematics and predictive-maintenance subscriptions with their hardware, building recurring revenue streams that mirror those of digital challengers. Intellectual-property filings around silicon-carbide gate drivers, thermal-interface materials, and diagnostic firmware rose sharply in 2024, signaling an arms race for technology defensibility. The patent activity also raises entry barriers for latecomers, tilting future bargaining power toward holders of core semiconductor and software IP.
Strategic alliances accelerate as complexity rises and OEMs demand turnkey solutions. Thermal-management specialists team with motor designers to embed micro-channel coolers directly inside stator housings, slashing temperature gradients under peak load. Semiconductor fabricators sign long-term wafer offtake pacts with tier-one suppliers, locking in feedstock for 800 V inverter ramps while de-risking fabrication-plant expansions. Equity stakes and joint development agreements now routinely bundle hardware, embedded software, and cloud analytics, reflecting the market’s shift toward solution selling. As technical and capital requirements climb, smaller pure-play component vendors may seek acquisition exits, further consolidating the competitive field into a handful of vertically integrated power-electronics leaders.
Smart Electric Drive For Electric Vehicles Industry Leaders
Robert Bosch GmbH
ZF Friedrichshafen AG
Magna International Inc.
Continental AG
Nidec Corporation
- *Disclaimer: Major Players sorted in no particular order

Recent Industry Developments
- September 2025: Magna announced that XPENG selected the company to assemble two new models for Europe, with serial production slated for Q3 2025.
- July 2025: AT&S joined the HiPower 5.0 research consortium to develop semiconductor-integration techniques for compact smart-drive modules.
- April 2025: Smart introduced the 5 Brabus SUV, produces 475 kW through an all-wheel-drive e-axle system capable of 0-to-62 mph in 3.8 seconds using Launch Mode.


Global Smart Electric Drive For Electric Vehicles Market Report Scope
| Two-Wheeler |
| Passenger Vehicle |
| Commercial Vehicle |
| Battery Electric Vehicle (BEV) |
| Plug-in Hybrid Electric Vehicle (PHEV) |
| Hybrid Electric Vehicle (HEV) |
| Front-Wheel Drive (FWD) |
| Rear-Wheel Drive (RWD) |
| All-Wheel Drive (AWD) |
| Motor |
| Power Electronics / Inverter |
| Battery Pack |
| E-Brake Booster |
| North America | United States |
| Canada | |
| Rest of North America | |
| South America | Brazil |
| Argentina | |
| Rest of South America | |
| Europe | United Kingdom |
| Germany | |
| France | |
| Italy | |
| Spain | |
| Russia | |
| Rest of Europe | |
| Asia-Pacific | China |
| India | |
| Japan | |
| South Korea | |
| Rest of Asia-Pacific | |
| Middle East and Africa | United Arab Emirates |
| Saudi Arabia | |
| Turkey | |
| Egypt | |
| South Africa | |
| Rest of Middle East and Africa |
| By Vehicle Type | Two-Wheeler | |
| Passenger Vehicle | ||
| Commercial Vehicle | ||
| By Electric Vehicle Type | Battery Electric Vehicle (BEV) | |
| Plug-in Hybrid Electric Vehicle (PHEV) | ||
| Hybrid Electric Vehicle (HEV) | ||
| By Drive Type | Front-Wheel Drive (FWD) | |
| Rear-Wheel Drive (RWD) | ||
| All-Wheel Drive (AWD) | ||
| By Component Type | Motor | |
| Power Electronics / Inverter | ||
| Battery Pack | ||
| E-Brake Booster | ||
| By Geography | North America | United States |
| Canada | ||
| Rest of North America | ||
| South America | Brazil | |
| Argentina | ||
| Rest of South America | ||
| Europe | United Kingdom | |
| Germany | ||
| France | ||
| Italy | ||
| Spain | ||
| Russia | ||
| Rest of Europe | ||
| Asia-Pacific | China | |
| India | ||
| Japan | ||
| South Korea | ||
| Rest of Asia-Pacific | ||
| Middle East and Africa | United Arab Emirates | |
| Saudi Arabia | ||
| Turkey | ||
| Egypt | ||
| South Africa | ||
| Rest of Middle East and Africa | ||


Key Questions Answered in the Report
What is the current size of the smart electric drive for electric vehicles market?
The market is valued at USD 3.65 billion in 2025 with projected expansion to USD 13.65 billion by 2030.
Which segment grows fastest within vehicle types?
Commercial vehicles record a 33.83% CAGR, outperforming passenger and two-wheeler categories.
How are wide-bandgap semiconductors influencing drivetrain design?
Silicon-carbide devices enable 800 V architectures that shorten charging time and raise inverter efficiency, driving adoption among premium and fleet models.
Which region leads in market share and growth?
Asia-Pacific holds 43.92% share in 2024 and achieves the highest 30.83% CAGR through 2030 due to integrated battery and semiconductor supply chains.
What is a key restraint facing the market?
High upfront cost of smart-drive modules limits adoption in price-sensitive regions until scale economies reduce component pricing.
Page last updated on:


