
Driveline Systems For Electric Vehicle Market Size and Share
Market Overview
| Study Period | 2020 - 2031 |
|---|---|
| Market Size (2026) | USD 40.76 Billion |
| Market Size (2031) | USD 57.05 Billion |
| Growth Rate (2026 - 2031) | 6.95 % |
| Fastest Growing Market | Asia Pacific |
| Largest Market | Asia Pacific |
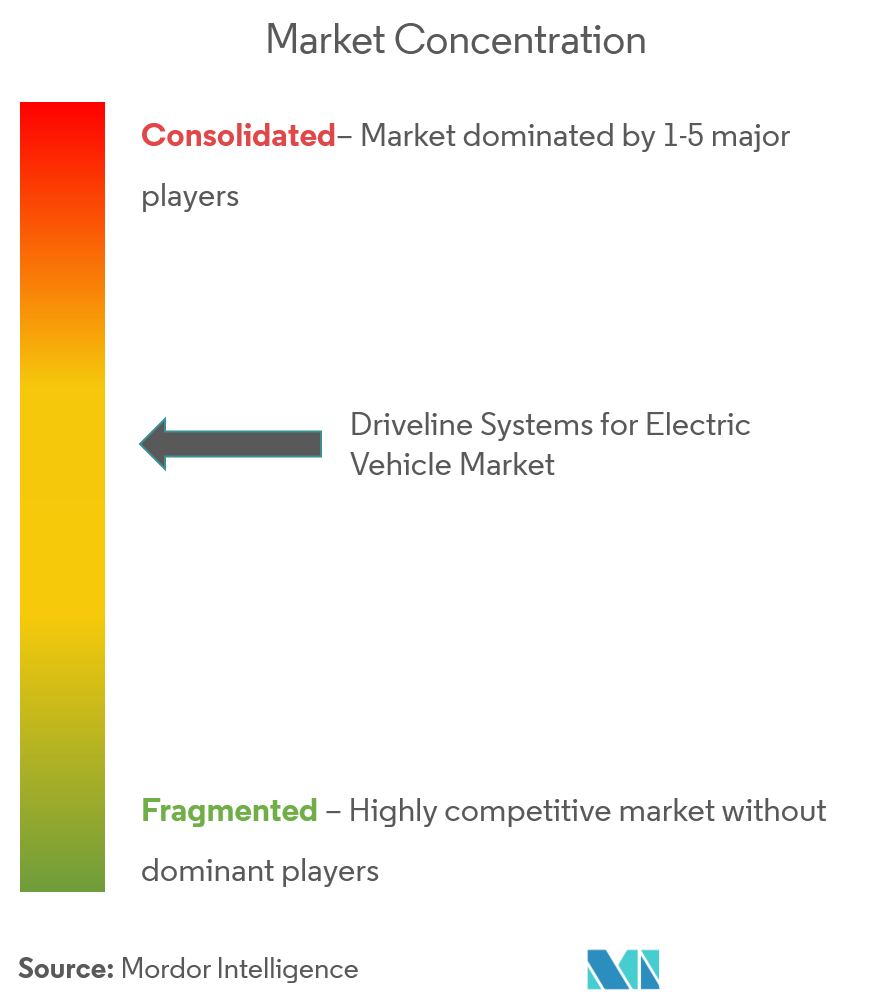
| Market Concentration | Medium |
Major Players *Disclaimer: Major Players sorted in no particular order Image © Mordor Intelligence. Reuse requires attribution under CC BY 4.0. | |
Driveline Systems For Electric Vehicle Market Analysis by Mordor Intelligence
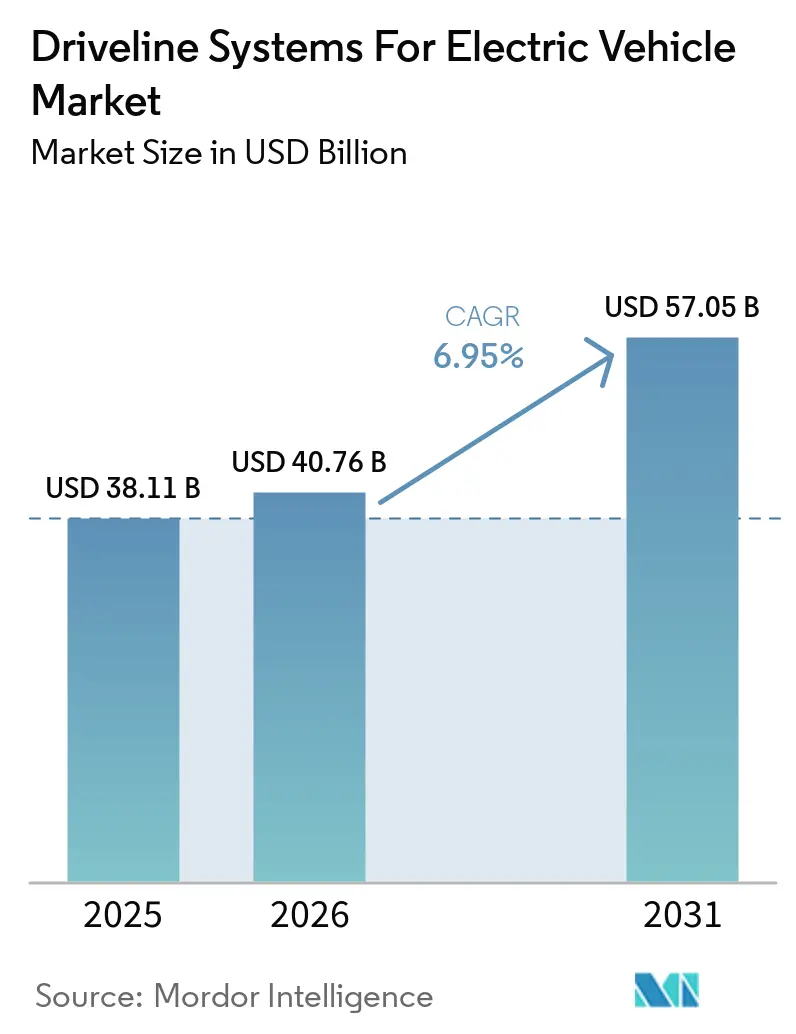
The driveline systems for electric vehicle market size is expected to grow from USD 38.11 billion in 2025 to USD 40.76 billion in 2026 and is forecast to reach USD 57.05 billion by 2031 at 6.95% CAGR over 2026-2031. This trajectory reflects the automotive sector’s accelerated shift toward electrification, prompted by stricter emissions regulations, falling silicon-carbide inverter costs, and aggressive OEM platform launches. The Asia-Pacific region leads demand, thanks to China’s scale advantages, while North America and Europe prioritize higher-voltage architectures that enhance power density and enable megawatt charging. Integrated 3-in-1 e-axles now dominate new platform decisions because they shrink component count, simplify thermal management, and reduce assembly time. At the same time, rare-earth price swings and precision machining bottlenecks create cost headwinds, keeping supply-chain resilience high on executive agendas. Competitive intensity is moderate; legacy Tier-1 suppliers leverage scale and quality systems, yet specialists in in-wheel motors and high-speed reducers are capturing niche growth pockets.
Key Report Takeaways
- By architecture type, the parallel configuration led with 47.95% electric vehicle drivetrain market share in 2025, whereas power-split systems are projected to expand at a 7.22% CAGR through 2031.
- By transmission type, e-CVT held a 41.12% electric vehicle drivetrain market share in 2025, while dual-clutch units are expected to grow at a 7.43% CAGR through 2031.
- By vehicle type, battery electric platforms captured 56.72% share of the electric vehicle drivetrain market size in 2025, and plug-in hybrids are forecast to post an 8.12% CAGR through 2031.
- By drive type, front-wheel drive commanded 61.48% share of the electric vehicle drivetrain market size in 2025, whereas all-wheel drive systems are advancing at an 8.01% CAGR over the same period.
- By motor power output, 45–100 kW units accounted for 50.83% of the electric vehicle drivetrain market share in 2025; however, motors above 250 kW represent the fastest-growing segment with an 8.25% CAGR through 2031.
- By component, integrated e-axles secured 33.27% electric vehicle drivetrain market share in 2025 and are anticipated to rise at an 8.03% CAGR during the forecast horizon.
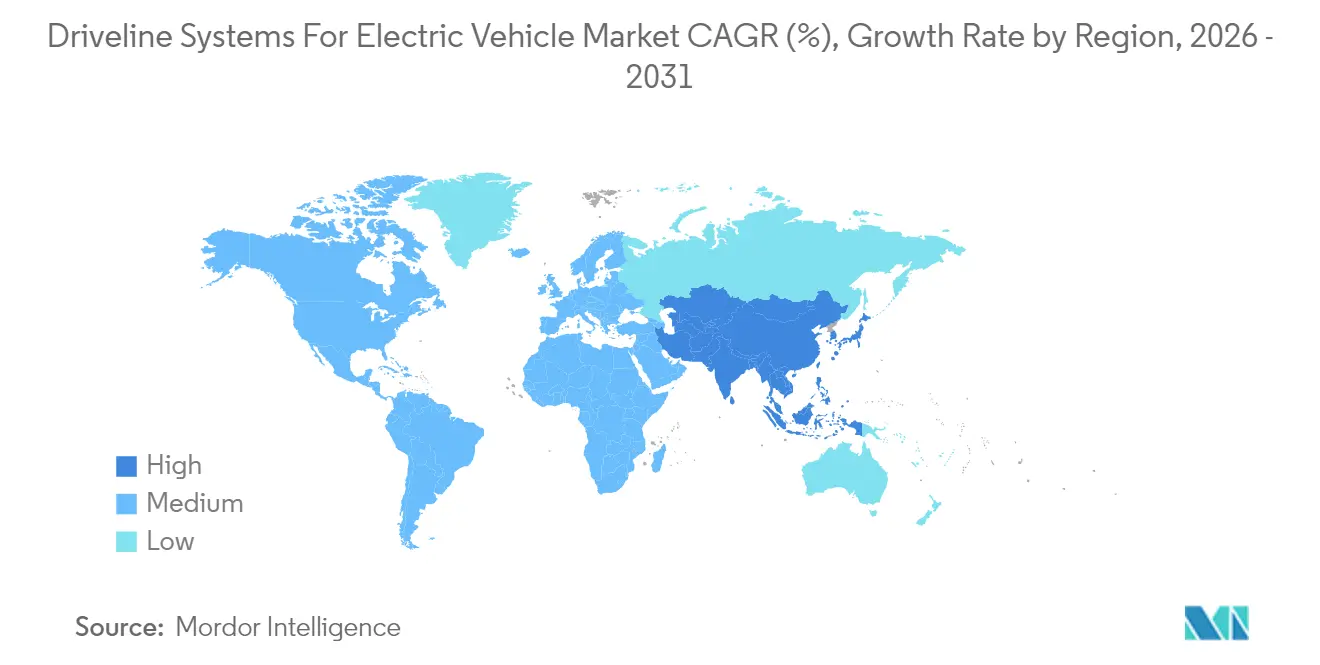
- By geography, the Asia-Pacific region dominated the electric vehicle drivetrain market with a 45.37% market share in 2025 and is projected to grow at an 8.31% CAGR between 2026 and 2031.
Note: Market size and forecast figures in this report are generated using Mordor Intelligence’s proprietary estimation framework, updated with the latest available data and insights as of 2026.
Market Trends and Insights
Drivers Impact Analysis of Driveline Systems For Electric Vehicle Market*
| Driver | (~) % Impact on CAGR Forecast | Geographic Relevance | Impact Timeline |
|---|---|---|---|
| Surging BEV Volumes | +1.8% | Global, Asia-Pacific leading | Medium term (2-4 years) |
| Stricter CO₂ and ZEV Mandates | +1.2% | EU, California, China | Long term (≥ 4 years) |
| OEM Shift to 3-in-1 E-Axles | +1.1% | North America, EU premium segments | Medium term (2-4 years) |
| 800V Platforms Driving Reducer Speed | +1.0% | Global premium and performance segments | Medium term (2-4 years) |
| E-Motor & SiC Inverter Cost Decline | +0.9% | Global manufacturing hubs | Short term (≤ 2 years) |
| Megawatt Charging for Heavy-Duty | +0.8% | North America, EU commercial corridors | Long term (≥ 4 years) |
| Source: Mordor Intelligence | |||
Surging BEV Volumes
Global battery electric vehicle output reached 17.1 million units in 2024, a 25% increase from the prior year, with China accounting for more than 60% of that total. Higher volumes directly amplify drivetrain demand because every BEV needs high-torque motors, inverters, and precision reducers. Sub-USD 25,000 BEV introductions by Tesla and BYD prove that cost parity is achievable, nudging mainstream buyers toward electric options. Most new platforms are purpose-built rather than converted ICE designs, so suppliers must deliver optimized e-axles that enhance efficiency and packaging. Automakers now consolidate sourcing, awarding single-supplier contracts for complete axle assemblies, which compresses margins for standalone component vendors. The integration trend also boosts power density and simplifies warranty management across global vehicle programs.
Tightening CO₂ and ZEV Mandates
Euro 7 rules, effective 2025, cut fleet-average CO₂, while California’s Advanced Clean Cars II targets 35% ZEV sales by 2026, escalating to 100% by 2035[1]. China’s dual-credit system sets a quota for new-energy vehicles, creating a mandatory demand for efficient drivetrains. These regulations favor permanent-magnet motors and SiC inverters that maximize efficiency with every kilowatt-hour. Noise restrictions in urban areas further enhance the appeal of quiet electric propulsion. Because regional compliance dates vary, suppliers with multinational footprints can time capacity expansions to match phased rollouts, cushioning investment risk and maximizing share gains.
Rapid OEM Switch to 3-in-1 E-Axles
Electric vehicle platforms are increasingly adopting integrated drivetrain designs, merging the motor, inverter, and reducer into a unified housing. Electric vehicle platforms increasingly adopt skateboard architectures that integrate motors, batteries, and control systems into the chassis, eliminating traditional driveline components, including drive shafts, differentials, and transfer cases. This shift not only streamlines components but also boosts power density, outpacing traditional layouts.
Leading suppliers, such as Magna, ZF, and Bosch, are achieving notable efficiency with these integrated systems. Furthermore, modular architectures enable component sharing across various vehicle sizes, bolstering scalability. While early manufacturing hurdles posed challenges, automation has since alleviated these issues, slashing production cycle times and enhancing consistency. For OEMs, the allure of integrated drivetrains lies in quicker vehicle integration and simplified warranty management. This advantage is magnified in compact vehicles, where space is at a premium. Consequently, the industry is rapidly pivoting towards these efficient, high-performance drivetrains.
Heavy-Duty Megawatt Charging Pull-Through
As the global network of megawatt charging stations expands, it's spurring the evolution of high-voltage drivetrains. This is especially true for commercial vehicles, which now rely on advanced thermal management systems to cope with sustained high-power charging. Passenger vehicles are also reaping the benefits, with many adopting 800V architectures to align with the new fast-charging infrastructure.
In response, suppliers are rolling out innovations in thermal control. This includes the use of advanced coolants, liquid cold plates, and enhanced electrical components tailored for higher current levels. With megawatt charging corridors gaining momentum in North America and Europe, technologies once exclusive to heavy-duty truck drivetrains are now being integrated into SUVs and performance sedans. This evolution is not only expanding the market for high-voltage systems but also underscoring the industry's pivot towards efficient, fast-charging electric vehicles.
Restraints Impact Analysis of Driveline Systems For Electric Vehicle Market*
| Restraint | (~) % Impact on CAGR Forecast | Geographic Relevance | Impact Timeline |
|---|---|---|---|
| Rare-Earth Price Volatility | -0.6% | Global, China supply concentration | Short term (≤ 2 years) |
| High CAPEX for E-Drive Machining | -0.4% | Asia-Pacific, EU, North America manufacturing hubs | Medium term (2-4 years) |
| Inverter Thermal Torque Limits | -0.3% | High-performance and commercial segments | Medium term (2-4 years) |
| In-Wheel Motors Displacing Shafts | -0.2% | Premium and specialty vehicle segments | Long term (≥ 4 years) |
| Source: Mordor Intelligence | |||
High CAPEX for Precision E-Drive Machining
High-precision gear grinders suitable for advanced electric vehicle drivetrain components, such as 800V reducers, represent a significant capital investment. Such investment barriers deter smaller players and slow greenfield builds in emerging markets. High labor skill requirements inflate start-up expenses, while amortization periods stretch beyond typical program lifecycles. Automation helps but cannot yet replace expert machinists for micrometer tolerances, so capacity expansion clusters around established auto hubs in Germany, Japan, and the United States.
Inverter Thermal Limits on Continuous Torque
Silicon carbide (SiC) inverters struggle with thermal limitations when subjected to sustained torque loads. Junction temperatures can surpass safe operating thresholds, resulting in power derating. While liquid cooling systems can mitigate this issue, they come at a premium compared to air-cooled systems, creating challenges for budget-conscious vehicle segments.
In heavy-duty applications, such as trucks that demand a continuous high-power output, packaging and cost constraints often necessitate alternative architectures. To better distribute thermal loads, some opt for distributed inverter designs. While advanced materials, like phase-change compounds, hold promise for future thermal management solutions, they haven't yet achieved commercial viability. This leaves thermal design as a significant hurdle in high-duty drive cycles.
*Our forecasts treat driver/restraint impacts as directional, not additive. The impact forecasts reflect baseline growth, mix effects, and variable interactions.
Driveline Systems For Electric Vehicle Market Segment Analysis
By Architecture Type:
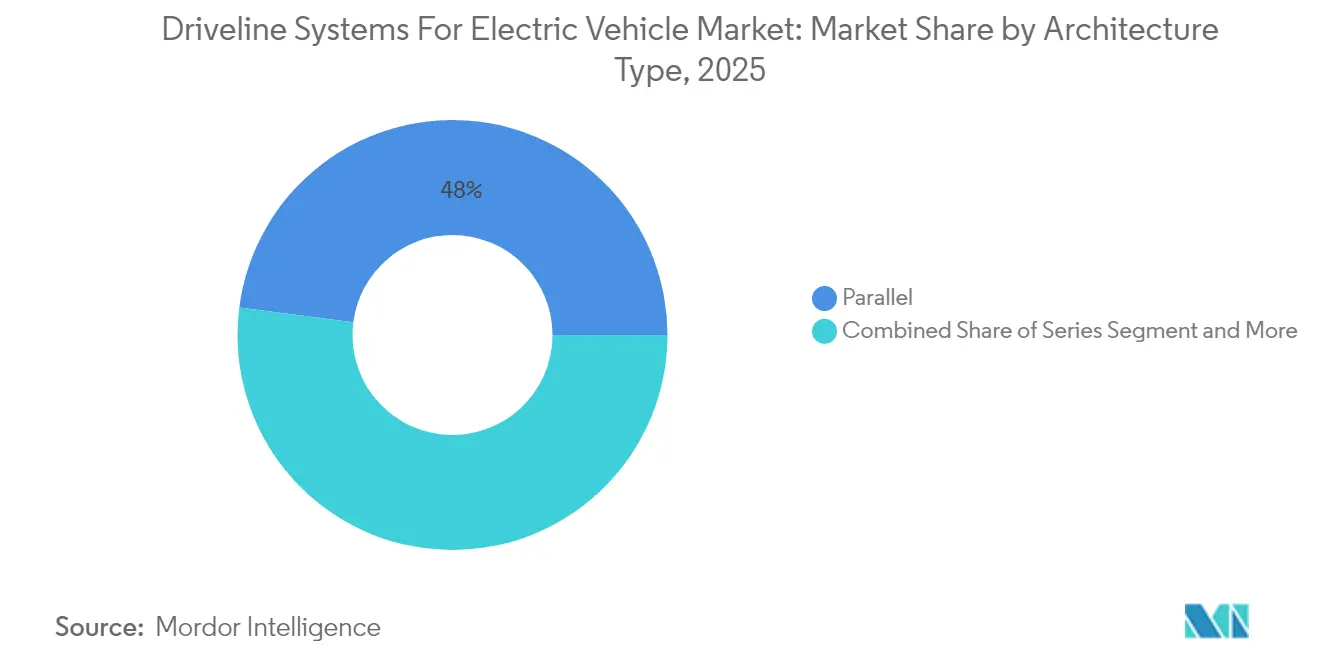
Parallel Dominance Faces Power-Split ChallengeParallel hybrids accounted for 47.95% of the electric vehicle drivetrain market share in 2025, thanks to their mechanical simplicity and the reuse of existing transmissions. Their wide operating envelope aligns with cost-sensitive regions, where modest electrification meets regulatory targets. Power-split systems are expected to expand at a 7.22% CAGR through 2031, as they deliver smoother torque transitions and improved urban efficiency, features prized in premium segments and European cities with zero-emission zones.
Toyota and Ford remain benchmarks, yet newcomers are licensing e-CVT patents to hit regulatory deadlines quickly. Suppliers specializing in planetary gearsets and dual-motor control secure long-term agreements, while parallel-focused firms invest in software upgrades to retain their share. The electric vehicle drivetrain market continues to reward architectures that balance cost, efficiency, and packaging, suggesting that dual-sourcing strategies will persist among global OEMs.

By Transmission Type:
e-CVT Leadership Challenged by Dual-Clutch InnovationElectronic CVTs held a 41.12% share of the electric vehicle drivetrain market size in 2025, underpinned by Toyota’s two-motor system, which pairs silky propulsion with robust durability. OEMs value e-CVT’s seamless ratio changes, which keep engines at their efficiency sweet spots. Dual-clutch units accelerate at a 7.43% CAGR through 2031 as sporty EVs and plug-in hybrids embrace rapid gear changes for engaging performance.
Volkswagen’s 0.15-second DSG shifts demonstrate how dual-clutch boxes narrow the efficiency gap to e-CVTs while enhancing driving enjoyment. The manufacturing scale for dual clutches remains lower than that for e-CVTs, resulting in a cost premium. Nonetheless, regulatory moves toward electric-only driving in cities may tilt future volume back toward e-CVTs, especially when combined with high-voltage electrical architectures that permit extended engine-off operation.
By Motor Power Output:
Mid-Range Dominance with High-Power AccelerationMotors rated 45-100 kW dominated the market with a 50.83% share in 2025, as they satisfy mainstream performance targets without requiring oversized battery packs. Steady gains in magnetic materials and cooling technology enable these units to achieve 0-60 mph acceleration in under nine seconds, while maintaining affordability. Motors above 250 kW represent the fastest-growing segment, with an 8.25% CAGR, driven by luxury sedans, SUVs, and high-payload trucks that require sustained power.
Tri-motor flagships like Tesla Model S Plaid push the technology envelope, driving suppliers to refine insulation systems and rotor designs for 20,000 RPM reliability. The electric vehicle drivetrain market size for high-power applications will continue to rise as battery chemistries increase discharge rates and energy density, enabling performance EVs to achieve track-worthy endurance without thermal roll-off.
By Vehicle Type:
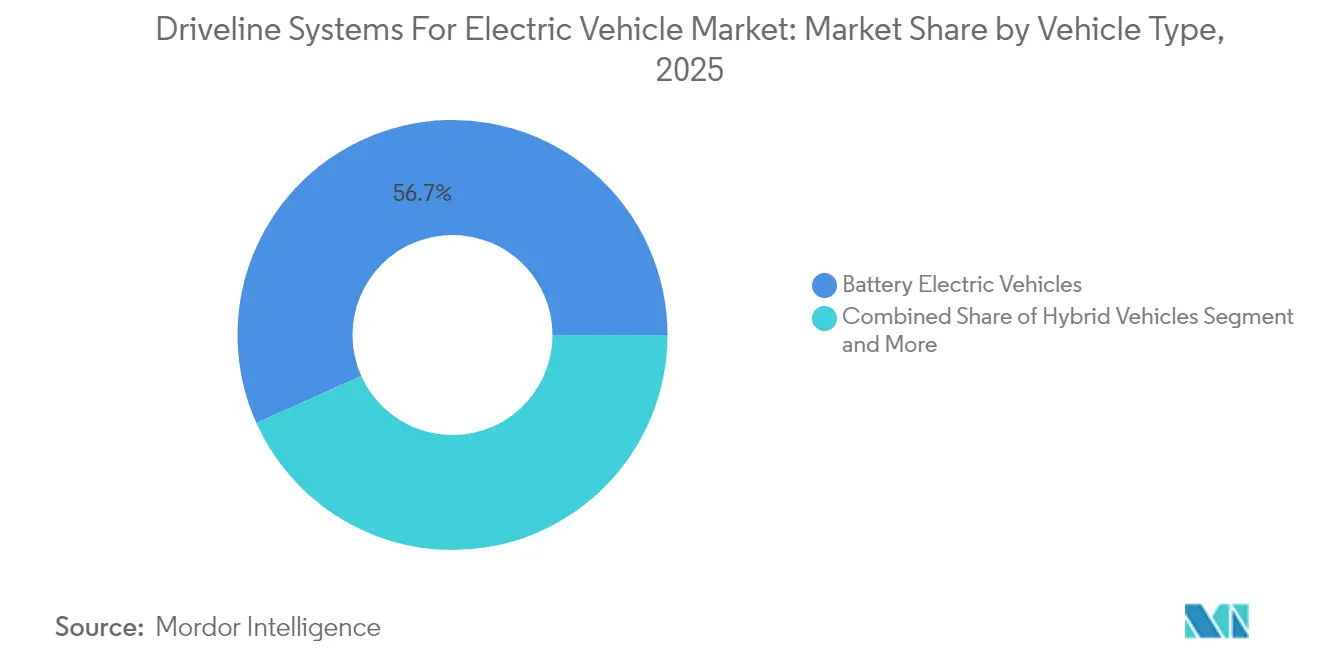
BEV Leadership with PHEV Growth AccelerationBattery electric vehicles held 56.72% share in 2025, marking mainstream acceptance of pure electric propulsion. Dedicated skateboard platforms allow flat floors, ample crumple zones, and optimized e-axle placement. Plug-in hybrids are expected to grow at an 8.12% CAGR, balancing range anxiety with stricter emissions regulations, particularly in parts of North America and Japan where charging access remains limited.
BEVs capture scale benefits in cell procurement and electronics integration, while PHEVs act as compliance bridges until the infrastructure matures. Automakers pursuing dual strategies will need flexible supply contracts from drivetrain vendors because component specifications diverge across voltage classes and torque requirements. The electric vehicle drivetrain market thus rewards suppliers offering modular kits adaptable to both vehicle types.
By Drive Type:
FWD Efficiency Meets AWD Performance DemandFront-wheel drive configurations controlled 61.48% of the electric vehicle drivetrain market share in 2025, benefiting from compact packaging and a reduced component count. Their consolidated front-axle layout trims harness lengths and simplifies cooling loop design. All-wheel drive systems are expected to notch an 8.01% CAGR, driven by premium buyers seeking traction, towing, and performance advantages.
Innovators such as Rivian demonstrate how quad-motor AWD enhances torque vectoring and off-road agility, raising the bar for competitive offerings. Battery placement strategies vary by drive type; FWD vehicles typically mount packs centrally to maintain cabin space, whereas AWD setups can distribute modules for optimal weight balance. Suppliers that master scalable inverter networks and robust communication protocols will secure long-term contracts in this segment of the electric vehicle drivetrain market.
By Component:
E-Axle Integration Leads Drivetrain EvolutionIntegrated e-axles comprised 33.27% of the electric vehicle drivetrain market share in 2025 and grew at an 8.03% CAGR as OEMs sought cost reductions and lightweighting. Combining motor, inverter, and reducer slashes cabling, seals, and brackets, delivering 95% efficiency levels at system weights under 80 kg.
Discrete motors and power modules continue to dominate where bespoke packaging or legacy architectures prevail, but the value proposition shifts toward integration when new platforms are launched. Tier-1s with vertical control of winding, semiconductor packaging, and precision gearing command price leverage. The electric vehicle drivetrain market thus converges on integrated solutions, with discrete suppliers pivoting toward specialist niches, such as high-speed bearings or inverter gate drivers.
Geography Analysis
APAC Driveline Systems for Electric Vehicle Market
Asia-Pacific captured 45.37% electric vehicle drivetrain market share in 2025 and is forecast to grow at an 8.31% CAGR through 2031. China’s output reached over 11 million EVs in 2024 on the back of purchase subsidies and a dense charging grid. Large-scale battery and drivetrain clusters around Shanghai and Guangzhou unlock unit-cost advantages that ripple through export markets. Japan’s industrial base supplies high-reliability motors and e-CVTs to global OEMs, while India’s Production Linked Incentive scheme attracts foreign investment in inverter and reducer production. South Korea’s focus on high-end SUVs drives demand for 800V e-axles with advanced coolant loops, further deepening regional technology capabilities.
North America Driveline Systems for Electric Vehicle Market
North America ranks second, propelled by demand for electric pickups and SUVs that specify high-torque, all-wheel drive systems. The Inflation Reduction Act requires domestic content for tax credits, prompting suppliers to localize inverter, motor, and gearbox assembly in the United States and Mexico . Tesla’s vertically integrated campuses exemplify how battery, drivetrain, and vehicle lines co-locate for logistics savings. Canada’s lithium and rare-earth resources underpin regional supply chains, while Mexican plants benefit from cost-competitive labor and USMCA trade advantages. Overall, the region emphasizes high-power systems and megawatt charging readiness.
Europe Driveline Systems for Electric Vehicle Market
Europe relies on technology leadership to offset higher labor expenses. The Green Deal’s 2035 engine phase-out guarantees steady demand, while city center zero-emission zones bring forward premium BEV launches. Germany’s engineering firms lead integrated e-axle design, incorporating torque vectoring and regenerative braking refinements. France supports compact urban EVs, favoring lightweight front-drive axles. The United Kingdom deploys incentive grants to safeguard domestic automotive jobs, nurturing new drivetrain factories near historic engine plants. Eastern European countries, especially Hungary and Poland, receive fresh investment in reducer and inverter production linked to German OEM expansion.
Regulatory Landscape
Electric driveline system design and sourcing are increasingly shaped by safety and local-content rules that directly affect high-voltage architectures, battery protection, and imported parts. In China, national safety standards GB 18384-2025 (electric vehicle safety) and GB 38031-2025 (traction battery safety) take effect in July 2026, tightening requirements around thermal runaway outcomes (no fire or explosion) and high-voltage isolation or disconnection. This shift is pushing OEMs and Tier-1s toward more robust pack-to-e-axle integration, HV interlock strategies, and expanded validation regimes.
In the United States, electrified driveline suppliers work under a combination of safety regulation and trade policy. FMVSS No. 305a (49 CFR 571.305a) sets updated electric powertrain integrity requirements for light vehicles, with mandatory applicability starting in September 2027, which can affect validation planning and platform timelines. On trade, the Section 232 automobile parts framework continues to shape cost and localization decisions. The Bureau of Industry and Security is opening quarterly inclusions windows (April 2026), while the Department of Commerce is publishing procedures for administering import adjustment offsets for automobile and medium- and heavy-duty vehicle parts (May 2026), reinforcing the business case for North American assembly footprints and compliant sourcing under regional trade rules such as USMCA.
Value Chain Analysis
The value chain runs from raw materials (rare earths for permanent-magnet motors, copper for windings, aluminum castings, and specialty steels for gears) and upstream electronics (power semiconductors and control ICs) to precision manufacturing of reducers or differentials, motor production, inverter assembly, and final integration into e-axles and complete electric drive units. Tier-1 suppliers are increasingly delivering integrated 3-in-1 systems (motor, inverter, reducer) to OEM assembly plants, which reduces the role of standalone component vendors while raising the importance of system-level thermal management, NVH, and functional safety validation within supplier scope.
Bottlenecks are concentrated in rare-earth supply and specific semiconductor nodes. This dynamic was evident in 2025 disruptions tied to rare-earth export restrictions and chip shortages that impacted European driveline production schedules. In response, localization and partnership-led capacity buildouts are becoming more central to chain design. Bosch Ltd and Tata Autocomp Systems announced a 50:50 joint venture in March 2026 to manufacture e-axles and traction motors in India, while REE Automotive's December 2025 memorandum of understanding with Cascadia Motion (a BorgWarner subsidiary) highlights how platform-level integration partnerships can shorten OEM adoption cycles. Logistics and trade compliance are also taking up more space in supplier planning as North America and Europe push for domestic content and regional sourcing, lifting near-shoring of machining, motor assembly, and inverter production to reduce lead times and tariff exposure.
Competitive Landscape
The electric vehicle drivetrain market is moderately consolidated, with a handful of leading suppliers holding a significant share of overall industry revenue. Bosch, ZF, and Continental apply decades of transmission expertise to electric modules, offering OEMs turnkey e-axles that shortcut vehicle development cycles. Their global factories enable volume scale, supplier quality certification, and just-in-time logistics proficiency.
Acquisitions and joint ventures intensify. BorgWarner’s purchase of Santroll’s motor assets and its partnership with CATL illustrate a bid for end-to-end control of motors, inverters, and battery pairing. Magna, Schaeffler, and GKN push into high-speed reducers and advanced bearings to serve 800V architectures, offering OEMs incremental efficiency gains that translate into range improvements.
Disruptors challenge incumbents in niche domains. Protean, GKN, and newcomers from Israel and China promote in-wheel motors that promise superior maneuverability and space savings. Silicon-carbide specialists target inverter modules, integrating on-die temperature sensing and trench technology to raise power density. As platform cycles shorten, OEMs value suppliers that deliver rapid prototype iterations, functional safety compliance, and flexible regional production, sustaining competitive churn throughout the decade.
Driveline Systems For Electric Vehicle Industry Leaders
-
BorgWarner Inc.
-
ZF Friedrichshafen AG
-
Continental AG
-
Robert Bosch GmbH
-
GKN Automotive Limited
- *Disclaimer: Major Players sorted in no particular order
Driveline Systems For Electric Vehicle Market Companies Covered in this Report
- Robert Bosch GmbH
- ZF Friedrichshafen AG
- BorgWarner Inc.
- Continental AG
- GKN Automotive Limited
- DENSO Corporation
- Schaeffler AG & Co. KG
- Valeo SA
- Dana Incorporated
- American Axle & Manufacturing Holdings
Read Analysis of Driveline Systems For Electric Vehicle Companies
Market Opportunities and Future Outlook
Near-term opportunities center on higher-integration e-axles, higher-voltage drivetrains, and manufacturing localization around major EV assembly hubs. Integrated e-axles already accounted for 33.27% of market share in 2025, and OEM shifts toward single-supplier axle assemblies create room for suppliers that can bundle power electronics, high-speed reducers, and thermal management into validated modules with fewer parts and faster vehicle integration. A concrete example is BMW Group commissioning a second production line for sixth-generation e-drive motors at Steyr, Austria in April 2026, which points to continued industrialization of next-generation motor families and demand for matched inverters and precision gearing.
Regional capacity expansion also aligns with local-content requirements and efforts to de-risk supply chains for motors, inverters, and reducers. Uno Minda approved a greenfield facility in Maharashtra in May 2026 focused on high-voltage powertrain products, including electric drive units and dedicated hybrid transmissions. Mercedes-Benz began series production of axial-flux motors at Berlin-Marienfelde in June 2026 as investment continues in differentiated motor topologies and automation-heavy output. On compliance, tighter China safety standards effective July 2026 raise the value of co-engineered solutions for HV isolation, battery safety interfaces, and thermal containment. At the same time, US safety timelines under FMVSS No. 305a, combined with ongoing tariff mechanisms, continue to favor suppliers that can support North American testing, documentation, and manufacturing depth.
Recent Industry Developments in Driveline Systems For Electric Vehicle Market
- June 2026: BorgWarner announced a USD 49 million investment to expand EV component production at its San Luis Potosi, Mexico operations, with job additions planned during 2026 as the program scales through the 2025-2028 window. The expansion supports localization of electric driveline supply into North American vehicle programs and helps reduce lead times and trade-related cost exposure for OEMs sourcing motors and integrated drive content.
- May 2026: BorgWarner disclosed a USD 100 million expansion of its Hendersonville, North Carolina manufacturing facility, adding capacity and new jobs tied to electrification programs. The investment strengthens domestic manufacturing depth for driveline and powertrain components, aligning supplier footprints with regional content requirements and OEM sourcing shifts toward North American production.
- January 2026: ZF Foxconn Chassis Modules inaugurated a factory in Debrecen, Hungary to manufacture e-axles for BMW's Neue Klasse vehicles. The new facility expands European e-axle industrial capacity close to major OEM assembly operations, reinforcing the shift toward integrated axle modules and geographically resilient supply chains.
Driveline Systems For Electric Vehicle Market Report Scope and Research Methodology
Market Definition and Coverage
For this study, the market covers the revenue generated from driveline systems used in electric vehicles, counted when the system is installed on a vehicle and supplied through OEM or equivalent replacement channels.
Scope exclusions: We exclude high-voltage battery packs, standalone charging hardware, and general vehicle electronics that do not transmit torque to the wheels.
Segments Covered in This Report
- By Architecture Type
- Series
- Parallel
- Power-Split
- By Transmission Type
- Automatic
- Dual-Clutch
- e-CVT
- By Motor Power Output
- 45 - 100 kW
- 100 - 250 kW
- Above 250 kW
- By Vehicle Type
- Hybrid Vehicles
- Plug-in Hybrid Vehicles
- Battery Electric Vehicles
- By Drive Type
- Front-Wheel Drive
- Rear-Wheel Drive
- All-Wheel Drive
- By Component
- Electric Motor
- E-Axle / Integrated Drive
- Power Electronics
- Gear-Reducer & Differential
- Shafts & Couplings
- Cooling / Lubricants
- By Geography
- North America
- United States
- Canada
- Rest of North America
- South America
- Brazil
- Argentina
- Rest of South America
- Europe
- United Kingdom
- Germany
- Spain
- Italy
- France
- Russia
- Rest of Europe
- Asia-Pacific
- India
- China
- Japan
- South Korea
- Rest of Asia-Pacific
- Middle East and Africa
- United Arab Emirates
- Saudi Arabia
- Turkey
- Egypt
- South Africa
- Rest of Middle-East and Africa
- North America
Data Sources, Market Sizing, and Validation
Desk Research
We start by mapping the demand pool using public EV production and sales series, then align it with driveline content per vehicle so the units and dollars stay consistent. Typical inputs include national transport and vehicle registration agencies, international trade statistics portals, customs import and export data where relevant, and technical publications indexed in peer-reviewed engineering journals.
To keep assumptions practical, we also use company annual reports, investor presentations, earnings call transcripts, and credible automotive press for technology mix shifts such as e-axle adoption and multi-speed transmission penetration. Where helpful, paid databases are used for company financials and intelligence, patent lookups, and shipment-level import and export checks to sanity-test volume and pricing direction. The sources listed here are illustrative only, and additional public references were reviewed for data collection, validation, and clarification.
Primary Interviews and Surveys
We then validate the model through interviews and structured surveys with component suppliers, OEM-side engineering and purchasing contacts, and aftermarket channel participants, so gaps in public pricing and driveline content assumptions get corrected. Because this is a global market, the feedback is balanced across major EV production hubs and demand centers. The input is used to align drivetrain architecture splits, typical system ASP ranges, and timing of technology upgrades.
Distribution of primary research fieldwork respondents
| Company type | Respondent position | Region |
|---|---|---|
| Top tier: 30% | CXOs: 17% | APAC: 46% |
| Mid tier: 51% | Functional/Unit leaders: 25% | EMEA: 29% |
| Smaller Players: 19% | Managers: 58% | Americas: 25% |
Market-Sizing & Forecasting
Sizing is built using both top-down and bottom-up logic, but the core is a top-down demand reconstruction that starts from EV production and sales by region and then applies drivetrain architecture shares to estimate fitment volumes. Those volumes are converted to value using system-level ASP bands that reflect content changes, such as integration of motor and gearbox into e-axles, use of reduction gears, and shifts in differential layouts.
To keep the totals realistic, we corroborate the outcome with selective bottom-up approximations like supplier revenue roll-ups, channel checks on sampled program volumes, and a simple ASP multiplied by unit shipments test for major driveline sub-systems. Inputs that commonly move the model include BEV versus PHEV mix, average motor output trends that influence driveline specification, penetration of single versus dual motor layouts, average vehicle production by platform cycles, and commodity-linked cost pressure that affects pricing resets.
For forecasting, scenario analysis is used around EV build rates and drivetrain mix because program ramps and policy changes can move volumes quickly. Where information is missing at a sub-segment level, the gap is handled by using region-level averages validated in interviews, then applying conservative ranges until stronger signals appear in registrations, production, or trade data.
Data Validation & Update Cycle
Before sign-off, our estimates are cross-checked against independent signals such as EV production totals, announced platform capacity additions, and supplier revenue direction, and any outliers are reviewed until the drivers are clearly explained. If a variance is large, assumptions on architecture split, pricing progression, or regional mix are re-tested, and expert respondents may be re-contacted for clarification.
We use a multi-step internal review so the calculations, unit logic, and currency handling stay consistent across regions and years. The report is refreshed annually, and interim updates are triggered when material events occur, such as sudden EV subsidy changes or major production interruptions. Right before delivery, a final update pass is completed so clients receive the latest view available.
Mordor Intelligence's Driveline Systems for Electric Vehicle Market Size Measured Against Other Published Estimates
Published market sizes for EV driveline systems can look far apart even when they claim to cover the same scope, because definitions for what counts as driveline content and the anchor year are not handled consistently. Differences also show up when one study prices complete e-axle systems, while another prices only select components, which changes the total dollars.
EV production volumes, drivetrain architecture shares, and system-level ASP checks are the three evidence points that keep Mordor Intelligence tied to a vehicle-installed driveline demand pool in 2026, instead of mixing earlier-year pricing or adjacent powertrain content. Spreads usually come from how hybrid-heavy scopes are treated, how multi-motor penetration is counted, how currency conversion timing is handled, and whether the pricing curve is refreshed after major cost swings in motors and gear reduction stages.
Benchmark comparison
| Source | Market Size | Gaps in Research Methodology |
|---|---|---|
| Mordor Intelligence | USD 40.76 B (2026) | |
| Global Consultancy A | USD 13.80 B (2023) | Uses an earlier base year and a narrower driveline boundary, with several system elements priced as separate component markets rather than as a full driveline system per vehicle. |
| Strategy Firm B | USD 45.20 B (2023) | Anchors the model on 2023 and applies a broader inclusion of EV driveline content, which can pull in additional architectures and raise the implied ASP per vehicle. |
The comparison shows that year selection and what gets counted as a complete driveline system are the two biggest levers behind the spread. By keeping units grounded in EV build rates and then converting them using validated system pricing bands, we end up with a number that is traceable to clear steps and easier to re-check as the market changes.
Key Questions Answered in the Report
What is the current Driveline Systems For Electric Vehicle Market size?
The Driveline Systems For Electric Vehicle Market is projected to register a CAGR of 6.95% during the forecast period (2026-2031)
What is the current value of the electric vehicle drivetrain market?
The market is valued at USD 40.76 billion in 2026 and is projected to hit USD 57.05 billion by 2031.
Which drivetrain component is growing fastest?
Integrated e-axles lead growth with an 8.03% CAGR as OEMs seek simplified, high-efficiency assemblies.
Why are 800V platforms important?
They enable faster charging, higher motor speeds, and lighter wiring, improving range and performance.
How will rare-earth price volatility affect suppliers?
It may raise motor costs and drive investment in magnet recycling and alternative motor topologies.
Which region leads electric drivetrain production?
Asia-Pacific holds the largest share at 45.37% and continues to expand on the back of China’s scale advantages.