Electric Vehicle Powertrain Market Size and Share
Market Overview
| Study Period | 2019 - 2031 |
|---|---|
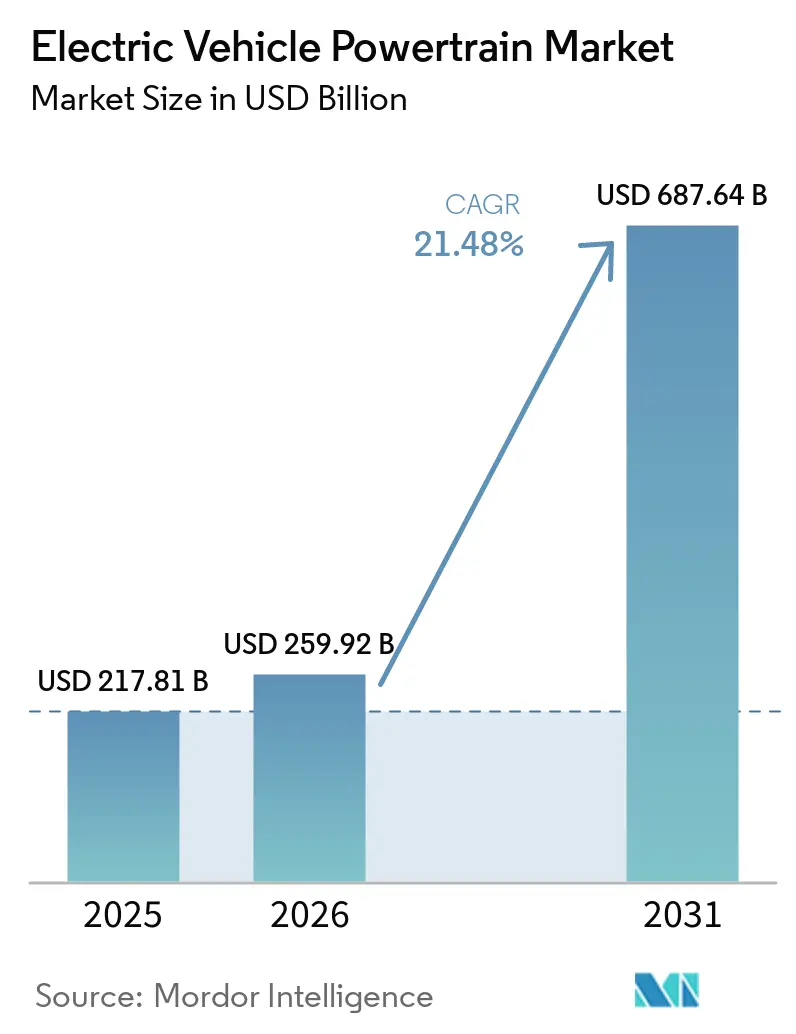
| Market Size (2026) | USD 259.92 Billion |
| Market Size (2031) | USD 687.64 Billion |
| Growth Rate (2026 - 2031) | 21.48% CAGR |
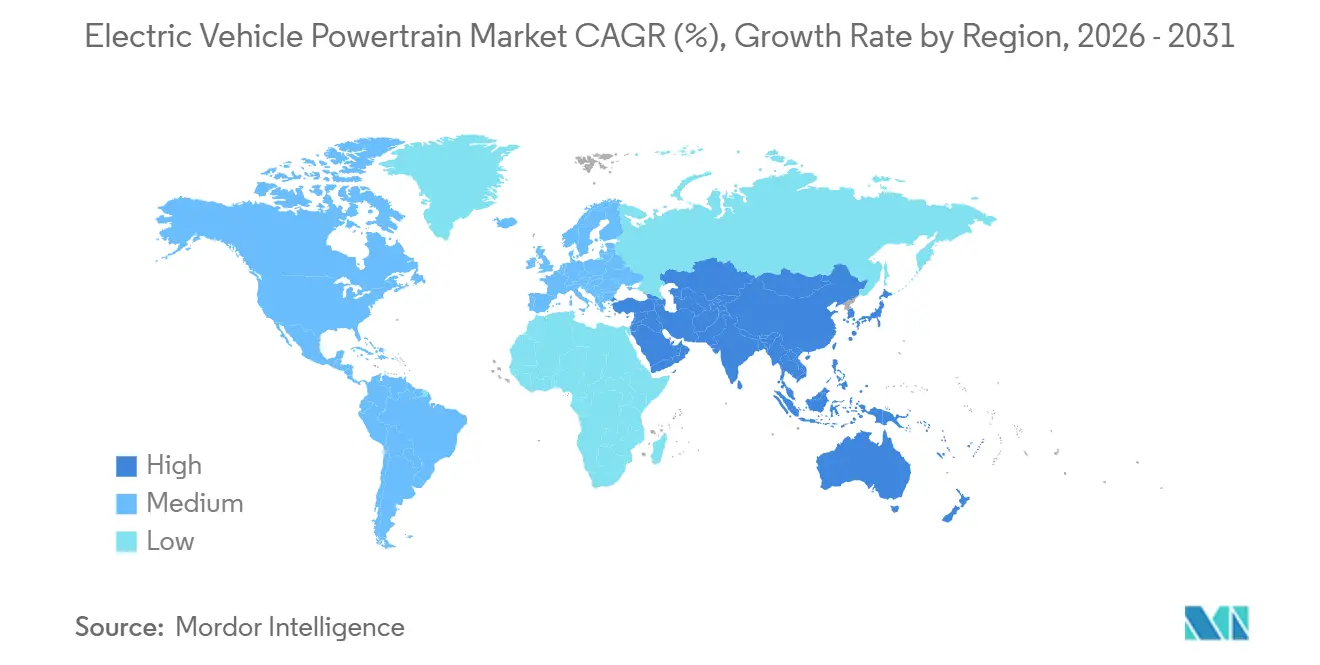
| Fastest Growing Market | Asia Pacific |
| Largest Market | Asia Pacific |
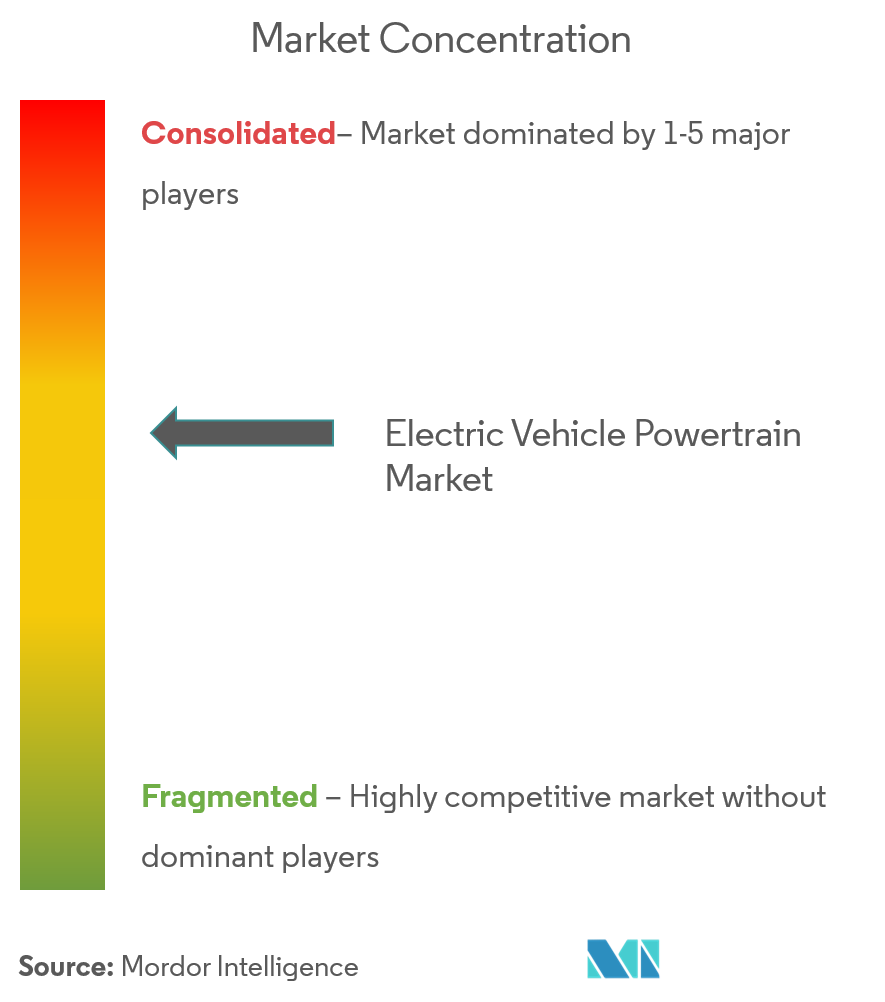
| Market Concentration | Medium |
Major Players *Disclaimer: Major Players sorted in no particular order Image © Mordor Intelligence. Reuse requires attribution under CC BY 4.0. | |
Electric Vehicle Powertrain Market Analysis by Mordor Intelligence
The electric vehicle powertrain market size was valued at USD 217.81 billion in 2025 and estimated to grow from USD 259.92 billion in 2026 to reach USD 687.64 billion by 2031, at a CAGR of 21.48% during the forecast period (2026-2031). Demand momentum is anchored in tightening zero-emission mandates, battery cost compression, and the shift to 800-volt vehicle platforms that promise lighter cabling and sub-20-minute fast-charging capability. Battery packs remained the largest component category, but power-electronics spending is accelerating as silicon-carbide inverters and integrated DC-DC converters become mainstream. Commercial-fleet economics are reshaping segment growth because last-mile delivery operators can amortize higher upfront costs over intensive duty cycles. The Asia-Pacific region dominates volumes due to its vertically integrated supply chains, while localization incentives in North America and Europe are reshaping plant footprints to meet content rules and subsidy thresholds.
Key Report Takeaways
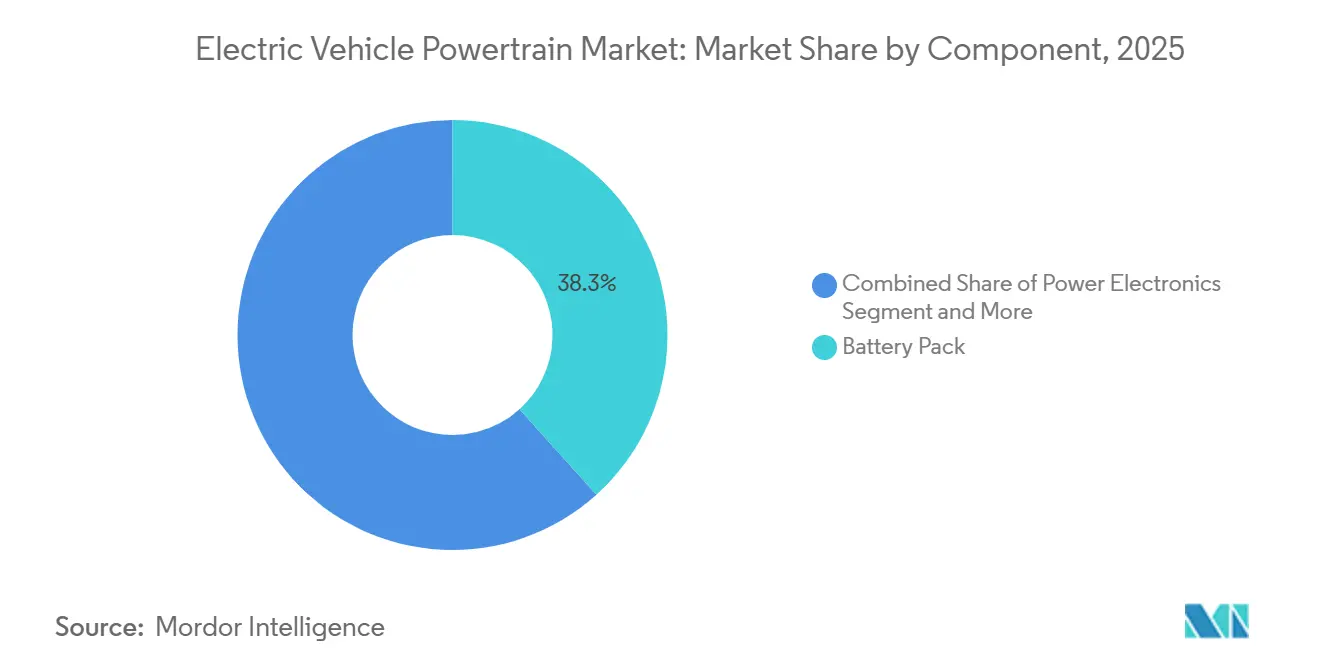
- By component, battery packs held 38.32% revenue share in 2025, while power electronics is expanding at a 29.42% CAGR through 2031.
- By propulsion type, battery electric vehicles (BEVs) led with 71.24% of the electric vehicle powertrain market share in 2025 and are advancing at a 24.80% CAGR through 2031.
- By vehicle class, passenger cars accounted for 63.46% of the market size in 2025, whereas light commercial vehicles are set to grow at a 26.22% CAGR through 2031.
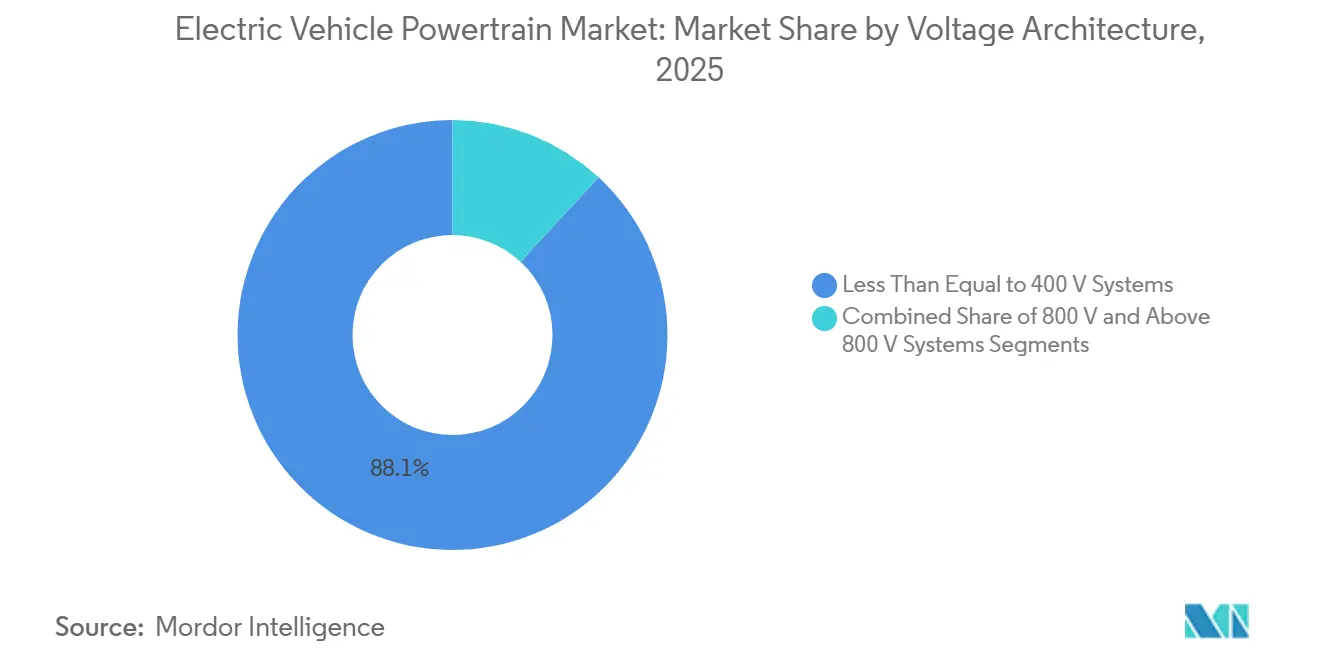
- By voltage architecture, ≤400 V systems commanded 88.10% of the market in 2025, yet 800 V platforms are growing at a 38.75% CAGR through 2031.
- By sales channel, OEM-fitted powertrains controlled 92.37% of 2025 revenue, while aftermarket retrofit kits are projected to climb at a 27.12% CAGR through 2031.
- By geography, Asia-Pacific captured 57.66% of revenue in 2025 and is set to post the fastest growth at a 26.64% CAGR through 2031.
Note: Market size and forecast figures in this report are generated using Mordor Intelligence’s proprietary estimation framework, updated with the latest available data and insights as of January 2026.
Global Electric Vehicle Powertrain Market Trends and Insights
Drivers Impact Analysis*
| Driver | (~) % Impact on CAGR Forecast | Geographic Relevance | Impact Timeline |
|---|---|---|---|
| Surging Global Electric Vehicle Sales | +5.2% | Global, with Asia-Pacific core and spill-over to Europe and North America | Medium term (2-4 years) |
| Stringent Zero-Emission Vehicle and Tailpipe Rules | +4.8% | Europe, North America, China | Long term (≥4 years) |
| Rapid Cost Drop in High-Nickel Batteries | +3.9% | Global, led by Asia-Pacific manufacturing hubs | Short term (≤2 years) |
| OEM Shift to 800V Architectures | +3.1% | North America, Europe, premium segments in Asia-Pacific | Medium term (2-4 years) |
| Localization Incentives for E-Drive Manufacturing | +2.7% | North America (IRA), Europe (IPCEI), India (PLI), Southeast Asia | Medium term (2-4 years) |
| Tier-1 Vertical Integration of E-Axles | +2.2% | Global, concentrated in Germany, Japan, United States | Long term (≥4 years) |
| Source: Mordor Intelligence | |||
Surging Global Electric Vehicle Sales Volumes
Global registrations of battery-electric and plug-in hybrid vehicles have increased significantly, prompting Tier-1 suppliers to establish dedicated e-drive lines instead of sharing production space with combustion engines. China has emerged as a dominant market, with automakers offering battery-swap services and complimentary charging to lower the total cost of ownership for consumers. In Europe, logistics providers have rapidly adopted electric vans to comply with urban low-emission zone regulations. In North America, the focus on pickups and sport utility vehicles has driven up the powertrain content value per vehicle. The growing demand is pressuring suppliers to localize operations, as revised trade rules now impose tariffs on cross-border shipments of complete e-axles.[1]“Notice on New Energy Vehicle Policies,”, Ministry of Commerce People’s Republic of China, mofcom.gov.cn.
Stringent Tail-Pipe and Zero-Emission Vehicle Regulations
Starting mid-2025, Euro 7 standards will impose stricter nitrogen-oxide limits and set new brake-particulate thresholds. These changes challenge the viability of small-battery plug-in hybrids [2]“Euro 7 Pollution Standards Adopted,”, European Commission, europa.eu. California's Advanced Clean Cars II mandates a 68% penetration of zero-emission vehicles (ZEVs) by 2030, a target already embraced by 11 states across the United States. In China, a dual-credit system incentivizes longer-range battery electric vehicles (BEVs) and penalizes those with subpar fleet-average fuel economies. This system steers original equipment manufacturers (OEMs) towards high-energy-density chemistries. Additionally, tradable-credit programs empower manufacturers to produce excess electric vehicles in regions where they comply with regulations. They can then sell these credits to competitors, further solidifying the trend of clustering e-drive plants close to final assembly hubs.
Rapid Cost Decline in High-Nickel Battery Chemistries
Nickel-manganese-cobalt 811 cell prices have declined due to advancements in dry-electrode manufacturing, which significantly reduced energy consumption. This decrease allows larger battery packs to achieve price points previously associated with smaller designs, enhancing sedan ranges. Major players have announced capacity expansions, targeting contracts in Europe and North America that are linked to raw-material spot prices. Although restrictions on ore exports in certain regions have increased nickel price volatility, diversified precursor sourcing strategies are helping to maintain stability in original equipment manufacturer pack budgets.
OEM Shift to 800-Volt Architectures
Porsche's Taycan and Hyundai's Ioniq 5 demonstrated the feasibility of fast-charging sessions, achieving significant increases in battery capacity within a short duration on high-powered dispensers. General Motors plans to adopt advanced Ultium platforms across its truck lineup, encouraging suppliers to develop more efficient silicon-carbide inverters. This transition to higher voltage reduces the current required for the same power output, significantly decreases the weight of the copper harness, and slightly enhances the range of dual-motor sport utility vehicles. Although infrastructure development lags in several regions, China's efforts to install advanced chargers have given domestic high-voltage models a competitive edge.
Restraints Impact Analysis*
| Restraint | (~) % Impact on CAGR Forecast | Geographic Relevance | Impact Timeline |
|---|---|---|---|
| Public DC fast-charging gap in emerging markets | -2.8% | India, Southeast Asia, Latin America, Middle East and Africa | Medium term (2-4 years) |
| Critical-mineral supply volatility | -2.3% | Global, with acute exposure in Europe and North America | Short term (≤2 years) |
| Thermal-runaway safety and warranty-cost exposure | -1.6% | Global, concentrated in markets with high-mileage commercial fleets | Long term (≥4 years) |
| High-voltage talent shortage in manufacturing hubs | -1.4% | North America, Europe, India | Medium term (2-4 years) |
| Source: Mordor Intelligence | |||
Public DC-Fast-Charging Gap in Emerging Markets
India operates a limited number of public charging points, resulting in a significant vehicle-to-charger ratio that heightens range anxiety. In Brazil, charging infrastructure is heavily concentrated in a few metropolitan areas, leaving inter-city corridors underserved. Thailand approved a substantial number of highway DC chargers, but only a fraction became operational due to delays in permitting. Sparse networks hurt residual values, with used battery electric vehicles (BEVs) trading at notable discounts compared to combustion models in these markets. Governments are intervening with subsidies and mandates to address the ongoing stalemate between the adoption of electric vehicles and the utilization of charging infrastructure.
Critical-Mineral Supply Volatility
Lithium carbonate prices experienced a significant decline after reaching a peak, driven by the ramp-up of new brine projects in certain regions. Nickel prices also increased due to policy changes in a major exporting country, which added costs to battery production. Automakers are now focusing on diversifying battery chemistries; for example, a popular electric vehicle model has introduced LFP in its base trims, significantly reducing the dependency on cobalt [3]“Mustang Mach-E Model Year 2025 Specifications,”, Ford Motor Company, ford.com. However, fleets with mixed chemistries face increased recycling expenses, as end-of-life battery packs require separate processing methods.
*Our forecasts treat driver/restraint impacts as directional, not additive. The impact forecasts reflect baseline growth, mix effects, and variable interactions.
Segment Analysis
By Component: Battery Packs Drive Value While Power Electronics Accelerate
Power electronics revenue is forecast to post a 29.42% CAGR between 2026 and 2031 as silicon-carbide inverters and integrated converters become standard on 800-volt platforms. Battery packs held a 38.32% share of the electric vehicle powertrain market size in 2025; however, price pressure from Chinese cell oversupply is driving OEMs to treat packs as commoditized, while seeking a competitive edge through proprietary battery-management software.
Electric motors account for a significant portion of component expenditure, with permanent-magnet designs leading in terms of torque density. Single-speed e-axle systems hold a notable share, while niche multigear units are designed to support heavy trucks requiring enhanced gradeability. Thermal loops are evolving into refrigerant heat-pump systems, which help recover a portion of cold-weather range losses. High-voltage wiring, controllers, and bidirectional on-board chargers complete the mix, as OEM vertical integration captures margins previously held by Tier-1 suppliers.


By Propulsion Type: BEV Dominance Accelerates Market Transformation
Battery electric vehicles generated 71.24% of 2025 revenue and are projected to grow at a 24.80% CAGR through 2031, narrowing the total-cost-of-ownership gap with combustion variants in regions where electricity prices remain below USD 0.15/kWh. Plug-in hybrids face diminishing returns once Euro 7 real-world testing exposes the gaps between laboratory and road emissions, eroding regulatory credits and consumer appeal.
Fuel-cell powertrains, once a niche technology, are now primarily adopted by heavy-duty fleets, capitalizing on hydrogen's rapid refueling advantage. With the introduction of high-energy-density packs, such as those developed by leading manufacturers, long-range BEVs are overshadowing the need for the complexities of PHEVs. While off-highway equipment and certain regions with limited charging infrastructure still find value in PHEVs, ongoing advancements in chemistry are steadily diminishing that advantage.
By Vehicle Class: Commercial Fleets Accelerate Faster Than Passenger Segments
Passenger cars accounted for 63.46% of 2025 revenue, but light commercial vehicles are expected to post a 26.22% CAGR to 2031 as fleet operators capitalize on fuel savings resulting from high-utilization duty cycles.
Heavy commercial trucks still struggle with battery-weight penalties that erode their payload, limiting their market share until pack costs fall below USD 70/kWh. Two- and three-wheelers in Asia contribute a cost-sensitive volume base by leveraging small 3-5 kWh packs that undercut gasoline rivals in terms of five-year ownership costs.
By Voltage Architecture: 800-Volt Systems Reshape Supply Chains
Systems at or below 400 V held an 88.10% share in 2025; however, 800 V designs are expected to expand at a rate of 38.75% annually through 2031, as automakers pursue faster charging and lower copper mass. The electric vehicle powertrain market share of high-voltage components is consequently rising because inverters, on-board chargers, and DC-DC converters must be re-engineered to accommodate a 1,200-V blocking voltage.
High-voltage systems, including advanced prototypes, currently represent a minimal share of installations but are attracting significant research and development (R&D) investments from the luxury segment. Although infrastructure availability remains a challenge, China's rapid deployment of fast chargers demonstrates that with aligned policies, grid upgrades can bridge the existing gap.
By Sales Channel: Retrofit Kits Unlock Legacy Fleet Potential
OEM-fitted systems captured 92.37% of 2025 revenue, though aftermarket kits are tracking a 27.12% CAGR as fleets retrofit diesel vehicles to extend asset life. While passenger cars rarely find economic justification for conversions, delivery vans that cover significant distances annually can recover the costs of retrofitting within a few years.
Regulatory disparities play a pivotal role in adoption rates: Europe's rigorous type-approval process significantly increases certification costs for each model, in stark contrast to India's more lenient desktop regime, which keeps costs relatively low. Although OEM structural battery designs can restrict retrofit possibilities, there's still a lucrative conversion potential in legacy fleets across Latin America and Southeast Asia.
Geography Analysis
Asia-Pacific commanded 57.66% of the electric vehicle powertrain market in 2025 and is projected to grow at a 26.64% CAGR through 2031. China's comprehensive ecosystem, spanning from lithium refining to final assembly, solidifies its cost leadership. In contrast, India's production-linked incentive program, which mandates a significant domestic value addition for subsidies, has catalyzed the establishment of planned cell capacity, albeit with some delays in land acquisition. Meanwhile, Japan and South Korea are shifting their focus from combustion engines to e-drive components. Notably, LG Energy Solution's Ochang plant has produced pouch cells, primarily targeting European contracts. Concurrently, Nidec has successfully shipped traction motors. Southeast Asia is positioning itself as a burgeoning hub: Thailand is offering tax holidays for projects that achieve a substantial local content, and Vietnam's VinFast has commenced export shipments to North America.
Europe contributes a significant share of powertrain revenue. The Important Projects of Common European Interest initiative has allocated substantial funding towards gigafactories. This funding is set to bolster Northvolt, ACC, and CATL, granting them a combined capacity in the years to come. However, Germany's established OEMs are grappling with hefty retooling costs for each plant. On another front, the United Kingdom's Advanced Propulsion Centre is investing in silicon-carbide research and development, aiming to reduce its reliance on rare-earth magnets. Spain and Italy are emerging as hotspots for battery assembly projects, lured by their competitive labor costs. Additionally, the Port of Rotterdam is playing a pivotal role in re-export logistics, handling both Chinese-made electric vehicles and lithium imports.
North America accounts for a notable share of global revenue. The Inflation Reduction Act's Section 45X is a game-changer, offering cell credits. This incentive has spurred significant investments in batteries and electric drives. In the United States, newly announced gigafactories are ambitiously targeting substantial annual output. Meanwhile, Canada is securing a notable capacity, thanks to provincial subsidies. Mexico is capitalizing on USMCA regulations, facilitating the establishment of new plants by BMW and Tesla, ensuring they can serve the United States market without tariffs. In contrast, South America, the Middle East, and Africa collectively account for a smaller market share. Highlights from these regions include Brazil witnessing a surge in sales, Saudi Arabia's commitment to Lucid's plant, and South Africa's trials with battery-electric haul trucks, aiming to reduce mine ventilation costs.

Competitive Landscape
The electric vehicle powertrain market is moderately concentrated, with the leading suppliers capturing a significant share of component revenue, though no single firm dominates. Traditional Tier-1 suppliers, such as Bosch, Magna, and BorgWarner, are acquiring semiconductor and software assets to counter vertically integrated OEMs like Tesla and BYD, which benefit from substantial gross margins in powertrain. The industry is shifting toward software-defined powertrains that enable over-the-air torque and thermal updates, creating opportunities for recurring subscription income with high margins.
Three strategic archetypes are shaping the market. Full-system integrators are combining motors, inverters, and gearboxes into simplified e-axles, prioritizing ease of use over customization. Component specialists are focusing on cost efficiency and rapid delivery to meet the high-volume demand for traction motors. Vertically integrated OEMs are managing everything from cells to inverters internally, while also licensing excess capacity to smaller brands. Patent activity highlights these strategies: BorgWarner is advancing silicon-carbide inverter technology, while Valeo is concentrating on bidirectional on-board chargers that support vehicle-to-grid monetization.
Technological leadership now depends on expertise in silicon-carbide modules, which enhance inverter efficiency, extend vehicle range, and justify premium pricing. Suppliers without proficiency in wide-bandgap technologies risk losing margins as OEMs increasingly adopt advanced architectures. At the same time, software capabilities are becoming the critical factor in securing new powertrain contracts, surpassing the importance of traditional mechanical expertise.
Electric Vehicle Powertrain Industry Leaders
Tesla, Inc.
Magna International Inc.
BorgWarner Inc.
Bosch Mobility (Robert Bosch GmbH)
BYD Co. Ltd.
- *Disclaimer: Major Players sorted in no particular order

Recent Industry Developments
- June 2025: ZF unveiled its SELECT e-drive platform tailored for passenger cars, boasting a peak drivetrain efficiency of 96%. The platform also features modular compatibility with both 400 V and 800 V systems, catering to diverse vehicle electrification needs. This innovation underscores ZF's commitment to advancing electric mobility solutions in the automotive market.
- May 2025: Garrett has once again showcased its prowess by launching a groundbreaking high-speed, high-power density Electric Powertrain. This cutting-edge solution made its debut at the 2025 Shanghai Auto Show and was elaborated upon in a technical paper at the 2025 Vienna Motor Symposium. Harnessing state-of-the-art high-speed motor technology, it marks a pivotal advancement in the performance and compactness of Electric Traction Drives, establishing new benchmarks in the industry.
- March 2025: From 2028 to 2033, SK On will supply Nissan with 100 GWh of batteries, securing volumes for Nissan's upcoming crossover lineup. This agreement highlights SK On's commitment to supporting the automotive industry's transition to electric vehicles and reinforces its position as a key player in the EV battery market. The batteries will cater to Nissan's next-generation crossover models, aligning with the automaker's strategy to expand its EV portfolio and meet growing consumer demand for sustainable mobility solutions.


Research Methodology Framework and Report Scope
Market Definitions and Key Coverage
Our study defines the electric-vehicle powertrain market as revenue generated by factory-installed systems that convert stored electrical energy into propulsion in on-road passenger and commercial vehicles. Assemblies covered are battery packs, electric drive motors, inverters, e-axles, high-voltage cabling, and thermal-management modules.
Scope exclusion: retrofit kits for existing combustion cars and stationary battery units are omitted.
Segmentation Overview
- By Component
- Electric Motors
- Permanent-Magnet Synchronous
- Induction
- Switched-Reluctance
- Transmission / e-Axle Systems
- Single-Speed
- Multi-Speed
- Power Electronics
- Inverters
- DC-DC Converters
- On-Board Chargers
- Battery Pack
- Thermal Management Systems
- High-Voltage Cabling & Controllers
- Electric Motors
- By Propulsion Type
- Battery Electric Vehicle (BEV)
- Plug-in Hybrid Electric Vehicle (PHEV)
- Fuel-Cell Electric Vehicle (FCEV)
- By Vehicle Class
- Passenger Cars
- Light Commercial Vehicles
- Heavy Commercial Vehicles
- Two and Three-Wheelers
- Off-Highway Vehicles
- By Voltage Architecture
- Less than equal to 400 V Systems
- 800 V Systems
- Above 800 V Systems
- By Sales Channel
- OEM-Fitted Powertrains
- Aftermarket Retrofit Kits
- By Geography
- North America
- United States
- Canada
- Rest of North America
- South America
- Brazil
- Argentina
- Rest of South America
- Europe
- Germany
- United Kingdom
- France
- Italy
- Spain
- Netherlands
- Rest of Europe
- Asia-Pacific
- China
- Japan
- India
- South Korea
- Thailand
- Vietnam
- Rest of Asia-Pacific
- Middle East and Africa
- Saudi Arabia
- United Arab Emirates
- Turkey
- South Africa
- Egypt
- Rest of Middle East and Africa
- North America
Detailed Research Methodology and Data Validation
Primary Research
Interviews and short surveys with drivetrain engineers, procurement heads, and charger-network planners across Asia, Europe, and North America let us verify average selling prices, 800-volt uptake timelines, and supply bottlenecks before locking assumptions.
Desk Research
We merge vehicle-parc, production, and trade series from UN Comtrade, IEA EV Data Explorer, Eurostat, ACEA, CAAM, and JAMA with peer-reviewed motor-efficiency papers, SEC filings from leading battery makers, and intelligence drawn through D&B Hoovers plus Dow Jones Factiva. These titles are illustrative; many additional public and subscription feeds reinforce every datapoint.
Market-Sizing & Forecasting
A top-down build starts with national EV parc and annual sales. Penetration pools are multiplied by average battery capacity, cost curves, and powertrain content per vehicle. Supplier roll-ups and sampled ASP × volume checks give the bottom-up sense check, keeping totals within +/-5 percent. Variables such as nickel-rich cathode share, SiC inverter adoption, charger density, CO2 targets, and mean motor power feed a multivariate regression that projects the market through 2030.
Data Validation & Update Cycle
Outputs clear automated variance flags, senior peer review, and sector-lead sign-off. Reports refresh yearly, with mid-cycle updates when EV sales or battery costs swing more than ten percent from baseline.
Why Our Electric Vehicle Powertrain Baseline Stands Up
Published estimates often diverge because authors pick different component mixes, price years, and refresh cadences.
Mordor Intelligence anchors its 2025 value at USD 259.92 billion after limiting scope to OEM systems and revisiting models each quarter. Key gap drivers elsewhere include inclusion of retrofit kits, use of pre-pandemic cost curves, and currency rates frozen at announcement dates.
Benchmark comparison
| Market Size | Anonymized source | Primary gap driver |
|---|---|---|
| USD 259.92 B (2025) | Mordor Intelligence | None |
| USD 140.30 B (2024) | Global Consultancy A | Retrofit kits included; cabling omitted |
| USD 85.71 B (2024) | Industry Benchmark B | 2022 ASP basis; 800 V uptake ignored |
| USD 118.87 B (2022) | Regional Study C | 2021 volumes extrapolated; 2022 surge missed |
These comparisons show that consistent scope, current pricing, and verified adoption ratios make Mordor's baseline the most balanced and transparent starting point for decision-makers.


Key Questions Answered in the Report
How large is the Electric Vehicle Powertrain market today?
The market size reached USD 259.92 billion in 2026 and is projected to reach USD 687.64 billion by 2031.
Which component segment is growing the fastest?
Power electronics is forecast to deliver a 29.42% CAGR through 2031, outpacing batteries, motors, and transmissions.
Which region will lead future demand?
Asia-Pacific already commands 57.66% share and is tracking a 26.64% CAGR thanks to integrated supply chains and policy incentives.
How are fleet retrofits affecting the market?
Aftermarket kits, though only 7.63% of 2025 revenue, are climbing at a 27.12% CAGR through 2031 as commercial operators electrify existing diesel assets.
What is the main supply-chain risk for manufacturers?
Volatility in lithium, nickel, and cobalt prices can shift battery pack costs by several hundred dollars per vehicle within a single year.
Page last updated on:


