
Smart Toys Market Size and Share
Market Overview
| Study Period | 2020 - 2031 |
|---|---|
| Market Size (2026) | USD 24.01 Billion |
| Market Size (2031) | USD 42.61 Billion |
| Growth Rate (2026 - 2031) | 12.18 % |
| Fastest Growing Market | Asia Pacific |
| Largest Market | North America |
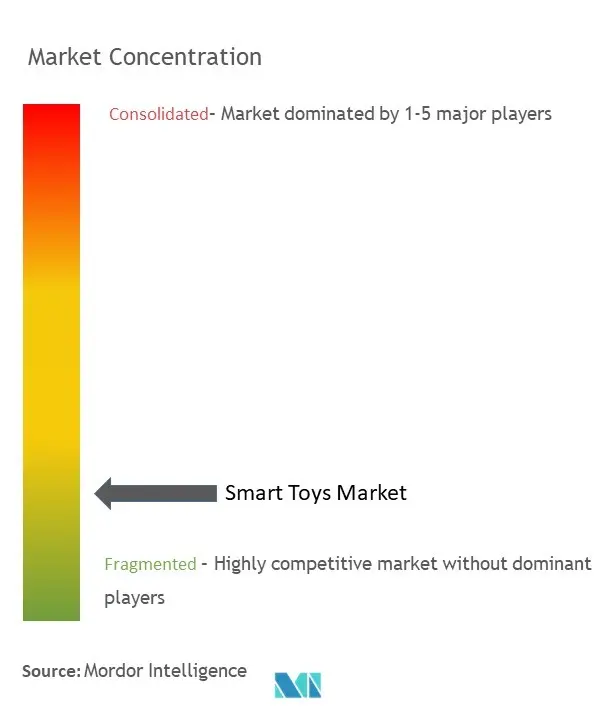
| Market Concentration | Low |
Major Players *Disclaimer: Major Players sorted in no particular order Image © Mordor Intelligence. Reuse requires attribution under CC BY 4.0. | |
Smart Toys Market Analysis by Mordor Intelligence
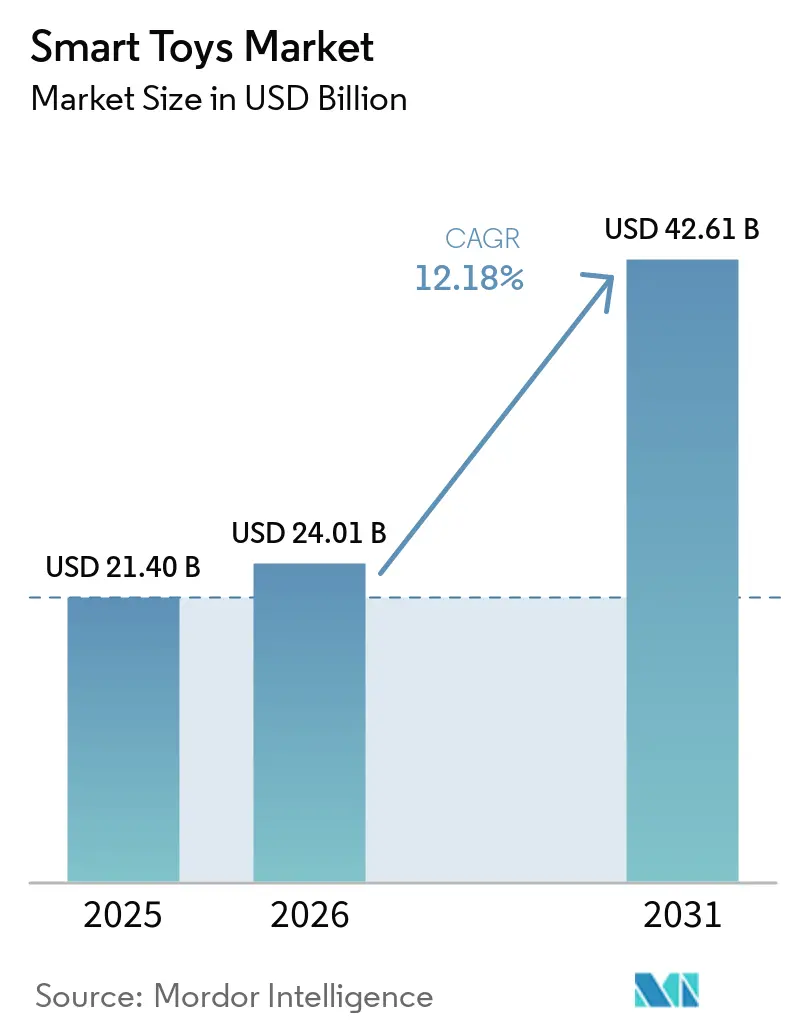
The Smart Toys Market size was valued at USD 21.40 billion in 2025 and estimated to grow from USD 24.01 billion in 2026 to reach USD 42.61 billion by 2031, at a CAGR of 12.18% during the forecast period (2026-2031).
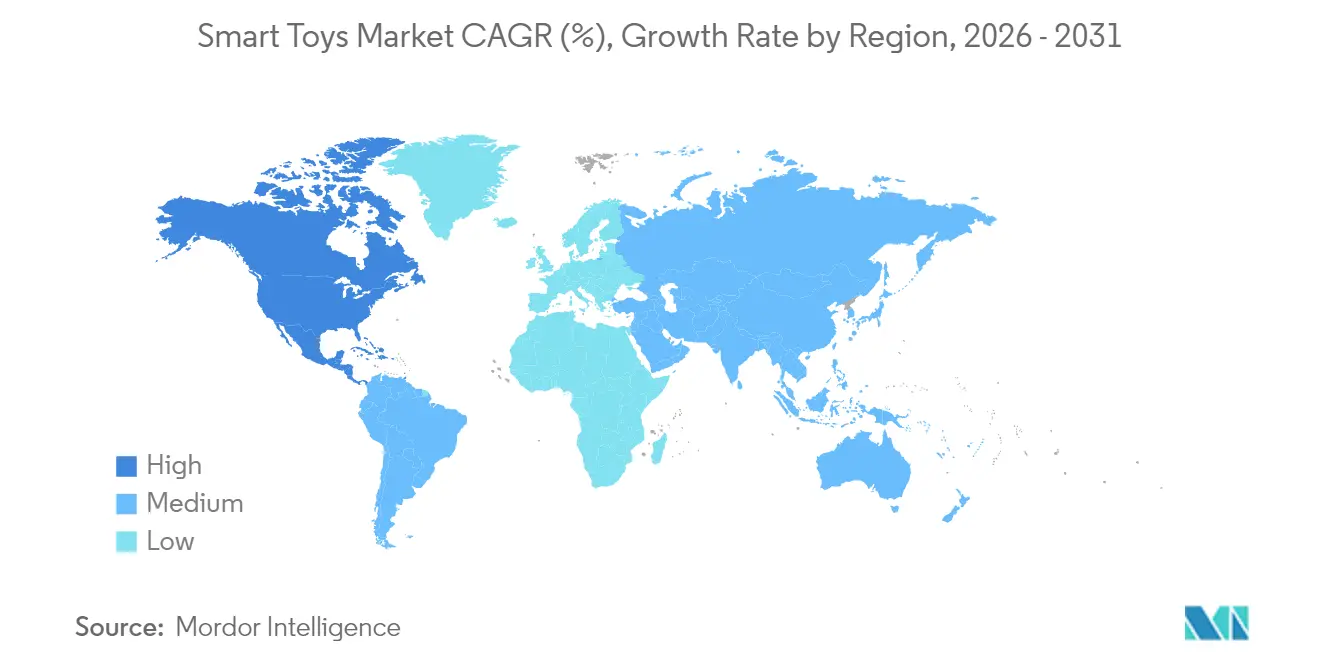
This growth is underpinned by rapid advances in kid-safe large language models, rising parental demand for screen-free learning, and regulatory clarity that protects children’s data without curbing innovation. Premium connected experiences powered by edge AI and 5G are expanding average selling prices, while subscription-based content updates lengthen product life cycles and smooth revenue streams. Strategic technology partnerships between incumbent toy makers and cloud or AI vendors are compressing innovation timelines, and retailer private-label initiatives are reshaping supply-chain bargaining power. Geographically, North America retains leadership on the back of high disposable income and established ed-tech adoption, yet Asia-Pacific is accelerating fastest as governments embed hands-on robotics within STEM curricula.
Key Report Takeaways
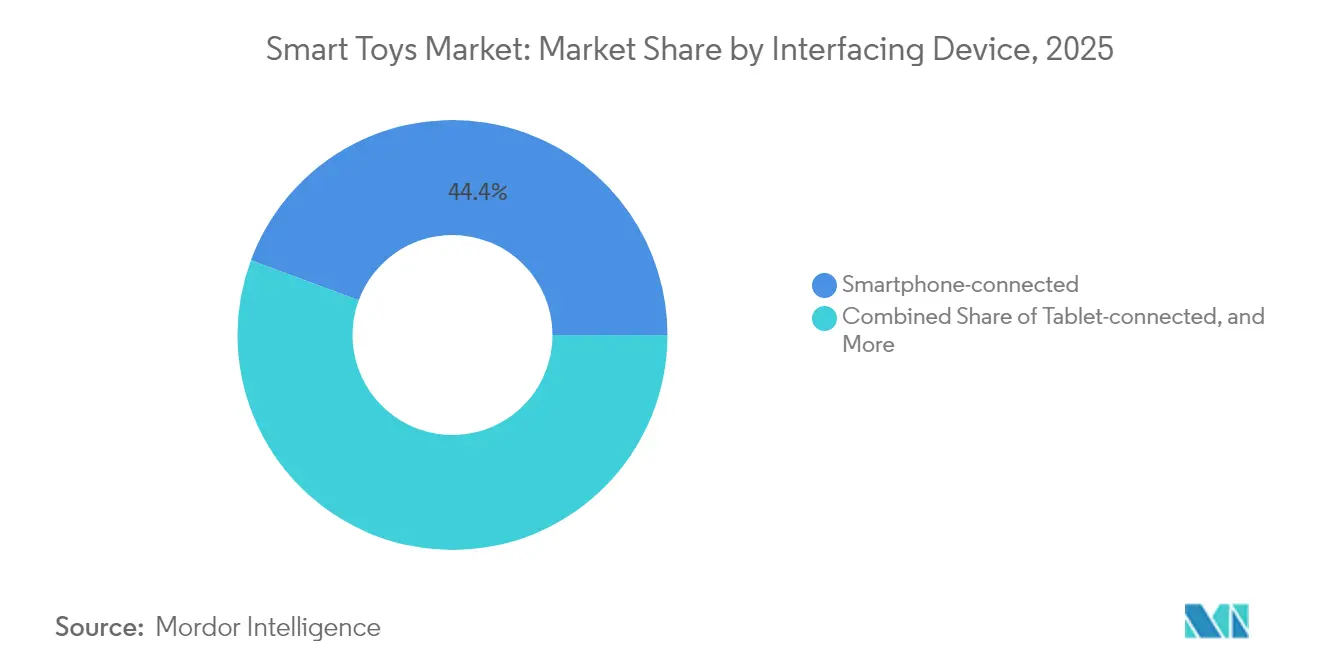
- By interfacing device, smartphone-connected toys led with 44.35% revenue share in 2025; console-connected toys are projected to grow at 21.73% CAGR to 2031.
- By technology, Wi-Fi solutions held 51.25% of the smart toys market share in 2025, while NFC/RFID connectivity is expanding at 19.52% CAGR through 2031.
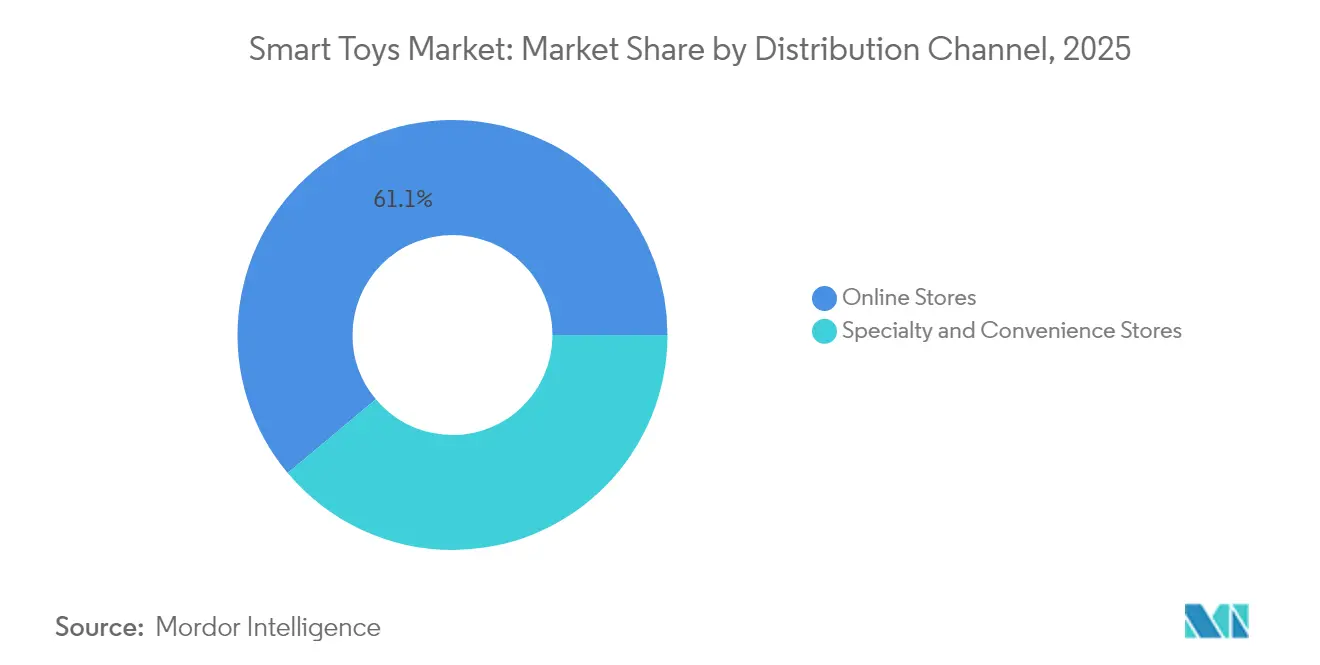
- By distribution channel, online stores accounted for 61.10% share of the smart toys market size in 2025 and are advancing at 18.23% CAGR during 2026-2031.
- By geography, North America commanded 33.55% of 2025 global revenue; Asia-Pacific is forecast to post the highest regional CAGR at 14.58% to 2031.
- Mattel, LEGO, Hasbro, Spin Master, and WhalesBot collectively controlled 54% of 2024 global revenue, indicating a moderately concentrated competitive field.
Note: Market size and forecast figures in this report are generated using Mordor Intelligence’s proprietary estimation framework, updated with the latest available data and insights as of 2026.
Market Trends and Insights
Drivers Impact Analysis of Smart Toys Market*
| Driver | (≈) % Impact on CAGR Forecast | Geographic Relevance | Impact Timeline |
|---|---|---|---|
| Rapid rollout of kid-safe AI/LLM speech engines | +3.20% | Global, with early adoption in North America & EU | Medium term (2-4 years) |
| Parental shift toward screen-free interactive ed-tech | +2.80% | North America & EU core, expanding to APAC | Short term (≤ 2 years) |
| Retailer private-label smart-toy lines expand shelf-space | +1.90% | Global retail chains, strongest in North America | Short term (≤ 2 years) |
| Mainstream STEM curricula mandate hands-on robotics kits | +2.10% | APAC core, with policy adoption in EU & North America | Long term (≥ 4 years) |
| 5G/edge-cloud lowers latency for real-time multiplayer play | +1.40% | Urban centers globally, led by APAC & North America | Medium term (2-4 years) |
| Toy-as-a-Service (TaaS) subscription models gain traction | +1.10% | North America & EU early adopters, expanding globally | Long term (≥ 4 years) |
| Source: Mordor Intelligence | |||
Rapid rollout of kid-safe AI/LLM speech engines
Child-appropriate language models now enable conversational play that adapts in real time, shifting toys from pre-set scripts to genuinely interactive companions. Edge-based architectures such as the DAVID Smart-Toy platform process speech locally, guarding privacy while delivering rich dialogue. Commercial products like Curio Interactive’s Grok, priced at USD 99, couple Wi-Fi connectivity with safe generative AI for children aged three and up. Shanghai-based FoloToy’s Alilo Honey Bunny extends the approach with multi-language support, underscoring how natural language interaction has become a core differentiator in the premium tier
Parental shift toward screen-free interactive ed-tech
Cross-sectional studies conducted in Guangzhou and Shenzhen show that multi-sensory educational toys significantly improve engagement indices and cognitive outcomes over tablet-only alternatives. Parallel Japanese surveys reveal rising acceptance of emotional AI in early learning, indicating broad cultural readiness for physical-digital hybrids. Robotics vendor WhalesBot has already partnered with 11,000 schools across 31 countries and runs contests drawing 100,000 participants annually, validating institutional appetite for tangible coding platforms
Retailer private-label smart-toy lines expand shelf space
Big-box and specialty retailers are creating exclusive connected-toy assortments to boost margins and tighten customer loyalty. Learning Express Toys reports a 5% year-to-date sales lift after dedicating floor space to value-priced private-label STEM kits and launching live social-media selling, pushing average basket sizes to USD 42.20. Gross margins on these house brands reach 40-50%, motivating aggressive SKU expansion.
Mainstream STEM curricula mandate hands-on robotics kits
China’s national smart-education blueprint prioritizes digital literacy and mandates experiential robotics exercises in classrooms Complementary preschool legislation sets quality standards for technology-enhanced environments, cementing demand for programmable kits. WhalesBot and similar suppliers now customize block-based coding courses that plug directly into official lesson plans, ensuring steady institutional procurement even when discretionary spending softens
Restraints Impact Analysis of Smart Toys Market*
| Restraint | (≈) % Impact on CAGR Forecast | Geographic Relevance | Impact Timeline |
|---|---|---|---|
| Rising compliance costs under global children-data laws | -2.30% | Global, strictest enforcement in EU & North America | Short term (≤ 2 years) |
| Battery-safety recalls erode consumer trust | -1.70% | Global, regulatory focus in North America | Short term (≤ 2 years) |
| Open-source firmware cloning hits premium brands | -1.40% | Global; risk concentrated in ODM hubs & online marketplaces | Short to medium term (≤ 3 years) |
| Semiconductor supply volatility inflates BOM costs | -2.20% | Global; sensitive to East Asia foundry capacity & U.S.–China export controls | Short-term shocks with medium-term cyclicality (1–4 years) |
| Source: Mordor Intelligence | |||
Rising compliance costs under global children-data laws
The EU’s draft Toy Safety Regulation introduces digital product passports and mental-health safeguards for connected toys, with a 30-month grace period but sweeping documentation demands. In the U.S., the Consumer Product Safety Commission is adding button-cell battery durability tests under Reese’s Law, escalating certification outlays for smaller brands.[1]U.S. Consumer Product Safety Commission, “Button Cell Battery Safety Rulemaking,” cpsc.gov These dual obligations raise engineering expenses and lengthen release cycles, favoring incumbents with dedicated regulatory teams.
Battery-safety recalls erode consumer trust
CPSC research links more than 70,000 emergency visits to battery ingestion incidents from 2010-2019, triggering stricter compartment integrity standards. Manufacturers must redesign latches and pass torsion tests within six months of final rule publication, adding tooling costs while parents grow wary of battery-powered toys. Reputational damage lingers, leading many households to prefer established brands with proven safety track records.
*Our forecasts treat driver/restraint impacts as directional, not additive. The impact forecasts reflect baseline growth, mix effects, and variable interactions.
Smart Toys Market Segment Analysis
By Interfacing Device:
Smartphone Dominance Drives Ecosystem IntegrationSmartphone-connected toys captured 44.35% of the smart toys market share in 2025, underlining how households leverage existing mobile hardware for control, display, and audio. Console-connected products are poised to post a 21.73% CAGR between 2026-2031, reflecting synergies with AAA gaming ecosystems and dedicated graphics pipelines.
The smartphone cohort benefits from zero incremental screens and ubiquitous mobile data, letting firms focus on sensory actuators and AI features instead of processors. TCL’s modular AI companion robot “Ai Me” exemplifies this: the toy commandeers users’ phones for heavy computation while delivering animated facial expressions through onboard servos. Console-linked growth springs from hardware horsepower that supports real-time, multi-user STEM simulations unreachable on mid-range handsets, enticing families already invested in home gaming.



By Technology:
Wi-Fi Infrastructure Enables Advanced CapabilitiesWi-Fi modules underpinned 51.25% of total revenue in 2025, confirming that bandwidth-hungry cloud inference and multiplayer modes remain core purchase triggers. NFC/RFID tags will accelerate at 19.52% CAGR to 2031 as preschool lines adopt tap-and-play pairing that avoids passwords and routers.
Wi-Fi momentum rides on devices such as EBO X, which streams 4 K security footage while hosting GPT-4o mini for speech interaction, a workload only possible with stable broadband. NFC/RFID penetration deepens in early-learning toys where instant recognition fosters “magical” cause-and-effect feedback; lower silicon costs and minimal user setup further widen appeal.
By Distribution Channel:
Online Retail Consolidation AcceleratesOnline stores commanded 61.10% of 2025 global revenue and are forecast to expand at 18.23% CAGR through 2031, signposting enduring channel migration.Specialty outlets preserve a role in discovery and demonstration, yet trail in growth pace.
E-commerce leaders harvest first-party behavioral data to personalize recommendations and cross-sell subscription content, delivering frictionless conversion that bricks-and-mortar formats cannot match. Physical retailers respond by curating immersive demo zones and running livestream commerce to blend digital reach with tactile evaluation, but inventory breadth and dynamic pricing still favor the online model.
Geography Analysis
North America Smart Toys Market
North America led with 33.55% of 2025 global revenue, supported by stringent but transparent safety regulations that bolster consumer confidence. Disposable income levels remain high, and parental spending on enrichment products is resilient despite a 2.2% uptick in toy prices following tariff adjustments in early 2025. Major vendors hedge risk by diversifying assembly footprints out of China; Mattel plans to drop Chinese output below 15% by 2026, reinforcing supply resilience.
APAC Smart Toys Market
Asia-Pacific is forecast to log a 14.58% CAGR to 2031, fueled by government mandates that embed robotics in STEM syllabi. China’s humanoid-robot guidelines and India’s USD 3 billion domestic toy program lower production costs and shorten lead times, catalyzing regional supply ecosystems. Japan’s cultural affinity for emotive robotics further elevates demand for high-spec companions that blend entertainment with therapeutic value.
EMEA and South America Smart Toys Market
Europe sustains mid-single-digit expansion on the back of rigorous compliance regimes that create entry hurdles and justify price premiums. The EU’s digital product passport initiative rewards firms with exhaustive traceability, aligning with consumer appetite for safe, sustainable purchases Meanwhile, South America and the Middle East & Africa show early-stage momentum as middle-class spending climbs, but currency volatility and patchy broadband slow premium penetration.

Regulatory Landscape
Regulation for smart and connected toys is converging around three pillars: baseline physical toy safety, digital-age product traceability, and children-focused privacy rules. In the United States, ASTM F963-23 became the mandatory federal toy safety standard in January 2024 under the Consumer Product Safety Commission (CPSC) framework, raising the compliance floor for mechanical, electrical, and materials safety testing that increasingly applies to tech-enabled toys.
In Europe, Regulation (EU) 2025/2509 was adopted in November 2025, repealing Directive 2009/48/EC and entering into force on 1 January 2026, with application from 1 August 2030. The regulation introduces mandatory digital product passports for toys sold in the EU, bringing traceability, cybersecurity-related documentation, and connected-toy risk assessment earlier into product design and supplier qualification. Separately, the amended US COPPA rule has an April 2026 compliance deadline, expanding definitions of personal information to include biometrics, which directly affects voice, vision, and behavioral features common in AI-enabled toys. In February 2026, CPSC leadership also emphasized use of existing authorities for hazards in smart and AI-enabled toys while investing in AI-enabled injury surveillance tools. In the United Kingdom, the Department for Science, Innovation and Technology launched a July 2026 call for evidence on AI-enabled toy safety, indicating policy scrutiny even before new statutory obligations are finalized.
Value Chain Analysis
The smart toys value chain spans concept and character licensing, industrial design and safety engineering, electronics and firmware development, manufacturing and assembly, then omnichannel distribution with ongoing digital service delivery. Upstream inputs include plastics and tooling for traditional toy parts, plus PCBs, sensors, microphones/speakers, batteries, and connectivity modules (Wi-Fi, Bluetooth, NFC/RFID) that are integrated with companion apps or cloud services. As smart toys increasingly behave like connected consumer electronics, software maintenance, cybersecurity patching, and content operations (including subscription content updates) sit in the downstream service layer rather than as optional add-ons.
Manufacturing is commonly split between toy molding/assembly and electronic integration/test, with ODM/EMS partners playing a larger role than in conventional toys. Supply-chain planning has been shaped by component volatility and logistics disruptions, alongside tariff-driven cost pressure. Major manufacturers such as Mattel and Hasbro accelerated shifts in production away from China toward India, Vietnam, and Indonesia during 2025, and they also pursued design-for-cost actions (for example, simplifying packaging or removing non-essential electronic accessories) to manage landed-cost inflation. Compliance is becoming more digital-first, particularly in Europe where Regulation (EU) 2025/2509 requires a toy digital product passport, pushing brands and suppliers to embed traceability and documentation into sourcing, manufacturing QA, and product lifecycle management rather than treating certification as an end-of-line step.
Competitive Landscape
Incumbent giants preserve scale advantages in branding, licensing, and retail reach, yet face disruption from AI-native entrants. Mattel’s tie-ups with OpenAI and Google Cloud accelerate feature rollouts, shrinking data-processing cycles from one month to one minute. LEGO posted a record 2024 revenue of DKK 74.3 billion (USD 10.8 billion), investing heavily in sustainable materials that resonate with eco-conscious buyers.
Cross-licensing signals collaboration over confrontation: Mattel and Hasbro now co-produce titles such as Monopoly Barbie Edition, pooling brand equity to amplify shelf impact. Spin Master’s acquisition of Melissa & Doug broadens educational depth and consolidates distribution muscle, reflecting a trend toward bolt-on deals that add STEM credibility..
Disruptors like Curio Interactive and Casio focus on subscription-backed or adult-oriented smart companions, carving niches that incumbents may deem low volume but high engagement. Market entry barriers remain moderate because open-source AI stacks lower software costs; however, certification and retail access still tilt odds toward established firms, keeping the competitive field moderately concentrated.
Smart Toys Industry Leaders
Lego Group
Mattel
Playmobil (Brandstätter)
VTech Holdings
Hasbro
- *Disclaimer: Major Players sorted in no particular order
Smart Toys Market Companies Covered in this Report
- Mattel
- LEGO Group
- Hasbro
- Spin Master
- VTech Holdings
- Playmobil (Brandstatter)
- LeapFrog Enterprises
- Sphero
- UBTECH Robotics
- WowWee Group
- Pillar Learning
- Seebo Interactive
- Curio Interactive
- TOSY Robotics
- TCL
- Fisher-Price (Mattel)
- Xiaomi (Smart Bunny line)
- Silverlit Electronics
- Miko.ai
- Casio

Market Opportunities and Future Outlook
A near-term opportunity lies in privacy-preserving, kid-safe conversational play that can run with lower cloud dependence, supporting product differentiation as children-data expectations tighten. The April 2026 compliance deadline for the amended COPPA rule, including expanded personal information definitions such as biometrics, increases the value of architectures that minimize data collection and support clear parental controls, while still enabling interactive speech features that are now a key premium trigger. At the same time, the EU Toy Safety Regulation (EU) 2025/2509 entered into force on 1 January 2026 and mandates digital product passports with application from 1 August 2030. This creates whitespace for platforms and service providers that package traceability, documentation workflows, and connected-toy risk assessment into scalable toolchains for brands and OEM/ODM partners.
Another opportunity is supply-chain localization and the build-out of new manufacturing hubs for connected-toy electronics as tariffs, lead-time risk, and component sourcing pressures drive diversification beyond China-centric footprints. Corporate actions in 2026 point to this shift: Pop Mart opened a manufacturing hub in Mexico and expanded production in Cambodia and Indonesia to support North American demand, while India continues to attract smart-toy manufacturing and R&D capital. This includes Mirana Toys raising a Rs 57.5 crore Series A round in April 2026 and Veva Toys Global outlining a 5-year INR 1,000 crore investment plan spanning R&D and manufacturing. On the demand side, school-linked STEM and robotics procurement, notably in Asia-Pacific, supports product roadmaps that integrate curriculum-ready robotics kits and modular upgrade paths. That demand complements toy-as-a-service models in which physical products are refreshed via paid content and software updates.
Recent Industry Developments in Smart Toys Market
- June 2026: The LEGO Group unveiled LEGO Pokemon SMART Play sets in partnership with The Pokemon Company International, with a commercial release scheduled for August 1, 2026. The announcement extends LEGO's connected-play approach into another global licensed franchise, broadening the addressable audience for hybrid physical-digital play ecosystems.
- June 2025: Mattel partnered with OpenAI to build AI-powered toys for users aged 13 and up and stated safety and responsible-use commitments for the collaboration. This accelerates the productization of generative AI features in toys and lifts the competitive bar for conversational interaction, content updating, and governance across connected-toy portfolios.
- January 2024: The US Consumer Product Safety Commission made ASTM F963-23 the mandatory federal safety standard for toys. This established a clearer compliance baseline for physical and electrical safety testing that smart-toy manufacturers must meet alongside privacy and cybersecurity considerations.


Smart Toys Market Report Scope and Research Methodology
Market Definition and Coverage
For this study, the smart toys market includes toys that use onboard electronics and connectivity to respond to a child or the surrounding environment, enabling interactive play and learning. The market sizing is captured in value terms across consumer purchases of these connected and tech-enabled toys.
Scope exclusions: We do not count non-electronic traditional toys and simple battery toys that do not sense, connect, or adapt in a meaningful way.
Segments Covered in This Report
- By Interfacing Device
- Smartphone-connected
- Tablet-connected
- Console/Other-connected
- By Technology
- Wi-Fi
- Bluetooth
- NFC/RFIDandOthers
- By Distribution Channel
- Online Stores
- SpecialtyandConvenience Stores
- By Geography (Value)
- North America
- United States
- Canada
- South America
- Brazil
- Argentina
- Europe
- Germany
- United Kingdom
- France
- Russia
- Asia-Pacific
- China
- Japan
- India
- Middle East and Africa
- GCC
- South Africa
- North America
Data Sources, Market Sizing, and Validation
Desk Research
Desk work started by building a clear market definition and mapping it to measurable public indicators. For demand direction and regional weightings, we used sources such as US Census retail trade tables, USITC DataWeb for trade flows, Eurostat consumer and trade statistics, UN Comtrade customs data, and OECD household spending indicators.
To anchor assumptions, we also reviewed company annual reports and investor presentations for revenue mix signals, along with reputable press coverage and product announcements to validate the timing of technology adoption (Wi-Fi, Bluetooth, and similar standards). Where needed, paid subscriptions for company financials and patent databases were used to verify corporate activity and to avoid double counting across adjacent toy electronics categories. These desk sources are not exhaustive, and many other public and reference materials were consulted for data collection, validation, and clarification.
Primary Interviews and Surveys
Primary work focused on confirming what actually sells as a smart toy in each region and how pricing moves over the forecast window. We spoke with a mix of toy brands, component and module ecosystem participants, distributors and retailers, and subject experts across APAC, EMEA, and the Americas so assumptions on channel mix, feature adoption, and average selling prices could be confirmed and adjusted.
Distribution of primary research fieldwork respondents
| Company type | Respondent position | Region |
|---|---|---|
| Top tier: 27% | CXOs: 16% | APAC: 39% |
| Mid tier: 54% | Functional/Unit leaders: 36% | EMEA: 34% |
| Smaller Players: 19% | Managers: 48% | Americas: 27% |
Market-Sizing & Forecasting
The market size was built using a top-down demand pool approach, where consumer toy spending patterns, import and export signals, and connected toy adoption are reconstructed into a smart-toy value total. To keep the model realistic, results were then checked using selective bottom-up approximations, such as sampled product pricing across channels, shipment and availability checks by region, and supplier and retailer feedback on volume direction.
Inputs used in the model included connectivity feature mix (Wi-Fi versus Bluetooth and similar), online versus offline channel share, typical selling price bands for interactive toys, the pace of new product launches, and regional seasonality around major gifting periods. When a data gap existed for a smaller country, we used proxy ratios from similar markets (income level, toy spend per child, and channel maturity) and then re-checked the output with interview feedback.
For forecasting, scenario analysis was used with a base case and sensitivity ranges, since pricing and feature adoption can shift quickly with technology cycles. The final growth path was aligned to expert consensus on adoption rates, channel expansion, and realistic price progression rather than a single straight-line assumption.
Data Validation & Update Cycle
Outputs were validated by comparing model totals with independent signals like trade movement patterns, retail channel growth indicators, and observed pricing ranges from store checks. Variances that looked too high or too low were flagged, re-worked, and then reviewed in a second analyst pass before sign-off so basic arithmetic, currency conversions, and assumptions stayed consistent.
The report is refreshed annually, and interim updates are triggered when material events occur, such as major regulatory changes on connected toys, a step-change in connectivity standards, or sudden demand shocks. Before delivery, a final analyst review is completed so the published numbers reflect the latest available information.
Mordor Intelligence's Smart Toys Market Size Versus Other Published Estimates
Published numbers for smart toys can differ a lot, even when the same years are referenced, because each publisher draws the line differently around what qualifies as a smart toy and how prices and channel mix are projected. Differences also come from the chosen base year, currency timing, and how aggressively adoption is assumed to accelerate.
Some external estimates appear to fold in a wider set of interactive or educational electronic toys, which can pull the starting value up or down depending on what is bundled. In Mordor Intelligence, a product is counted only when onboard electronics and connected or sensing features drive adaptive interaction, and then the total is checked using channel-level pricing and regional adoption signals so non-smart toys do not inflate the value.
Benchmark comparison
| Source | Market Size | Gaps in Research Methodology |
|---|---|---|
| Mordor Intelligence | USD 24.01 B (2026) | |
| Global Research Publisher A | USD 14.39 B (2025) | Uses a different base year and appears to apply a narrower counted set of smart toys, which can exclude some connected categories captured through device and technology mapping. The gap can also widen if pricing is held conservative in early years across channels. |
| Industry Research Publisher B | USD 19.30 B (2024) | Starts from an earlier year and may include a broader interactive electronics set, where connectivity and adaptive behavior are not always separated cleanly. Currency timing and faster assumed adoption rates can shift the value even before the forecast period begins. |
Across the three figures, the spread is mainly explained by what gets classified as a smart toy, the starting year used for conversion, and how average selling prices are moved forward. By tying the estimate to observable channel pricing, connectivity feature mix, and region-level adoption checks, our model stays repeatable and easier to reconcile against real market signals.


Key Questions Answered in the Report
What is the current value of the smart toys market?
The smart toys market stands at USD 24.01 billion in 2026 and is projected to climb to USD 42.61 billion by 2031.
Which region grows fastest through 2031?
Asia-Pacific leads growth with a 14.58% CAGR, driven by government-mandated STEM curricula and expanding domestic manufacturing capacity.
Which connectivity technology dominates smart toys?
Wi-Fi holds 51.25% revenue share thanks to its ability to support cloud-based AI, video, and multiplayer features.
Why are compliance costs rising for manufacturers?
New EU digital safety rules and U.S. battery-safety standards require extensive documentation and design changes, increasing development expenses.
How are retailers influencing the competitive landscape?
Large chains are launching private-label smart-toy lines that deliver higher margins and tighter control over features, shifting negotiating power away from manufacturers.
What business model innovations are emerging?
Toy-as-a-Service subscriptions are pairing physical products with ongoing content updates, creating recurring revenue and prolonging engagement.
Page last updated on:


 Your data is secure and never sold or shared.


