Bitcoin Technology Market Size and Share
Market Overview
| Study Period | 2020 - 2031 |
|---|---|
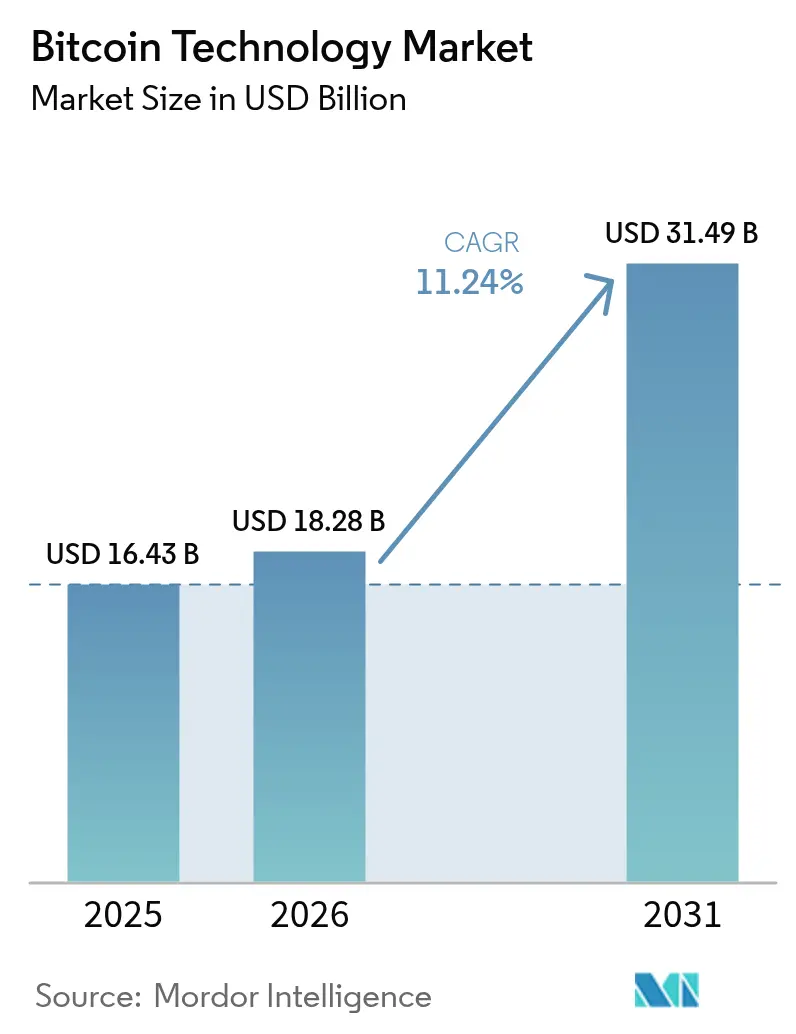
| Market Size (2026) | USD 18.28 Billion |
| Market Size (2031) | USD 31.49 Billion |
| Growth Rate (2026 - 2031) | 11.24% CAGR |
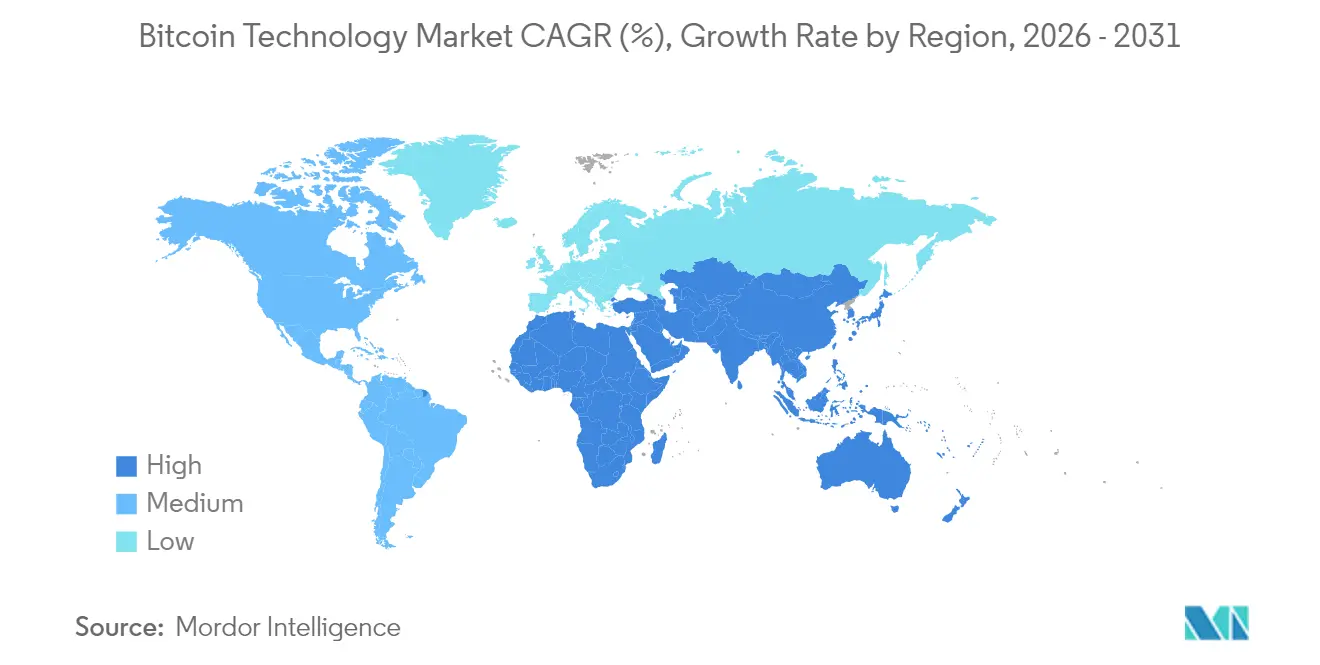
| Fastest Growing Market | Middle East |
| Largest Market | Asia Pacific |
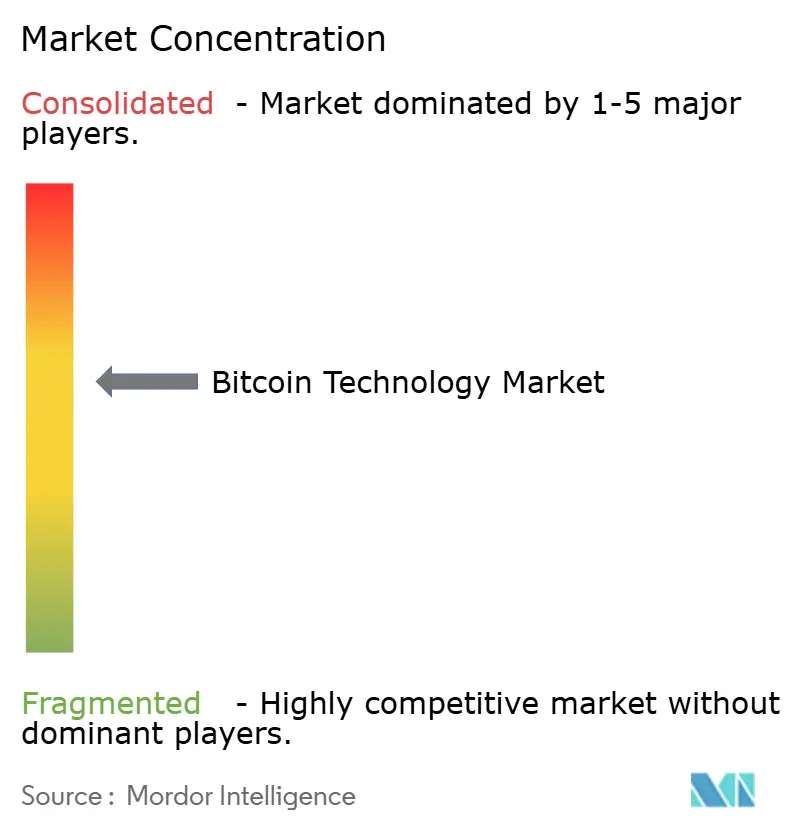
| Market Concentration | Medium |
Major Players *Disclaimer: Major Players sorted in no particular order Image © Mordor Intelligence. Reuse requires attribution under CC BY 4.0. | |
Bitcoin Technology Market Analysis by Mordor Intelligence
The Bitcoin technology market size is expected to grow from USD 16.43 billion in 2025 to USD 18.28 billion in 2026 and is forecast to reach USD 31.49 billion by 2031 at 11.24% CAGR over 2026-2031. Institutional balance-sheet adoption, the April 2024 block subsidy halving, and United States spot ETF approvals are transforming the Bitcoin technology market from retail-trading-led to enterprise-infrastructure driven. Hardware demand is plateauing as application-specific integrated circuit (ASIC) shipments face a post-halving oversupply, while services, such as custody, compliance, and Lightning Network processing, are scaling rapidly in response to new rules for qualified custodians. The Asia Pacific mining base is relocating toward renewable-powered hubs, and the Middle East is emerging as the fastest-growing treasury and hosting destination. Competitive dynamics are shifting from hash rate accumulation toward full-stack service provision and renewable energy arbitrage, opening up opportunities for Layer 2 providers and tokenization platforms.
Key Report Takeaways
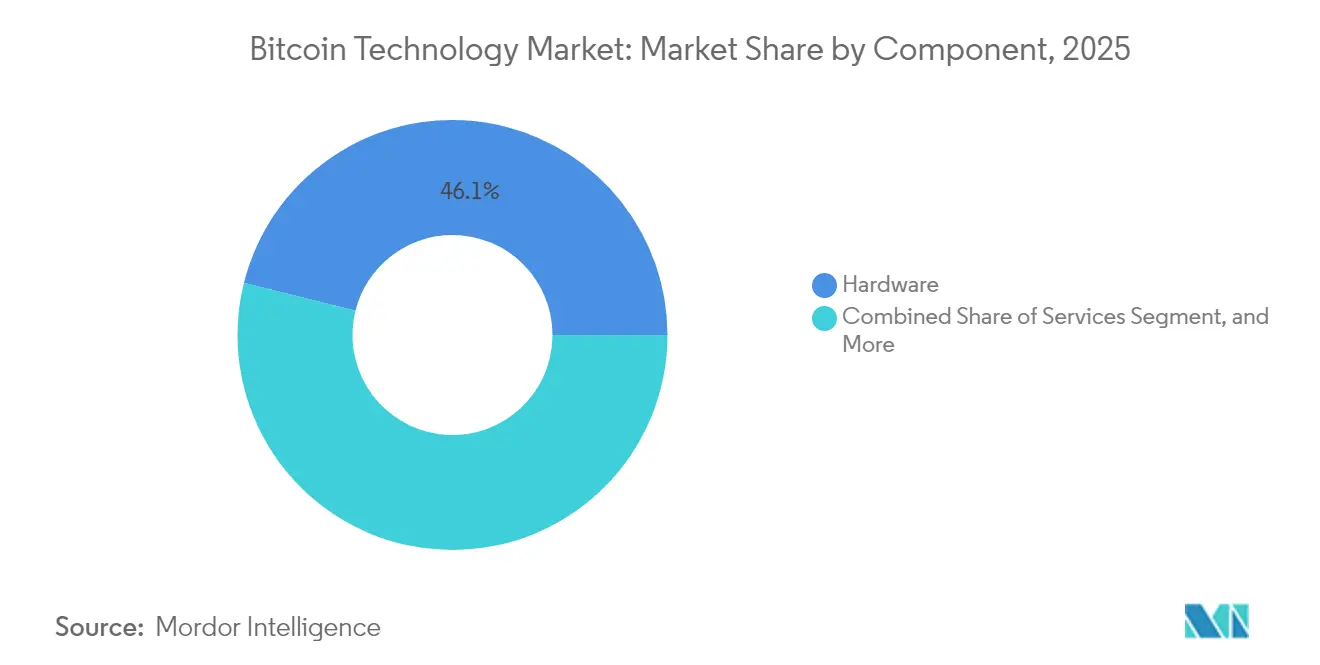
- By component, hardware led with a 46.10% share of the Bitcoin technology market in 2025; services are forecast to expand at a 11.74% CAGR through 2031.
- By application, payments accounted for 38.70% of the Bitcoin technology market size in 2025, while smart contracts are expected to advance at a 12.34% CAGR through 2031.
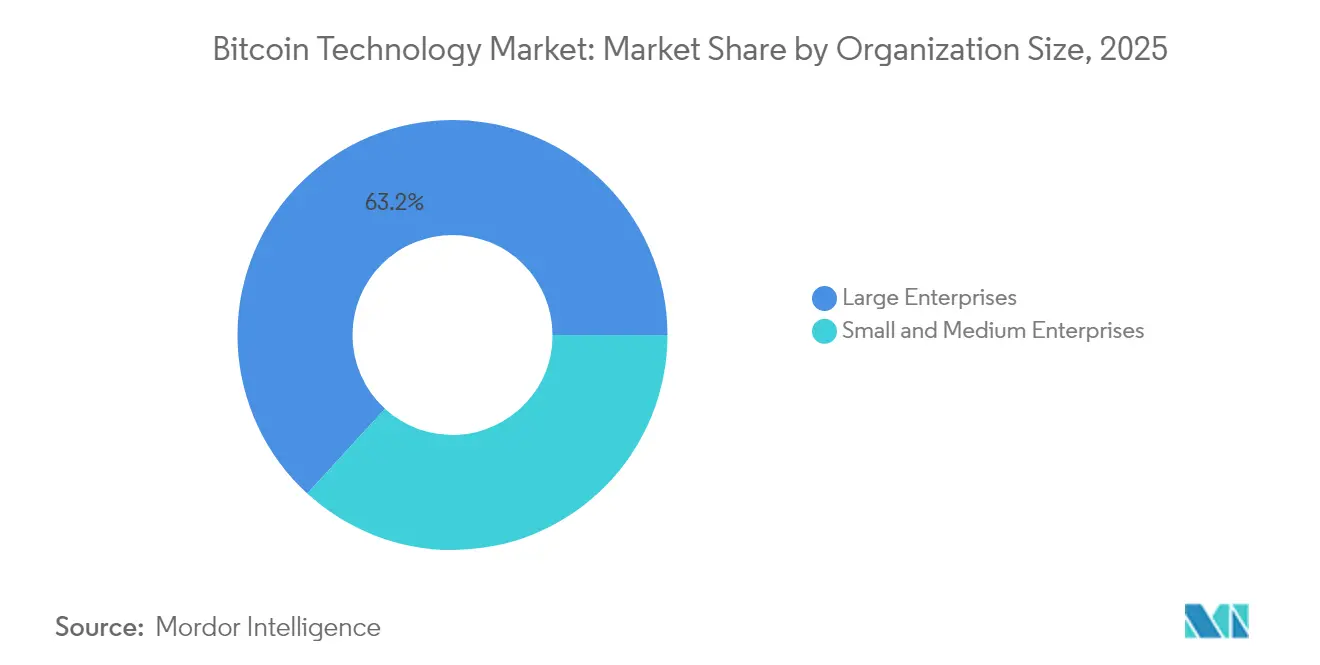
- By organization size, large enterprises held a 63.20% share of the Bitcoin technology market in 2025, whereas small and medium enterprises are expected to grow at a 11.55% CAGR to 2031.
- By end-user industry, financial services dominated with a 41.75% share of the Bitcoin technology market in 2025; healthcare is forecast to grow at a 12.29% CAGR between 2026 and 2031.
- By geography, the Asia Pacific captured 37.40% of the Bitcoin technology market share in 2025, and the Middle East is projected to register a 12.18% CAGR through 2031.
Note: Market size and forecast figures in this report are generated using Mordor Intelligence’s proprietary estimation framework, updated with the latest available data and insights as of 2026.
Global Bitcoin Technology Market Trends and Insights
Drivers Impact Analysis*
| Driver | (~) % Impact on CAGR Forecast | Geographic Relevance | Impact Timeline |
|---|---|---|---|
| Institutional Adoption by Fortune 500 Treasuries | +2.8% | North America and Europe, spillover to Asia Pacific | Medium term (2-4 years) |
| Regulatory Clarity in Major Economies | +2.3% | Global, concentrated in North America, Europe, and Middle East | Short term (≤ 2 years) |
| Renewable Energy Integration for Mining Economics | +1.7% | North America, Middle East, and Nordic Europe | Long term (≥ 4 years) |
| Halving-Driven Supply Contraction Effects | +1.5% | Global | Short term (≤ 2 years) |
| Layer 2 Scaling Solutions Maturity | +1.4% | Global, early adoption in North America and Europe | Medium term (2-4 years) |
| Tokenization of Real-World Assets on Bitcoin | +1.2% | North America, Europe, and Asia Pacific financial hubs | Long term (≥ 4 years) |
| Source: Mordor Intelligence | |||
Institutional Adoption by Fortune 500 Treasuries
Balance-sheet allocations by public corporations are reframing Bitcoin as a macro treasury hedge rather than a speculative trade. MicroStrategy exceeded 402,000 BTC holdings by December 2024, catalyzing peer adoption across technology and financial firms.[1]Michael Saylor, “MicroStrategy Acquires Additional Bitcoin,” MicroStrategy, microstrategy.com Tesla disclosed USD 184 million in digital assets, signaling mainstream corporate validation. Mid-cap CFOs follow suit because Bitcoin offers liquidity and non-correlation alongside bond-like fungibility. Impairment-only accounting remains a headwind, yet the Financial Accounting Standards Board’s 2023 proposal to allow fair-value marks could resolve the asymmetry by 2026. As clarity improves, treasury desks are integrating multi-signature custody and automated tax workflows to manage risk at scale.
Regulatory Clarity in Major Economies
United States approval of spot Bitcoin ETFs in January 2024 ended a decade of uncertainty over securities status and unlocked registered-investment-advisor allocations.[2]U.S. Securities and Exchange Commission, “Statement on Spot Bitcoin ETFs,” sec.gov Europe’s Markets in Crypto-Assets Regulation brought passportable licensing across 27 member states, cutting compliance duplication. Japan removed consumption tax on retail Bitcoin payments in March 2024, eliminating a 10% cost barrier. These milestones compress the regulatory risk premium, enabling banks, insurers, and pension funds to allocate without fear of retroactive action. Fragmentation persists in India and Nigeria, yet global liquidity deepens as the largest capital markets adopt harmonized rules.
Renewable Energy Integration for Mining Economics
Post-halving subsidy reductions amplify the need for low-cost power. Miners are co-locating with stranded wind and solar assets to purchase electricity near zero marginal cost. Marathon Digital’s 250 MW Texas wind farm exemplifies the model. The International Energy Agency estimated 52% renewable penetration in Bitcoin mining for 2024, higher than most heavy industries.[3]International Energy Agency, “Electricity 2024,” iea.org Grid operators now classify miners as flexible load resources, paying for demand-response services that stabilize frequency. This non-subsidy revenue hedge is crucial as block rewards keep halving.
Halving-Driven Supply Contraction Effects
The April 2024 halving cut new issuance to 3.125 BTC per block, tightening daily supply at the precise moment institutional inflows accelerated via ETFs. Reduced sell-pressure historically precedes multi-year appreciation as scarcity narratives gain traction. Miners face compressed revenues, prompting consolidation and hardware efficiency races, but holders benefit from supply-demand imbalance. Futures basis has narrowed, indicating arbitrageurs expect persistent spot demand in the Bitcoin technology market. The next halving cycle is already priced into treasury models.
Restraints Impact Analysis*
| Restraint | (~) % Impact on CAGR Forecast | Geographic Relevance | Impact Timeline |
|---|---|---|---|
| High Energy Consumption Criticism | -1.6% | Global, concentrated in Europe and North America | Medium term (2-4 years) |
| Cybersecurity Threats to Exchanges | -1.3% | Global, acute in Asia Pacific and emerging markets | Short term (≤ 2 years) |
| Regulatory Fragmentation Across Emerging Markets | -0.9% | Africa, South Asia, and Latin America | Long term (≥ 4 years) |
| Hashrate Centralization Risk | -0.7% | Global, concentrated in North America and Central Asia | Medium term (2-4 years) |
| Source: Mordor Intelligence | |||
High Energy Consumption Criticism
Environmental NGOs pressure policymakers to curtail proof-of-work mining. New York State extended a moratorium on fossil-fuel-powered facilities through 2024, forcing relocations. Europe’s MiCA now mandates public energy-use disclosure, raising compliance overhead for small miners. Asset managers face shareholder resolutions that link Bitcoin exposure to ESG targets, constraining capital inflows. Public perception lags renewable adoption rates, keeping the narrative risk alive through 2027.
Cybersecurity Threats to Exchanges
Exchange hacks continue to erode retail confidence. DMM Bitcoin’s USD 305 million loss in May 2024 triggered stricter Japanese custody rules. U.S. custody amendments require advisors to use qualified custodians, centralizing assets and creating single points of failure. Insurance and multi-signature wallets mitigate risks, yet human error and social-engineering persist. Regulatory penalties for breaches are rising, elevating compliance costs for smaller venues.
*Our forecasts treat driver/restraint impacts as directional, not additive. The impact forecasts reflect baseline growth, mix effects, and variable interactions.
Segment Analysis
By Component: Services Outpace Hardware as Infrastructure Matures
Services are projected to grow at an 11.74% CAGR through 2031 as enterprises prefer custody, compliance, and Lightning processing to capital-intensive mining gear. The Bitcoin technology market size for services benefits from the SEC’s qualified-custodian mandate, which pushed institutional assets toward regulated providers that can offer proof-of-reserve audits. Hardware retained 46.10% Bitcoin technology market share in 2025 but faces margin compression due to ASIC oversupply and energy-efficiency races.
Custody firms differentiate via insurance and geographic key sharding, while payment processors integrate instant Lightning settlement to bypass card-network fees. Tax-automation platforms are embedding compliance rules for over 50 jurisdictions, accelerating adoption among CFOs who require auditable reporting. Hardware vendors now market joules-per-terahash rather than absolute hashrate, acknowledging that electricity cost, not chip count, decides miner profitability. The service pivot signals that the Bitcoin technology market is entering a platform era where value accrues to usability and compliance rather than raw compute.


By Application: Smart Contracts Challenge Payments Dominance
Payments accounted for 38.70% of the Bitcoin technology market size in 2025 as remittances and e-commerce embraced instant settlement. Smart contracts, however, are projected to expand at a 12.34% CAGR, narrowing the gap by 2031. Taproot Assets and RGB enable tokenization without leaving Bitcoin’s security umbrella, lowering gas-fee risk for real-world asset sponsors.
Private equity funds now pilot real estate tokens, and supply-chain operators embed automated delivery-versus-payment clauses. Remittance providers cut corridor fees below 1% using Lightning channels, pressuring traditional money transfer operators. Regulatory scrutiny constrains centralized trading applications, nudging liquidity toward decentralization where self-custody reduces counterparty risk. The diversification of use cases underscores the Bitcoin technology market’s evolution from simple value transfer to programmable settlement.
By Organization Size: SMEs Accelerate Adoption Through Treasury Software
Large enterprises captured 63.20% Bitcoin technology market share in 2025 thanks to scale advantages in custody fees and over-the-counter liquidity. Yet small and medium enterprises are set to grow at an 11.55% CAGR as turnkey multi-signature platforms remove technical hurdles. Accounting suites now auto-import Bitcoin transactions into general ledgers, erasing manual entry bottlenecks.
SMEs in Latin America and Africa adopt Lightning-based payroll to avoid volatile local currencies, while North American tech start-ups hold Bitcoin as a hedge against inflationary fiat expansion. Large corporates focus on diversification strategies but move slower due to governance layers. The democratization of custody and tax tooling is flattening the adoption curve across firm sizes, expanding total addressable demand in the Bitcoin technology market.
By End User Industry: Healthcare Emerges as Fastest-Growing Vertical
Financial services dominated with 41.75% revenue in 2025, anchored by banks integrating settlement rails and asset managers listing ETFs. Healthcare is projected to grow at a 12.29% CAGR as clinical-trial sponsors deploy Bitcoin-based milestone contracts that trigger payments upon data submission. Immutable audit trails meet stringent compliance needs, while supply-chain track-and-trace satisfies Medical Device Regulation rules.
Retail and e-commerce merchants adopt Lightning checkout to eliminate chargeback fraud, boosting net margins by up to 300 basis points. Logistics companies timestamp custody transfers for high-value goods, reducing disputes. The vertical mix illustrates that the Bitcoin technology market is no longer finance-only; operational efficiency in heavily regulated industries drives incremental demand.
Geography Analysis
Asia Pacific held 37.40% of Bitcoin technology market share in 2025, underpinned by Kazakhstan’s mining infrastructure and Hong Kong’s April 2024 ETF greenlight. Japan’s tax exemption spurred retail payment innovation, while South Korea introduced travel-rule compliance that increased exchange overhead. India maintains a punitive 30% capital-gains tax, pushing volumes to peer-to-peer venues. Australia’s Iris Energy expands renewable-powered facilities, aligning with local ESG mandates.
The Middle East is the fastest-growing region at a 12.18% CAGR through 2031. Dubai’s Virtual Assets Regulatory Authority delivers licensing clarity, attracting custody and liquidity desks. UAE’s central bank opened consultation on Bitcoin reserve diversification, and Saudi Arabia’s Public Investment Fund explores renewable-powered mining, meshing with Vision 2030 sustainability goals. Remittance corridors from Gulf states to South Asia accelerate Lightning adoption, lowering fees for migrant workers.
North America hosts roughly 38% of global hashrate after China’s 2021 exit, with cheap Texan wind and deregulated power markets boosting economics. The United States ETF approval catalyzes institutional flows, while Canada’s commodity treatment of Bitcoin attracts exchanges seeking legal certainty. Europe lags in mining due to high energy prices but leads Lightning merchant deployment and tokenization pilots as MiCA provides consistent rules. South American adoption is volatile yet deepens in Argentina and Brazil where inflation incentivizes non-sovereign stores of value.

Competitive Landscape
The Bitcoin technology market shows moderate concentration as the top miners and hardware vendors control outsized hashrate and chip supply; however, service verticals are fragmenting rapidly. Marathon Digital and Riot Platforms executed distressed-asset roll-ups in 2024, scaling economies of renewable power procurement. Bitmain and MicroBT fight margin pressure by pushing energy-efficiency below 20 J/TH. Custody players such as Coinbase and BitGo emphasize insurance coverage and regulatory audits to secure institutional mandates.
Layer 2 infrastructure specialists Lightning Labs and Blockstream capture white-space demand for instant settlement and Taproot-based tokenization. Patent filings for multi-signature orchestration and channel-routing algorithms grew 23% in 2024, signaling that intellectual property moats will shape future advantage. Decentralized mining pools reduce coordinator risk, though hashrate centralization remains a governance concern. Competitive strategy is shifting toward renewable integration and compliance readiness, as miners morph into grid-stabilization partners and service firms become risk-management vendors.
Emerging disruptors include algorithmic liquidity providers that rebalance Lightning channels autonomously, and custody start-ups offering jurisdictional key sharding for geopolitical resilience. As block subsidies decline, transaction fees and ancillary grid-services revenue will dictate profitability, favoring operators with diversified income streams. The Bitcoin technology industry therefore rewards strategic alignment with energy markets and regulatory foresight.
Bitcoin Technology Industry Leaders
Bitmain Technologies Ltd.
Canaan Inc.
Ebang International Holdings Inc.
Blockstream Corporation Inc.
Lightning Labs Inc.
- *Disclaimer: Major Players sorted in no particular order

Recent Industry Developments
- October 2025: Dubai Virtual Assets Regulatory Authority granted Emirates Digital Custody the region’s first full-stack Bitcoin service bank license, broadening institutional onboarding across the Middle East.
- July 2025: Bitmain released its next-generation ASIC miner rated at 14 J/TH, reducing energy consumption by 25% compared with the prior model and intensifying the hardware efficiency race.
- April 2025: Lightning Labs introduced a liquidity-as-a-service marketplace that automates channel funding for merchants, cutting Lightning payment failure rates by 40%.
- January 2025: Fidelity Digital Assets launched an enterprise Bitcoin lending desk, allowing Fortune 100 treasuries to earn yield on idle holdings while maintaining on-chain transparency.


Global Bitcoin Technology Market Report Scope
The Bitcoin Technology Market Report is Segmented by Component (Hardware, Software, Services), Application (Payments, Trading and Exchange, Remittances, Smart Contracts, Other Application), Organization Size (Large Enterprises, and Small and Medium Enterprises), End User Industry (Financial Services, Retail and E-Commerce, Healthcare, Supply Chain and Logistics, Other End User Industry), and Geography (North America, Europe, Asia-Pacific, Middle East and Africa, South America). The Market Forecasts are Provided in Terms of Value (USD).
| Hardware |
| Software |
| Services |
| Payments |
| Trading and Exchange |
| Remittances |
| Smart Contracts |
| Other Application |
| Large Enterprises |
| Small and Medium Enterprises |
| Financial Services |
| Retail and E-Commerce |
| Healthcare |
| Supply Chain and Logistics |
| Other End User Industry |
| North America | United States | |
| Canada | ||
| Mexico | ||
| Europe | Germany | |
| United Kingdom | ||
| France | ||
| Italy | ||
| Rest of Europe | ||
| Asia-Pacific | China | |
| Japan | ||
| India | ||
| South Korea | ||
| Australia | ||
| Rest of Asia-Pacific | ||
| Middle East and Africa | Middle East | Saudi Arabia |
| United Arab Emirates | ||
| Rest of Middle East | ||
| Africa | South Africa | |
| Egypt | ||
| Rest of Africa | ||
| South America | Brazil | |
| Argentina | ||
| Rest of South America | ||
| By Component | Hardware | ||
| Software | |||
| Services | |||
| By Application | Payments | ||
| Trading and Exchange | |||
| Remittances | |||
| Smart Contracts | |||
| Other Application | |||
| By Organization Size | Large Enterprises | ||
| Small and Medium Enterprises | |||
| By End User Industry | Financial Services | ||
| Retail and E-Commerce | |||
| Healthcare | |||
| Supply Chain and Logistics | |||
| Other End User Industry | |||
| By Geography | North America | United States | |
| Canada | |||
| Mexico | |||
| Europe | Germany | ||
| United Kingdom | |||
| France | |||
| Italy | |||
| Rest of Europe | |||
| Asia-Pacific | China | ||
| Japan | |||
| India | |||
| South Korea | |||
| Australia | |||
| Rest of Asia-Pacific | |||
| Middle East and Africa | Middle East | Saudi Arabia | |
| United Arab Emirates | |||
| Rest of Middle East | |||
| Africa | South Africa | ||
| Egypt | |||
| Rest of Africa | |||
| South America | Brazil | ||
| Argentina | |||
| Rest of South America | |||


Key Questions Answered in the Report
How large will the Bitcoin technology market be by 2031?
Forecasts place the Bitcoin technology market size at USD 31.49 billion by 2031, representing an 11.24% CAGR over 2026-2031.
Which segment is growing fastest within Bitcoin technology?
Services, which include custody, compliance, and Lightning processing, are projected to grow at an 11.74% CAGR through 2031.
What region is seeing the quickest adoption of Bitcoin technology?
The Middle East is expanding at a 12.18% CAGR as Dubai grants clear licenses and Gulf sovereign funds explore Bitcoin reserves.
Why are healthcare companies adopting Bitcoin technology?
Healthcare firms deploy Bitcoin-based smart contracts to automate milestone payments and ensure immutable clinical-trial data.
How is renewable energy affecting Bitcoin mining economics?
Co-location with curtailed wind and solar assets lowers power costs and earns grid-stabilization fees, improving post-halving miner margins.
What risks threaten Bitcoin exchange users?
Cybersecurity breaches remain the primary risk, with recent hacks prompting regulators to enforce stricter custody and insurance standards.
Page last updated on:


