Blockchain Supply Chain Market Size and Share
Market Overview
| Study Period | 2020 - 2031 |
|---|---|
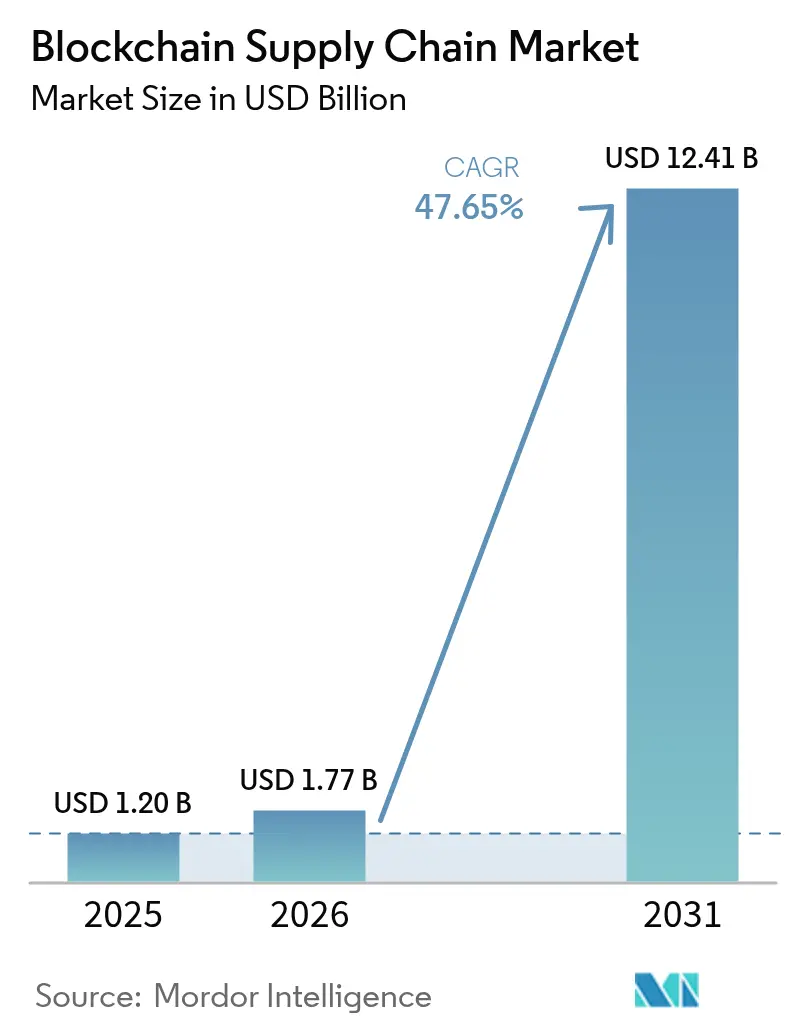
| Market Size (2026) | USD 1.77 Billion |
| Market Size (2031) | USD 12.41 Billion |
| Growth Rate (2026 - 2031) | 47.65% CAGR |
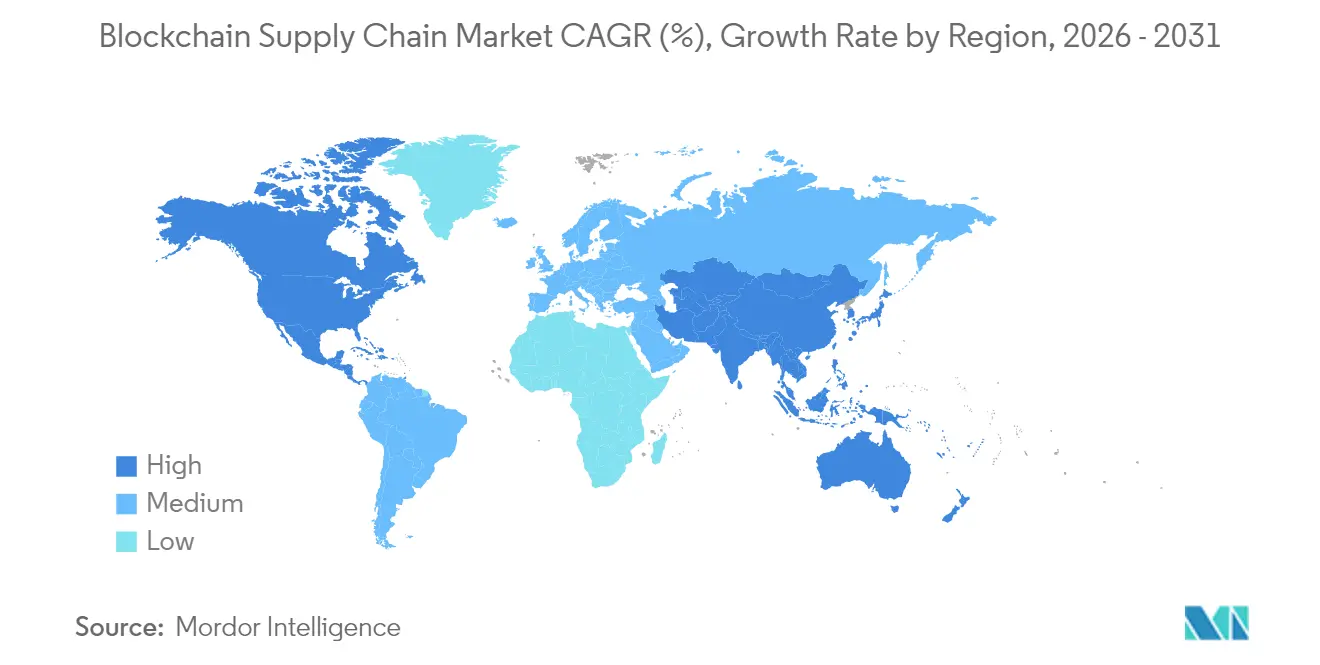
| Fastest Growing Market | Asia Pacific |
| Largest Market | North America |
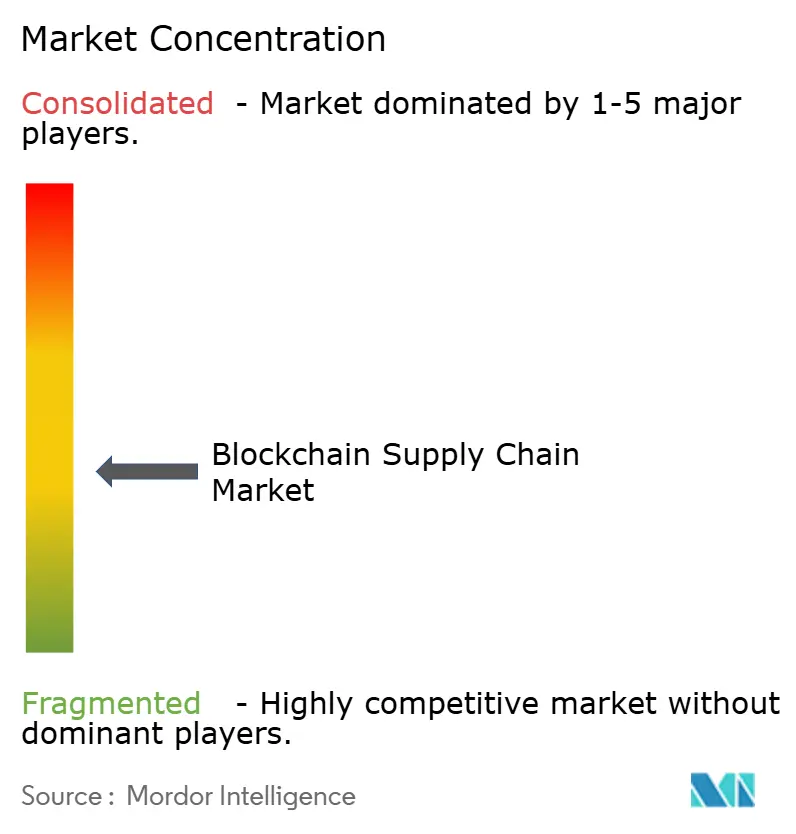
| Market Concentration | Medium |
Major Players *Disclaimer: Major Players sorted in no particular order Image © Mordor Intelligence. Reuse requires attribution under CC BY 4.0. | |
Blockchain Supply Chain Market Analysis by Mordor Intelligence
The Blockchain Supply Chain Market size was valued at USD 1.20 billion in 2025 and estimated to grow from USD 1.77 billion in 2026 to reach USD 12.41 billion by 2031, at a CAGR of 47.65% during the forecast period (2026-2031). Stricter provenance regulations propel the expansion, mounting ESG disclosure pressures, and the inability of legacy systems to provide tamper-proof, end-to-end audit trails. Multi-tier transparency needs, token-driven cost-savings, and cloud deployment models further accelerate adoption. Technology suppliers are prioritizing interoperability and modular architectures, while enterprises increasingly view blockchain as the connective tissue unifying IoT, AI, and existing ERP systems. Demand is strongest in food, automotive, and high-value electronics, where real-time traceability mitigates recalls and counters gray-market diversion.
Key Report Takeaways
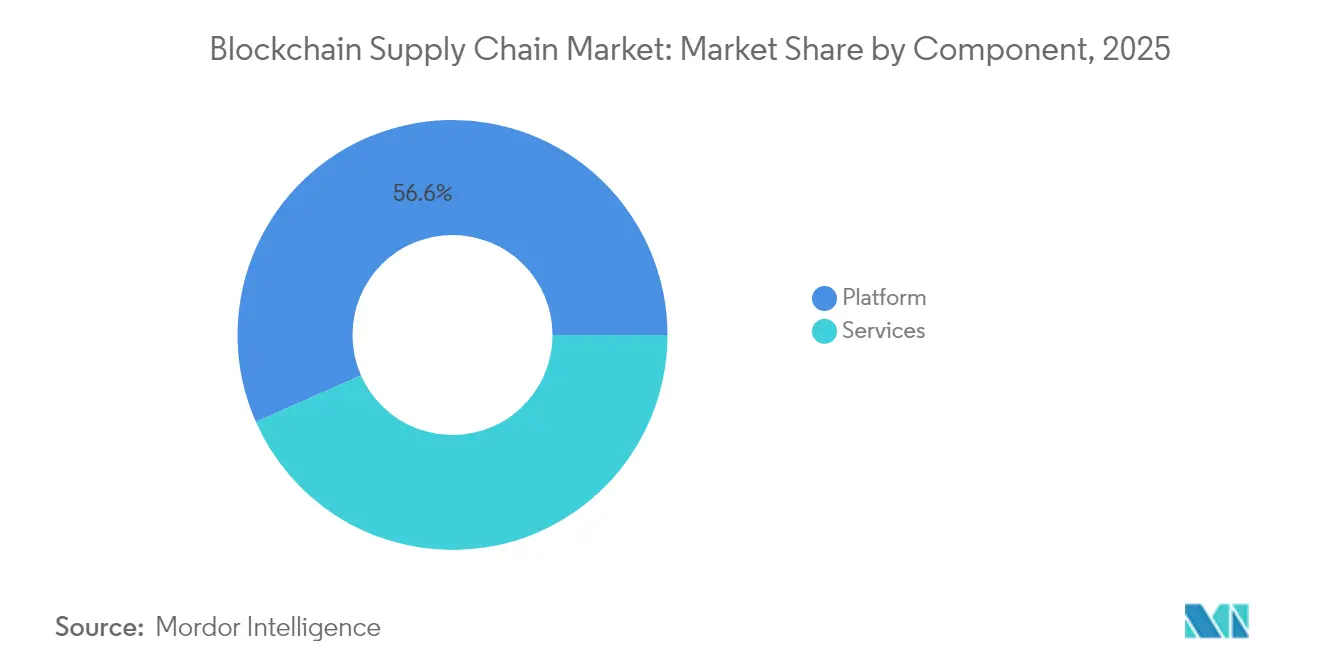
- By component, platform solutions led with 56.62% of the blockchain supply chain market share in 2025; service engagements are projected to rise at a 48.10% CAGR through 2031.
- By blockchain type, public networks held 42.10% revenue share in 2025, while hybrid models recorded the highest 49.20% CAGR to 2031.
- By deployment model, cloud captured 60.72% of the blockchain supply chain market size in 2025 and is advancing at a 49.40% CAGR through 2031.
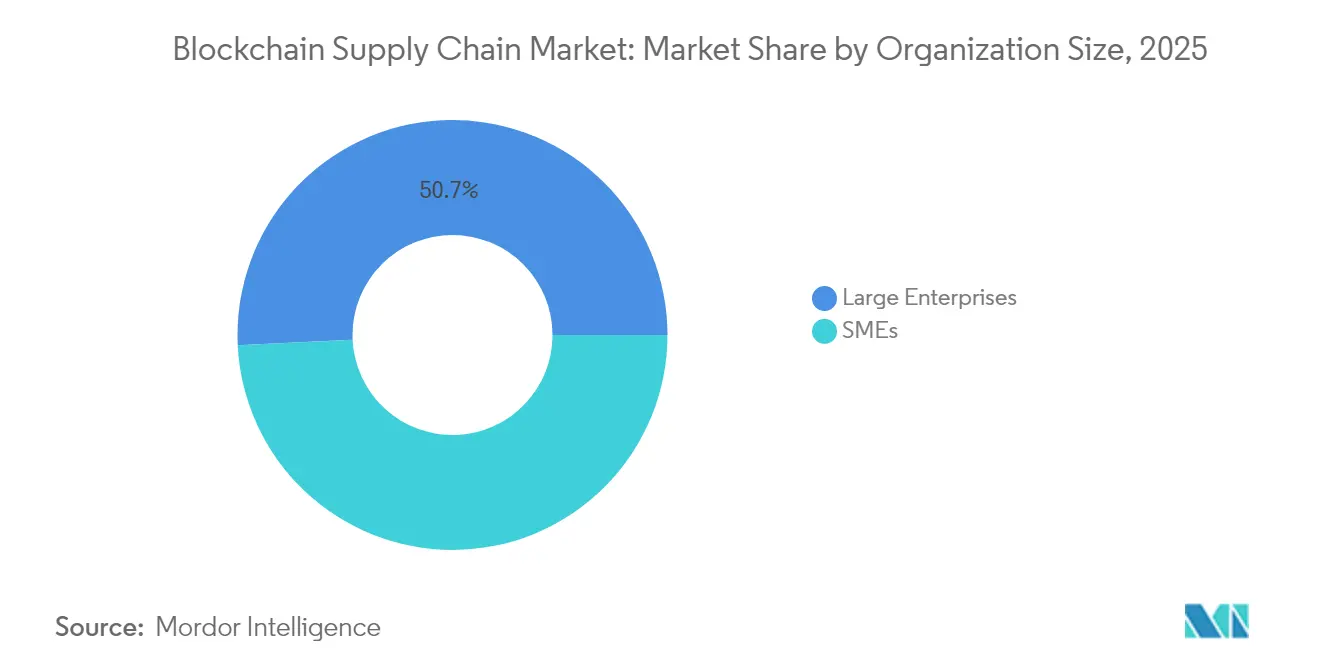
- By organization size, large enterprises controlled a 50.75% share in 2025; SMEs are poised for the quickest 50.10% CAGR through 2031.
- By application, product traceability accounted for 37.55% of 2025 revenue, whereas smart contracts are expanding at a 50.60% CAGR to 2031.
- By geography, North America dominated with a 39.15% share in 2025; Asia-Pacific is expected to surge at a 50.30% CAGR through 2031.
Note: Market size and forecast figures in this report are generated using Mordor Intelligence’s proprietary estimation framework, updated with the latest available data and insights as of 2026.
Global Blockchain Supply Chain Market Trends and Insights
Drivers Impact Analysis*
| Driver | (~) % Impact on CAGR Forecast | Geographic Relevance | Impact Timeline |
|---|---|---|---|
| Augmented demand for secure, tamper-proof supply-chain transactions | +12.5% | North America, Europe, global spillover | Medium term (2-4 years) |
| Need for end-to-end transparency in multi-tier supply chains | +11.2% | APAC manufacturing hubs, global | Long term (≥ 4 years) |
| Cost-saving push from tokenized asset tracking and automated reconciliation | +9.8% | North America, Europe, expanding in APAC | Medium term (2-4 years) |
| Convergence of IoT sensors and blockchain for real-time asset tracking | +8.7% | APAC core, North America | Short term (≤ 2 years) |
| ESG-driven provenance auditing requirements | +7.3% | European Union leadership, global adoption | Long term (≥ 4 years) |
| Smart-insurance and parametric pay-outs for logistics | +6.1% | North America, Europe, APAC pilots | Medium term (2-4 years) |
| Source: Mordor Intelligence | |||
Augmented Demand for Secure, Tamper-Proof Supply-Chain Transactions
Renault’s XCEED initiative processes more than 1 million compliance documents at up to 500 TPS, illustrating how immutable ledgers shift regulatory reporting from static spreadsheets to real-time verification [1]IBM, “Renault digital compliance network drives trusted data sharing,” ibm.com. The network spans multiple tier-one suppliers, cutting audit preparation cycles and strengthening collective risk oversight. Real-time certification reduces disruption response intervals, and embedded smart contracts eliminate roughly 40% of manual reconciliations. Confidential data is safeguarded through granular cryptographic keys, proving that privacy and transparency can co-exist on production-scale blockchains.
Need for End-to-End Transparency in Multi-Tier Supply Chains
Walmart’s food-safety program trimmed contamination source tracing from days to seconds, demonstrating how immutable records enhance recall accuracy and brand trust. DNV’s “My Story” QR codes link verified sustainability and quality data to individual items, giving consumers on-demand provenance proof [2]DNV, “My Story digital assurance,” dnv.com. The approach allows brands to transform transparency into a competitive advantage while regulators gain continuous visibility into high-risk nodes across product life cycles.
Cost-Saving Push from Tokenized Asset Tracking and Automated Reconciliation
Procurement teams report double-digit value leakage from invoice errors and price variances. Tokenizing goods transforms them into programmable assets, enabling self-executing smart contracts that settle once predefined milestones are met. IBM Food Trust users have observed up to 90% cycle-time cuts in invoice processing, with working-capital release accelerating as milestones are verified on-chain [3]IBM, “Food Trust overview,” ibm.com. Enterprise-grade tokenization modules baked into VeChain’s platform reduce technical lift for mid-sized suppliers.
Convergence of IoT Sensors and Blockchain for Real-Time Asset Tracking
AXONS’ FarmPro application, running on Amazon Managed Blockchain, supports 30,000 small farms across Southeast Asia by pairing field sensors with immutable records, boosting yields by up to 60% while trimming operating costs by 20% [4]Amazon Web Services, “FarmPro boosts yields for 30,000 farmers,” press.aboutamazon.com. Huawei Cloud’s Pangu 5.5 stack supplies synthetic lidar and video data that feed directly into blockchain-anchored audit logs, expanding use cases into autonomous logistics.
Restraints Impact Analysis*
| Restraint | (~) % Impact on CAGR Forecast | Geographic Relevance | Impact Timeline |
|---|---|---|---|
| Limited interoperability across blockchain networks | –8.3% | Global, complex enterprise environments | Medium term (2-4 years) |
| Regulatory uncertainty on cross-border data/crypto rules | –6.7% | Global, jurisdiction-specific | Long term (≥ 4 years) |
| Scalability and energy-use concerns in public chains | –4.9% | Global, public-chain adopters | Short term (≤ 2 years) |
| Shortage of Web3 talent for enterprise projects | –3.8% | Emerging markets in particular | Medium term (2-4 years) |
| Source: Mordor Intelligence | |||
Limited Interoperability Across Blockchain Networks
Supply-chain partners often operate disparate ledgers that fail to communicate natively, forcing costly middleware builds. Hyperledger Cacti and other cross-chain frameworks are advancing, yet the absence of universally accepted validation rules and dispute mechanisms prolongs deployment timelines. Enterprises with diverse vendor ecosystems remain wary of vendor lock-in, making interoperability a strategic prerequisite before large-scale rollouts.
Regulatory Uncertainty on Cross-Border Data/Crypto Rules
The European Union’s MiCA regulation offers a compliance foundation, but interpretations differ across member states, complicating projects that span production, logistics, and finance flows within a single blockchain. Data-sovereignty statutes such as GDPR challenge immutable architectures, while the legal enforceability of smart contracts remains unsettled in several jurisdictions. Consequently, multinational corporations pause expansions until clarity emerges, dampening near-term growth potential.
*Our forecasts treat driver/restraint impacts as directional, not additive. The impact forecasts reflect baseline growth, mix effects, and variable interactions.
Segment Analysis
By Component: Platforms Anchor Ecosystem Evolution
Platform offerings accounted for 56.62% of the blockchain supply chain market size in 2025, underscoring enterprise appetite for scalable backbones that serve multiple use cases. Vendor roadmaps emphasize modular APIs, AI-powered analytics, and integration accelerators that embed blockchain into existing MES, WMS, and ERP systems. Services, projected to rise at a 48.10% CAGR, include architecture design, data migration, change management, and managed operations packages. As pilot programs graduate to production, enterprises redirect budgets from experimentation to long-term operational support.
Implementation proof points such as IBM Food Trust highlight how unified platforms condense deployment cycles and foster network effects among suppliers and regulators. The blockchain supply chain market size tied to professional services is further amplified by partner ecosystems that bundle cybersecurity, tokenomics, and continuous-compliance modules, creating recurring revenue streams for system integrators.


By Blockchain Type: Hybrid Configurations Gain Momentum
Public architectures held 42.10% revenue share in 2025, owing to open validation and easy onboarding for diverse partners. Yet sensitivity around pricing models, supplier lists, and contract terms drives many corporates toward hybrid frameworks combining on-chain transparency with permissioned data enclaves. The hybrid sub-segment is projected to register a 49.20% CAGR, reflecting the balance between network reach and data privacy.
VeChain’s weighted delegated proof-of-stake update, rolled out via its StarGate program, epitomizes this shift. The design gives enterprise nodes governance influence while preserving public verification guarantees. As national data-residency laws tighten, hybrid deployments allow regional segmentation without sacrificing global synchronization, promoting adoption in industries with sensitive formulation or defense supply chains.
By Deployment Model: Cloud Delivery Lowers Barriers
Cloud-hosted networks seized 60.72% of the blockchain supply chain market share in 2025, and their 49.40% projected CAGR signals sustained preference for managed infrastructure. AWS, Microsoft, and Google allocate dedicated nodes, compliance blueprints, and pay-as-you-go token management that shorten proof-of-concept stages from months to weeks. This flexibility lets companies pilot regionally and scale globally without capex or specialist DevOps teams.
On-premise setups still resonate with firms bound by strict air-gap mandates or latency-sensitive factory-floor controls. However, cloud-native connector kits now link on-prem ledger slices to public chains, making hybrid cloud the default trajectory for multinational manufacturers looking to harmonize data across continents.
By Organization Size: SMEs Accelerate Network Effects
Large enterprises represented 50.75% of 2025 spend, leveraging mature IT estates to integrate blockchain into workflow orchestration. Yet SMEs are forecast to outpace at 50.10% CAGR as subscription-based platforms eliminate steep entry costs. Low-code dashboards and pre-configured smart-contract libraries empower smaller suppliers to meet master-contractor data mandates without in-house blockchain engineers.
Service providers such as Tata Consultancy Services are building SME-centric accelerators that merge generative AI with blockchain data ingestion, elevating usability while embedding predictive analytics capabilities.
By Application: Smart Contracts Redefine Efficiency
Product traceability delivered 37.55% of 2025 revenue, laying the groundwork for higher-order applications. Smart contracts, set to expand at a 50.60% CAGR, auto-enforce service level agreements, trigger escrow releases, and administer parametric insurance payouts on cargo delays. This reduces counterparty friction and frees finance teams to focus on exception management. Payment and settlement solutions leveraging stablecoins are gaining traction in cross-border B2B trade, while counterfeit-prevention modules help luxury and pharma brands address gray-market leakage.
Geography Analysis
North America secured 39.15% of 2025 revenue, energized by early-mover enterprises, robust venture funding, and comparatively clear legal frameworks. Walmart, Home Depot, and major automotive OEMs anchor multi-tier networks that funnel adoption down their supply chains. US regulators have issued guidance clarifying digital record admissibility, easing auditor concerns. Canada emphasizes natural-resource traceability, whereas Mexico leverages blockchain for near-shoring logistics transparency.
Asia-Pacific is on track for a 50.30% CAGR, driven by China’s state-backed Belt and Road blockchain trade corridors, Japan’s Society 5.0 digitization blueprint, and India’s PLI-backed manufacturing expansion. Government-sponsored sandboxes fast-track pilots in cross-border duties, e-invoice authentication, and carbon-credit clearinghouses. Australia’s mining exporters adopt ledger-anchored emissions reporting to satisfy global buyers’ ESG scrutiny.
Europe’s momentum comes from stringent sustainability legislation. Digital Product Passport mandates require granular lifecycle data, steering manufacturers toward blockchain-enabled traceability. Germany’s Industry 4.0 clusters integrate blockchains with IoT and 5G factory networks, while the United Kingdom focuses on supply-chain finance tokenization aligned to its fintech strengths. Emerging hubs in the Middle East, South America, and Africa adopt ledger solutions to streamline customs processing and boost trade-port competitiveness.

Competitive Landscape
Vendor diversity keeps concentration low as incumbents and niche specialists coexist. IBM, Microsoft, Oracle, and SAP embed blockchain into established ERP suites, capturing clients that value single-vendor accountability. Their offerings emphasize scalability, enterprise-grade security, and integration with analytics and AI modules.
Specialists such as VeChain, OriginTrail, and Ambrosus focus on sector-specific pain points, including sustainability incentives, pharmaceutical serialization, and cold-chain integrity. Hardware and cloud providers like Huawei and AWS extend value by coupling edge-sensor data ingestion with tamper-proof ledger storage.
IBM and SAP pledged deeper integration of generative AI and blockchain workflows, aiming to unify contract analytics with traceability data. Meanwhile, security innovation advances via hardware key-custody modules leveraging TEEs and HSMs. As interoperability frameworks mature, alliances between public-chain foundations and enterprise software leaders are set to reshape the vendor map.
Blockchain Supply Chain Industry Leaders
IBM Corporation
Oracle Corporation
Microsoft Corporation
SAP SE
Amazon Web Services, Inc.
- *Disclaimer: Major Players sorted in no particular order

Recent Industry Developments
- July 2025: VeChain rolled out its USD 15 million StarGate staking program to accelerate enterprise-grade, EVM-equivalent applications on its public chain.
- June 2025: Huawei Cloud launched Pangu 5.5 multimodal AI, integrating synthetic data pipelines with ledger anchoring for autonomous-logistics training.
- March 2025: AWS and global telcos revealed edge-deployed ledgers for tower-equipment provenance at MWC 2025.
- February 2025: The VeChain community authorized expanded VeBetter token access through centralized-exchange listings to enlarge sustainability-incentive reach.
- January 2025: AWS introduced new Outposts rack and server options that support blockchain-enabled 5G supply-chain workloads.


Global Blockchain Supply Chain Market Report Scope
A digital database with official and immutable transaction records is known as a blockchain. Using blockchain technology, which functions as an open ledger, every transaction on the network is documented and made accessible for all entities or participants in the network to examine and verify. Blockchain does away with the need for information to be sent between businesses via mail or other means of communication.
The Blockchain Supply Chain Market is segmented into application (payment & settlement, product traceability, counterfeit detection, smart contracts, risk & compliance management), industry vertical (retail & consumer goods, healthcare & life sciences, manufacturing, logistics, oil & gas), component (platform, services), and geography (North America, Europe, Asia Pacific, and Latin America and Middle East and Africa. The report offers market forecasts and size in value (USD) for all the above segments.
| Platform |
| Services |
| Public |
| Private |
| Consortium |
| Hybrid |
| Cloud |
| On-premise |
| Large Enterprises |
| SMEs |
| Payment and Settlement |
| Product Traceability |
| Counterfeit Detection |
| Smart Contracts |
| Risk and Compliance Management |
| Other Applications |
| North America | United States |
| Canada | |
| Mexico | |
| South America | Brazil |
| Argentina | |
| Rest of South America | |
| Europe | Germany |
| United Kingdom | |
| France | |
| Spain | |
| Russia | |
| Rest of Europe | |
| Asia Pacific | China |
| Japan | |
| India | |
| Australia | |
| South Korea | |
| Rest of Asia Pacific | |
| Middle East | United Arab Emirates |
| Saudi Arabia | |
| Turkey | |
| Rest of the Middle East | |
| Africa | South Africa |
| Nigeria | |
| Rest of Africa |
| By Component | Platform | |
| Services | ||
| By Blockchain Type | Public | |
| Private | ||
| Consortium | ||
| Hybrid | ||
| By Deployment Model | Cloud | |
| On-premise | ||
| By Organization Size | Large Enterprises | |
| SMEs | ||
| By Application | Payment and Settlement | |
| Product Traceability | ||
| Counterfeit Detection | ||
| Smart Contracts | ||
| Risk and Compliance Management | ||
| Other Applications | ||
| By Geography | North America | United States |
| Canada | ||
| Mexico | ||
| South America | Brazil | |
| Argentina | ||
| Rest of South America | ||
| Europe | Germany | |
| United Kingdom | ||
| France | ||
| Spain | ||
| Russia | ||
| Rest of Europe | ||
| Asia Pacific | China | |
| Japan | ||
| India | ||
| Australia | ||
| South Korea | ||
| Rest of Asia Pacific | ||
| Middle East | United Arab Emirates | |
| Saudi Arabia | ||
| Turkey | ||
| Rest of the Middle East | ||
| Africa | South Africa | |
| Nigeria | ||
| Rest of Africa | ||


Key Questions Answered in the Report
How fast is the blockchain supply chain market expected to grow to 2031?
It is forecast to expand from USD 1.2 billion in 2025 to USD 12.41 billion by 2031 at a 47.65% CAGR.
Which region will add the most new revenue through 2031?
Asia-Pacific, projected to advance at a 50.30% CAGR on the back of government-backed digital-trade programs and manufacturing modernization.
What segment leads current spending?
Platform solutions command 56.62% of 2025 revenue as enterprises prefer scalable backbones that support multiple use cases.
Why are smart contracts drawing heightened interest?
They automate SLA enforcement and payment triggers, helping reduce invoice-processing cycle times by up to 90% in production environments.
What is the biggest hurdle to wider enterprise adoption?
Interoperability gaps between disparate blockchains, which add integration cost and prolong deployment timelines.
How are SMEs participating despite limited IT budgets?
Subscription-based cloud platforms offer low-code dashboards and pre-built smart-contract libraries, allowing SMEs to meet upstream data-sharing mandates without hiring blockchain specialists.
Page last updated on:


