Blockchain Technology Market Size and Share
Market Overview
| Study Period | 2020 - 2031 |
|---|---|
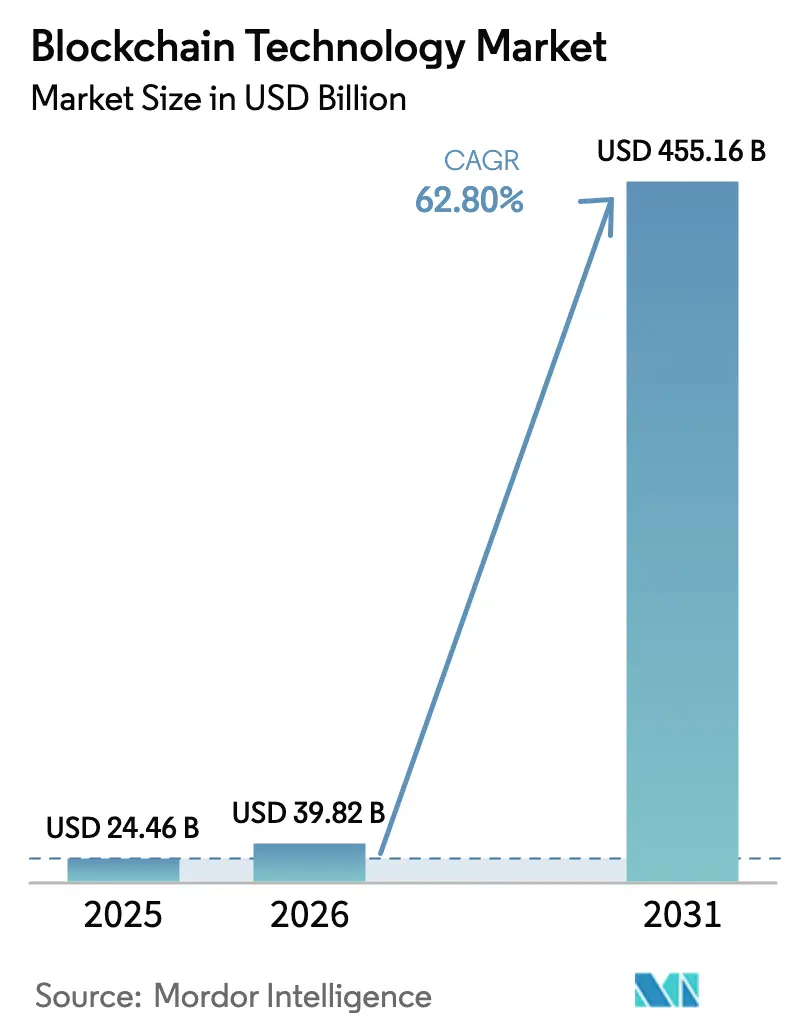
| Market Size (2026) | USD 39.82 Billion |
| Market Size (2031) | USD 455.16 Billion |
| Growth Rate (2026 - 2031) | 62.80% CAGR |
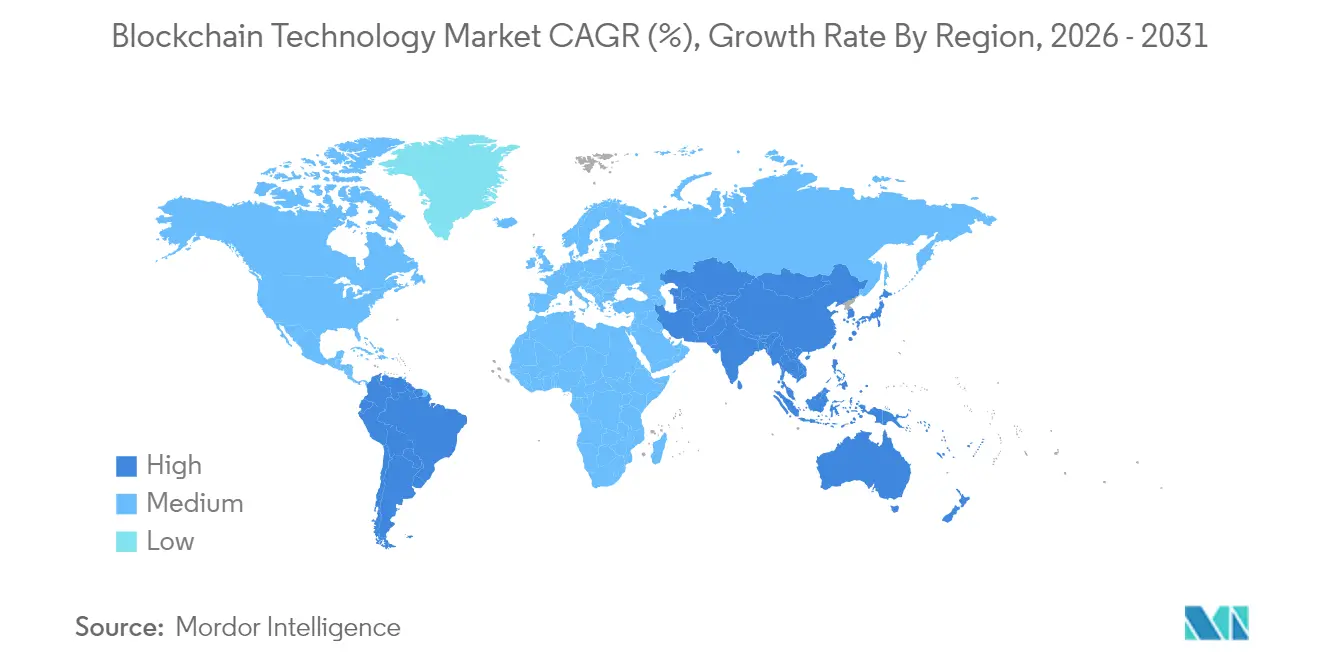
| Fastest Growing Market | Asia Pacific |
| Largest Market | North America |
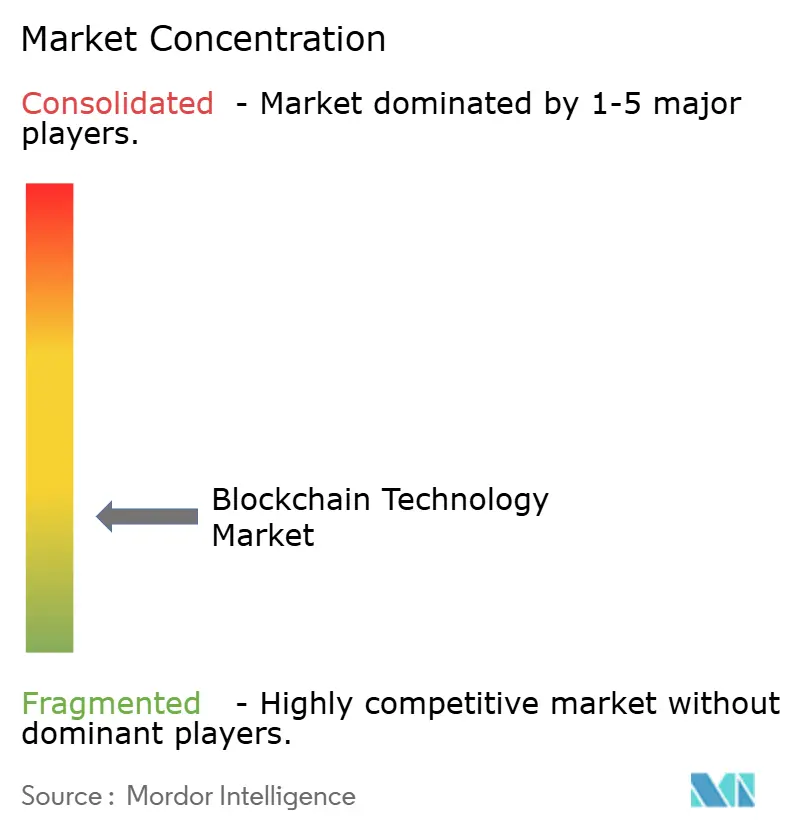
| Market Concentration | Low |
Major Players *Disclaimer: Major Players sorted in no particular order Image © Mordor Intelligence. Reuse requires attribution under CC BY 4.0. | |
Blockchain Technology Market Analysis by Mordor Intelligence
The Blockchain Technology Market size was valued at USD 24.46 billion in 2025 and estimated to grow from USD 39.82 billion in 2026 to reach USD 455.16 billion by 2031, at a CAGR of 62.8% during the forecast period (2026-2031).
Surging demand for tokenized assets, rapid enterprise migration toward Blockchain-as-a-Service (BaaS), and expanding use cases in supply-chain transparency and digital identity keep the growth curve steep. Public networks remain dominant for cross-industry traceability, whereas private and consortium chains draw corporations that must meet data sovereignty and regulatory mandates. Payment and remittance platforms maintain the broadest installed base, yet tokenization is now the fastest-scaling application as asset managers digitize traditional securities. Competition is intense but still fragmented, allowing partnerships between software giants and specialist vendors to set technical standards while enabling small providers to address niche vertical problems.
Key Report Takeaways
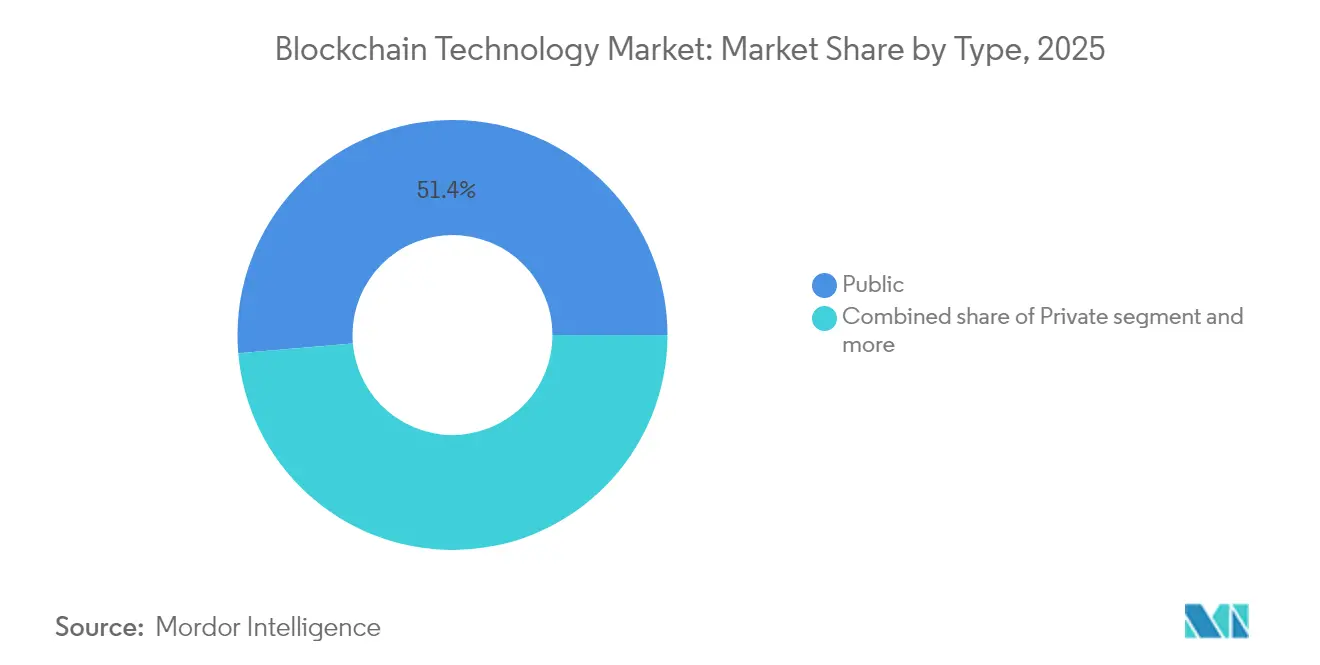
- By network type, public chains held 51.35% of the blockchain technology market share in 2025, while private networks are projected to expand at a 64.9% CAGR through 2031.
- By component, platforms and integrated solutions captured 67.45% of revenue in 2025; BaaS delivery is expected to accelerate at a 64.7% CAGR to 2031.
- By application, payments and remittances accounted for 30.85% of the blockchain technology market size in 2025, whereas tokenization and asset management are poised for a 63.8% CAGR run through 2031.
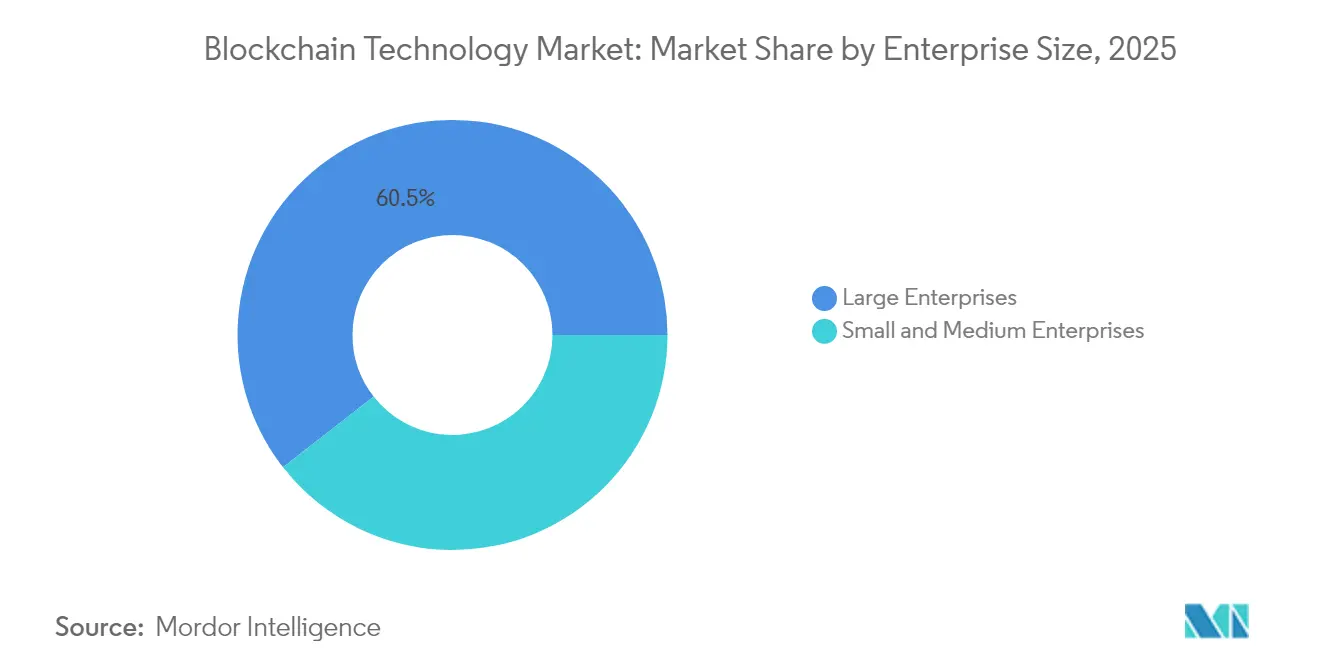
- By enterprise size, large organizations controlled 60.55% of 2025 revenue; small and medium enterprises are forecast to grow at 64.5% CAGR as turnkey cloud services reduce entry barriers.
- By end user, the Banking, Financial Services, and Insurance sector generated 38.10% of 2025 demand, while Energy and Utilities is the fastest climber at 63.2% CAGR.
- By geography, North America led with a 34.05% share in 2025; Asia-Pacific is set to outpace all other regions at a 63.4% CAGR through 2031.
Note: Market size and forecast figures in this report are generated using Mordor Intelligence’s proprietary estimation framework, updated with the latest available data and insights as of 2026.
Global Blockchain Technology Market Trends and Insights
Drivers Impact Analysis*
| Driver | (~) % Impact on CAGR Forecast | Geographic Relevance | Impact Timeline |
|---|---|---|---|
| Rising demand for end-to-end supply-chain transparency | +12.5% | Global (early adoption in North America and Europe) | Medium term (2-4 years) |
| Rapid adoption across financial services (tokenized deposits, CBDCs) | +18.2% | Global (developed markets and CBDC pilots) | Short term (≤ 2 years) |
| Enterprise shift to BaaS to cut cap-ex and time-to-market | +14.8% | North America and Europe, expanding in Asia-Pacific | Medium term (2-4 years) |
| Tokenization of U.S. Treasuries creating structural demand pools | +8.7% | North America and Europe | Long term (≥ 4 years) |
| Zero-knowledge proofs enabling privacy-compliant data sharing | +6.3% | Europe and Asia | Long term (≥ 4 years) |
| Source: Mordor Intelligence | |||
Rising Demand for End-to-End Supply-Chain Transparency
Global brands now view immutable traceability as mandatory for food safety, ESG reporting, and counterfeit mitigation. Walmart’s food-safety pilot with IBM cut produce trace analysis from 7 days to 2.2 seconds, proving that blockchain can collapse compliance latency and operating risk[1]IBM Corporation, “Food Trust Traceability Results,” ibm.com. Manufacturers are integrating IoT sensors with distributed ledgers to build digital twins, triggering smart-contract rules that automate quality checkpoints and recall alerts. Regulatory pressure on Scope 3 emissions pushes procurement teams to demand real-time supplier disclosures, driving platform vendors to embed carbon-tracking modules. As transparency shifts from brand differentiator to legal requirement, on-chain product passports become the default audit mechanism across North America and Europe before cascading to Asia-Pacific exporters.
Rapid Adoption Across Financial Services
Tokenized deposits, wholesale CBDCs, and instant-settlement stablecoins redefine core banking workflows. BNY Mellon’s Digital Asset Data Insights service processes on- and off-chain data for BlackRock’s tokenized U.S. Treasury fund, demonstrating that frontline asset managers now treat blockchain as critical market infrastructure. By 2026, pilots in 20 economies will test CBDCs, reshaping monetary-policy plumbing and cross-border liquidity. Visa’s e-HKD sandbox shows near-real-time settlement for retail payments, reducing interbank float costs. Remittance corridors stand to save USD 10 per transaction once smart-contract-based FX nets replace legacy correspondent banking. As regulatory frameworks such as the EU’s MiCA mature, institutional treasurers gain the clarity necessary to hold on-chain cash equivalents, fueling demand spikes in permissioned payment rails.
Enterprise Shift to BaaS Models
Most corporations lack consensus-mechanism expertise and node-management staff, so they rent managed stacks from cloud hyperscalers. Oracle’s Hyperledger Fabric-based BaaS lets firms deploy production networks in weeks instead of years while embedding identity management and hardware-backed encryption. Financial institutions view BaaS as the fastest path to compliance audits because providers bundle chain analytics, key-management services, and SOC2 attestations. The pay-as-you-go model also democratizes the blockchain technology market by lowering capital thresholds for small manufacturers and logistics firms. As competitive parity levels, feature differentiation shifts toward API breadth and integration with ERP, CRM, and tax platforms.
Tokenization of U.S. Treasuries Creating Structural Demand
BlackRock’s move into tokenized treasuries signals that the largest asset pools are migrating on-chain for real-time pricing, faster collateral mobility, and automated compliance. The tokenized asset base climbed to USD 19.5 billion in 2025, with daily liquidity windows that beat traditional fund settlement cutoffs. Automated coupon distribution and programmable restrictions encoded within smart contracts slash administrative overhead for transfer agents. Secondary-market makers gain 24/7 trading windows, increasing velocity and depth in once-illiquid segments. Central bank working groups study wholesale CBDCs as settlement assets for tokenized bonds, raising the probability that post-trade infrastructure will default to distributed ledgers in the next decade.
Zero-Knowledge Proofs Enabling Privacy-Compliant Data Sharing
Enterprises experimenting with GDPR-constrained data exchange need privacy tools that still allow verification. Zero-knowledge proof (ZKP) circuits let counterparties confirm attributes without revealing raw datasets, unlocking use cases in healthcare claims, payroll, and supplier compliance audits. European regulators encourage ZKP pilots as a path to reconcile decentralization with sovereignty mandates. Banks trial selective-disclosure credentials to satisfy anti-money-laundering checks while preserving client confidentiality. When ZKP tooling converges into cloud SDKs, developers will embed privacy safeguards at the protocol layer, broadening blockchain adoption among risk-averse corporates.
Restraints Impact Analysis*
| Restraint | (~) % Impact on CAGR Forecast | Geographic Relevance | Impact Timeline |
|---|---|---|---|
| Shortage of skilled blockchain architects and auditors | -8.4% | Global (acute in emerging markets) | Short term (≤ 2 years) |
| Evolving and fragmented global regulations | -6.7% | Global (varies by jurisdiction) | Medium term (2-4 years) |
| Source: Mordor Intelligence | |||
Shortage of Skilled Blockchain Architects and Auditors
Rapid deployment outpaces workforce supply. Cryptography specialists, smart-contract auditors, and protocol designers remain scarce, particularly in Latin America, Southeast Asia, and Africa, where universities have yet to embed distributed-ledger modules. Global surveys show medium-sized banks delaying projects by up to 12 months while searching for certified talent. Cyber-security risk rises when inexperienced teams deploy production code, raising the value of external audit firms that can validate ZKP libraries and cross-chain bridges. Government-backed scholarship programs and vendor-hosted training aim to close gaps, but near-term bottlenecks could temper the blockchain technology market expansion.
Evolving and Fragmented Global Regulations
Jurisdictional patchwork generates compliance headaches for multinationals that move value across borders. The FDIC now lets U.S. banks run crypto activities without case-by-case approvals, but Asia-Pacific regulators impose distinct reserve rules for stablecoins, while some emerging markets cap token holdings outright[2]Federal Deposit Insurance Corporation, “Supervisory Letter on Crypto-Related Activities,” fdic.gov. Firms must build region-specific custody, reporting, and consumer-protection layers, adding cost and complexity. Although the Financial Stability Board is coordinating standards across G20 nations, harmonization lags product innovation, prolonging uncertainty for issuers underwriting cross-border payment rails.
*Our forecasts treat driver/restraint impacts as directional, not additive. The impact forecasts reflect baseline growth, mix effects, and variable interactions.
Segment Analysis
By Type: Private Networks Drive Enterprise Adoption
Private chains are recording a 64.9% CAGR through 2031 as enterprises pursue controlled-access ledgers that dovetail with data-protection statutes and internal governance. Financial institutions use permissioned R3 Corda deployments for bilateral trade-finance and real-time gross settlement, restricting node participation to KYC-verified entities. Manufacturers form consortium blockchains so tier-two suppliers can append compliance certificates without broadcasting proprietary data to the open internet. Hybrid architectures bridge public transparency and private confidentiality; for example, shipment milestones post to Ethereum while sensitive bills of lading reside on a private side chain. Public networks still captured 51.35% share in 2025 because cryptocurrency activity and decentralized finance rely on global accessibility, yet the swing toward private deployments underscores enterprise comfort with walled-garden models for mission-critical operations.
Blockchain-native middleware now mediates interoperability between public proof-of-stake chains and private Byzantine Fault Tolerant networks, letting corporates settle tokens on open rails while anchoring confidential documents in permissioned stores. Regulatory sandboxes in Singapore and Abu Dhabi test cross-border data flows that vault hashes of trade certificates onto a public ledger, achieving auditability without disclosing commercial terms. As cross-chain bridges harden, chief information officers expect to toggle workloads between both environments, reinforcing the dual-track trajectory inside the broader blockchain technology market.


By Component: BaaS Models Accelerate Market Access
Cloud vendors that package consensus engines, validator orchestration, and key management into subscription bundles are swelling at a 64.7% CAGR. Oracle, IBM, Microsoft Azure, and Amazon Web Services pitch multi-tenant BaaS clusters where enterprises spin up nodes in minutes, sidestepping hardware procurement and talent shortages. Pay-per-use pricing reduces up-front costs, allowing start-ups to field proofs-of-concept with minimal risk. At the same time, traditional on-premises platforms and fully custom solutions still generated 67.45% of 2025 revenue because heavily regulated industries require bespoke integrations into mainframe, SAP, and high-availability environments.
Vendor convergence is evident as BaaS providers embed low-code workflow builders while established platform vendors expose managed hosting tiers. Enterprises evaluate offerings on audit readiness, throughput, and SLA terms rather than raw cryptographic horsepower. As security modules integrate hardware security modules and confidential-compute enclaves, BaaS could become the enterprise default, leveling the field for SMEs and pushing the blockchain technology market toward consumption-based economics.
By Application: Tokenization Reshapes Asset Management
The tokenization and asset-management segment is exploding at 63.8% CAGR because fund managers can fractionalize treasuries, real estate, and private-equity stakes. BlackRock’s on-chain treasury fund illustrated how programmable governance, instant settlement, and transparent audit trails supercharge back-office efficiency. Stable secondary trading turns once-illiquid assets into instruments suitable for retail portfolios, widening the investor base. Payments and remittances still held 30.85% of the blockchain technology market size in 2025 because incumbents adopted permissioned ledgers to cut correspondent fees and reduce error rates in migrant transfers.
Supply-chain traceability, digital identity, and IoT-linked smart-contract automation form the next wave of diversified deployments. Food producers anchor batch certificates on chain, pharmaceutical firms log cold-chain temperatures, and universities issue tamper-proof diplomas. Every additive application broadens enterprise familiarity, creating network effects that reinforce the overall blockchain technology market trajectory.
By Enterprise Size: SMEs Embrace Democratized Access
Small and medium enterprises (SMEs) are set to log a 64.5% CAGR as turnkey cloud stacks erase technical barriers. Vendor marketplaces offer sector-specific templates—organic-produce provenance, cross-border invoice finance, or carbon credit trading—that SMEs can configure via graphical dashboards. The result is a dramatic cut in deployment cycles from 18-24 months to 3–6 months. Still, large enterprises captured 60.55% of 2025 spending because they operate complex multi-jurisdictional supply networks that need custom governance layers, multi-factor key custody, and high-throughput consensus.
Skills shortages and audit complexity weigh more heavily on SMEs, so managed-service providers bundle compliance monitoring, chain analytics, and cyber-insurance to de-risk adoption. As free-tier trials seed familiarity, many SMEs convert to paid plans, broadening the purchaser base and diversifying the blockchain technology market beyond Fortune 500 companies.
By End User: Energy Sector Leads Digital Transformation
Energy and Utilities is the fastest-rising adopter with a 63.2% CAGR, propelled by peer-to-peer energy trading, grid balancing, and renewable-certificate clearinghouses. National regulators now require granular proof of origin for green kilowatt hours, so solar producers tokenize output and route excess capacity to neighbors via smart contracts. The sector also pilots predictive maintenance where turbine sensor data triggers self-executing service invoices on a private chain. Banking, Financial Services, and Insurance retained 38.10% market share in 2025 because custody, trade settlement, and syndicated lending already run on permissioned ledgers.
Transport and logistics firms integrate electronic bills of lading with customs nodes, shortening port dwell times. Healthcare consortia hash clinical-trial records for immutable integrity, while public agencies explore blockchain-based ID wallets for social-benefit disbursement. As pilots scale to production, the end-user mosaic grows increasingly multifaceted, underpinning sustained demand across the blockchain technology market.
Geography Analysis
North America owns 34.05% of global revenue in 2025 thanks to early enterprise pilots, venture funding density, and a maturing policy environment. The FDIC’s 2025 directive permits banks to undertake crypto-related activities without individualized approvals, accelerating blockchain deployments in custodial services, trade finance, and wealth management. Canada complements U.S. growth through supply-chain transparency projects in agriculture and mining, whereas Mexico trials cross-border payroll platforms to lower remittance costs for expatriate workers.
Asia-Pacific is the fast-track region, expanding at a 63.4% CAGR as governments embed blockchain into national digital-economy blueprints. China pledged USD 54.5 billion for multi-industry blockchain rollouts, including tax rebates, smart-city logistics, and intellectual-property registries. Japan and South Korea run stablecoin sandboxes tied to real-time gross settlement, while India’s Unified Payments Interface layers pilot decentralized identity to increase financial inclusion. Australia’s commodity exporters bolt traceability tokens to iron-ore shipments, and Singapore’s Project Orchid experiments with programmable money for tourism vouchers.
Europe advances on the back of the fully operational MiCA framework, providing harmonized crypto-asset rules across member states. Germany’s automotive supply base logs parts provenance, the Netherlands tests blockchain for harbor customs clearance, and Nordic utilities tokenize renewable energy certificates to satisfy Green Deal reporting. Still, rigorous disclosure requirements raise compliance costs for start-ups, nudging them toward BaaS providers that bake in regulatory tooling. The region’s emphasis on privacy turbocharges adoption of zero-knowledge proof extensions, giving EU enterprises a head start in data-sovereignty-sensitive deployments within the blockchain technology market.

Competitive Landscape
Competition remains moderate with overlapping coalitions rather than winner-take-all dominance. IBM, Microsoft, Oracle, and SAP wield existing ERP footholds to upsell blockchain modules that plug into supply-chain, HR, and finance workflows. Pure-play vendors like ConsenSys, R3, and Ripple Labs differentiate through domain specialization, such as enterprise Ethereum tooling, fixed-income settlement rails, or cross-border payments. Partnerships bridge gaps: the Enterprise Ethereum Alliance includes both software incumbents and protocol innovators to craft interoperability taxonomies[4]IBM Corporation, “Food Trust Traceability Results,” ibm.com.
Interoperability tool sets and regulatory-compliance layers are the new battlegrounds. Firms race to secure certifications for ISO 20022 messaging, SOC2 Type 2 audits, and GDPR alignment. Cross-chain bridges, zero-knowledge rollups, and data-availability layers emerge as value-added features that let enterprises shift tokens across networks without sacrificing security. MandA momentum climbed 29% in 2024 as firms with strong protocol teams and live client references became targets for cloud providers seeking to round out their BaaS stacks.
While no single player commands runaway dominance, first-mover references in tokenization and supply-chain rollouts shape vendor shortlists. Start-ups that focus on sector-specific pain points—pharma anti-counterfeit, construction lien management, or voluntary-carbon market clearing—can capture profitable niches before standards homogenize. As enterprise buyers prioritize resilience and interoperability, vendors must balance specialization with open-stack compatibility to stay relevant inside the expanding blockchain technology market.
Blockchain Technology Industry Leaders
Amazon Web Services, Inc.
Microsoft Corporation
IBM
Oracle Corporation
SAP SE
- *Disclaimer: Major Players sorted in no particular order

Recent Industry Developments
- April 2025: BNY Mellon launched Digital Asset Data Insights to serve BlackRock’s tokenized U.S. Treasury fund, delivering integrated on- and off-chain analytics.
- March 2025: The FDIC issued guidance letting supervised banks engage in crypto activities without case-by-case approvals, provided risk controls are in place.
- March 2025: Kraken agreed to acquire NinjaTrader for USD 1.5 billion, while Coinbase explored a bid for Deribit, signaling brisk consolidation in digital-asset infrastructure.
- February 2025: The Financial Stability Board began a peer review of global crypto-asset regulatory frameworks to assess G20 implementation progress.
- January 2025: China unveiled a USD 54.5 billion national blockchain roadmap aimed at scaling distributed-ledger infrastructure across sectors.


Research Methodology Framework and Report Scope
Market Definitions and Key Coverage
Our study defines the blockchain technology market as the total annual revenue generated worldwide from platforms, software, and blockchain-as-a-service offerings that use distributed ledgers to store and validate transaction data across public, private, consortium, and hybrid networks. These revenues stem from license fees, subscription models, and managed services purchased by enterprises of every size across finance, supply chain, government, healthcare, retail, energy, telecom, and other end-user verticals.
Scope Exclusions: Consumer crypto trading volumes, one-time token sales, and pure cryptocurrency price movements sit outside this definition.
Segmentation Overview
- By Type
- Public
- Private
- Consortium
- Hybrid
- By Component
- Platform / Solution
- Blockchain-as-a-Service (BaaS)
- By Application
- Payments and Remittances
- Smart Contracts
- Supply-Chain and Traceability
- Digital Identity and Credentialing
- Internet-of-Things Integration
- Tokenization / Asset Management
- Others
- By Enterprise Size
- Large Enterprises
- Small and Medium Enterprises
- By End User
- BFSI
- Transport and Logistics
- Energy and Utilities
- Retail and E-commerce
- Healthcare and Life Sciences
- Government and Public Sector
- IT and Telecommunications
- Real Estate and Construction
- By Geography
- North America
- United States
- Canada
- Mexico
- Europe
- Germany
- United Kingdom
- France
- Spain
- Italy
- Russia
- Rest of Europe
- Asia-Pacific
- China
- Japan
- India
- South Korea
- Australia and New Zealand
- Rest of Asia-Pacific
- South America
- Brazil
- Argentina
- Rest of South America
- Middle East and Africa
- Middle East
- United Arab Emirates
- Saudi Arabia
- Turkey
- Rest of Middle East
- Africa
- South Africa
- Nigeria
- Rest of Africa
- Middle East
- North America
Detailed Research Methodology and Data Validation
Primary Research
Mordor analysts interviewed platform vendors, systems integrators, CIOs in BFSI and logistics, as well as policymakers overseeing digital-asset frameworks across North America, Europe, and Asia-Pacific. These conversations validated spending triggers, average contract sizes, and timeline assumptions, and they filled data gaps in regions where public statistics lag.
Desk Research
We began with open datasets from bodies such as the Bank for International Settlements, the OECD Blockchain Policy Centre, the European Commission Blockchain Observatory, and the U.S. Federal Reserve, which give macro signals on transaction volumes, enterprise IT budgets, and regulatory rollouts. Industry associations, such as the Hyperledger Foundation, Enterprise Ethereum Alliance, and the Global Blockchain Business Council, provide implementation case counts and standard-setting updates that refine adoption curves. Company 10-K filings and investor decks add granular revenue splits, while headline news gathered through Dow Jones Factiva and firm financials from D&B Hoovers highlight competitive positioning. The sources listed illustrate our desk work and are not exhaustive; many additional publications were consulted for cross-checks and clarifications.
Market-Sizing & Forecasting
A top-down model converts enterprise IT spending pools into a blockchain addressable share using observed penetration rates by industry, which are then benchmarked against import/export shipment data for hardware nodes and cloud service disclosures. Supplier revenue roll-ups and channel checks act as a selective bottom-up sense test. Key variables include venture-capital funding flows, the number of pilot-to-production migrations, average validator node pricing, corporate compliance deadlines, and central-bank digital-currency pilots. Five-year projections rely on a multivariate regression with ARIMA overlays, capturing the interaction between regulatory readiness scores and per-industry adoption velocity. Gaps in bottom-up estimates are bridged through expert-agreed scenario bands before final calibration.
Data Validation & Update Cycle
Outputs pass anomaly filters, variance checks against adjacent markets, and a two-step peer review inside Mordor. We refresh every twelve months, with interim revisions triggered by large funding spikes, landmark regulations, or major vendor revenue disclosures.
Why Mordor's Blockchain Technology Baseline Commands Reliability
Published estimates often vary because firms diverge on what revenues count, how aggressively adoption ramps, and how frequently models refresh.
Key gap drivers include (i) inclusion of speculative crypto trading by some providers, (ii) differing treatment of blockchain-enabled cloud services, and (iii) longer refresh cadences that miss sudden regulatory shifts. Mordor's scope focuses on enterprise-grade solutions, applies transparent penetration logic, and is re-benchmarked each year, giving decision-makers a stable yet current view.
Benchmark comparison
| Market Size | Anonymized source | Primary gap driver |
|---|---|---|
| USD 24.46 B (2025) | Mordor Intelligence | - |
| USD 32.99 B (2025) | Global Consultancy A | Counts consumer crypto exchange fees and applies uniform CAGR without industry splits |
| USD 57.72 B (2025) | Technology Publisher B | Uses vendor press releases without filtering double-counted platform and service revenues |
In summary, our disciplined scope selection, mixed-method modeling, and yearly refresh cadence combine to deliver a balanced baseline that clients can trace back to clear variables and reproducible steps.


Key Questions Answered in the Report
What is the current size of the blockchain technology market?
The market generated USD 39.82 billion in 2026 and is projected to reach USD 455.16 billion by 2031 at a 62.8% CAGR.
Which region is growing fastest in blockchain adoption?
Asia-Pacific leads growth with a 63.4% projected CAGR to 2031, supported by large-scale government digitalization programs.
Why are private blockchains gaining traction?
Enterprises favor permissioned networks to comply with data-sovereignty laws and to limit transaction visibility to verified participants.
How does Blockchain-as-a-Service benefit small firms?
BaaS reduces upfront hardware costs and shortens deployment timelines to a few weeks, letting SMEs access enterprise-grade ledger capabilities.
What sectors beyond finance are adopting blockchain fastest?
Energy and Utilities top non-financial adoption with use cases in peer-to-peer energy trading and renewable certificate management.
What is inhibiting faster blockchain rollout?
The primary obstacles are a shortage of skilled architects and auditors and the fragmented regulatory landscape across jurisdictions.
Page last updated on:


