Smart Cities Infrastructure NDT Market Size and Share
Market Overview
| Study Period | 2019 - 2030 |
|---|---|
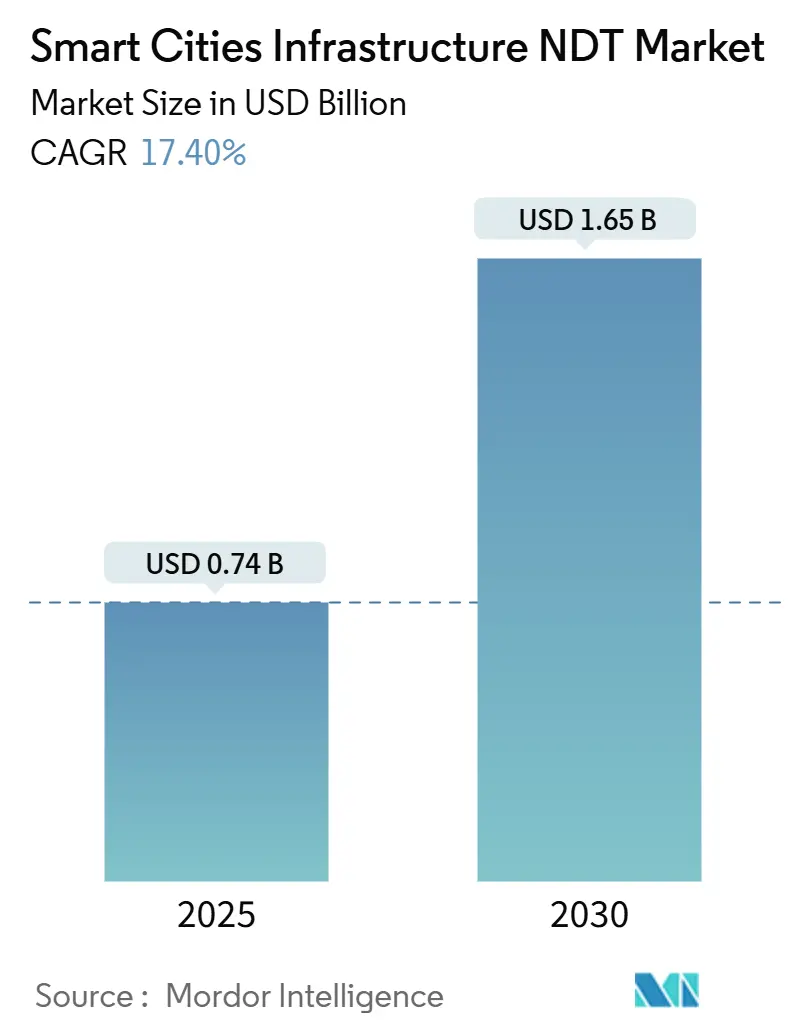
| Market Size (2025) | USD 0.74 Billion |
| Market Size (2030) | USD 1.65 Billion |
| Growth Rate (2025 - 2030) | 17.40% CAGR |
| Fastest Growing Market | Asia Pacific |
| Largest Market | North America |
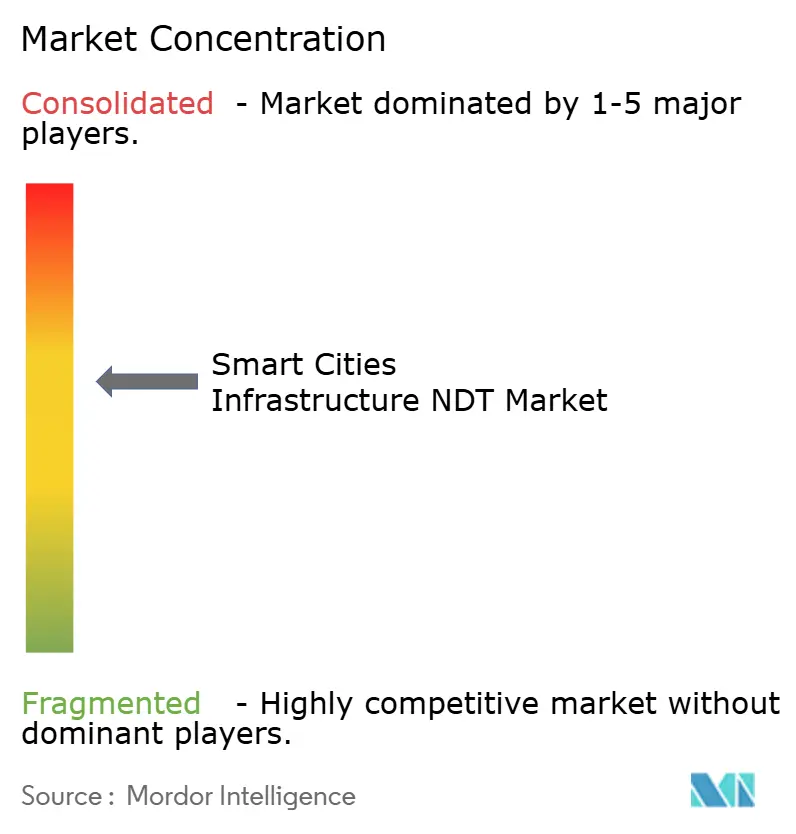
| Market Concentration | Medium |
Major Players *Disclaimer: Major Players sorted in no particular order Image © Mordor Intelligence. Reuse requires attribution under CC BY 4.0. | |
Smart Cities Infrastructure NDT Market Analysis by Mordor Intelligence
The Smart Cities Infrastructure NDT market size is estimated at USD 0.74 billion in 2025 and is projected to reach USD 1.65 billion by 2030, growing at a 17.4% CAGR. The surge reflects municipal urgency to secure aging assets, capitalize on post-pandemic stimulus, and embed digital monitoring across 5G-enabled urban networks. Rapid sensor grid roll-outs, stricter safety mandates, and AI-driven analytics together intensify demand for continuous structural health verification. At the same time, the shift from periodic inspections to predictive, always-on monitoring propels long-term service contracts, giving the Smart Cities Infrastructure NDT market sustained growth momentum. Competitive advantages now hinge on integrating real-time data streams with cloud analytics, easing procurement through public-private partnership models, and addressing workforce shortages with automation.
Key Report Takeaways
- By end user, municipal governments led with 40.4% revenue share in 2024, while facility management firms posted the fastest 18.9% CAGR through 2030.
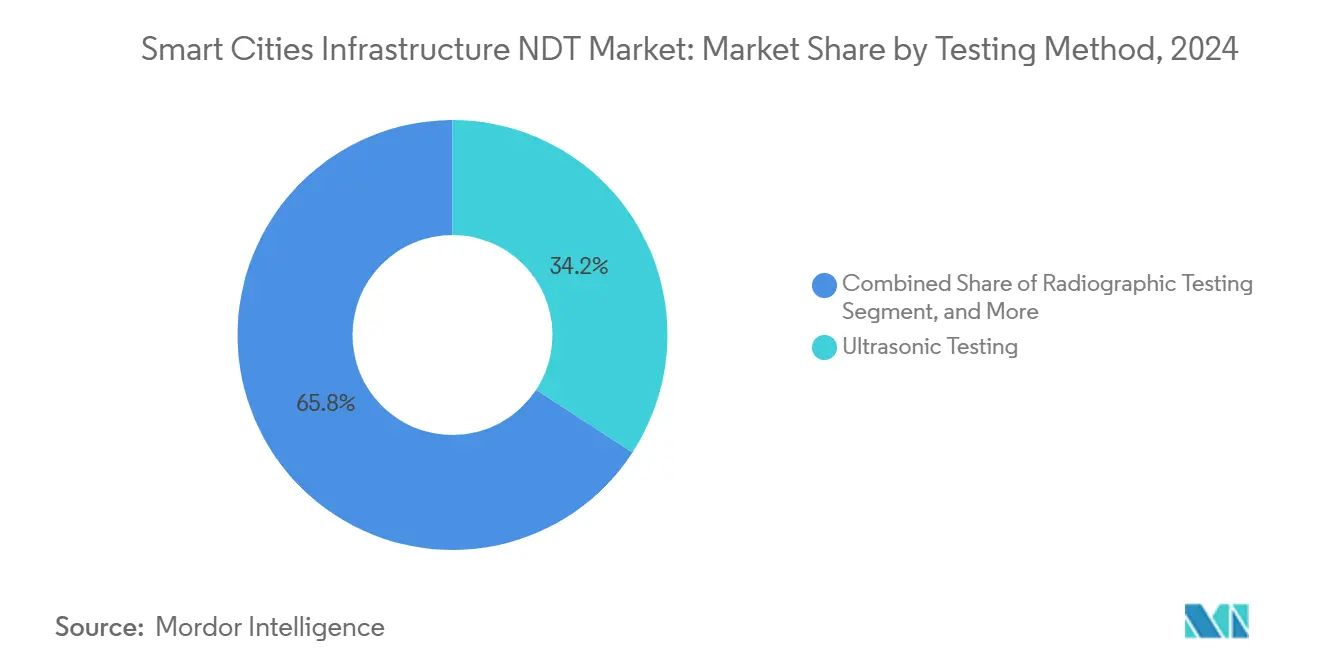
- By testing method, ultrasonic testing accounted for 34.2% of the Smart Cities Infrastructure NDT market share in 2024; drone-based visual inspection is projected to expand at a 19.2% CAGR through 2030.
- By infrastructure asset type, roads and bridges accounted for a 28.5% share of the Smart Cities Infrastructure NDT market size in 2024, while telecom and data centers are projected to advance at a 19.4% CAGR through 2030.
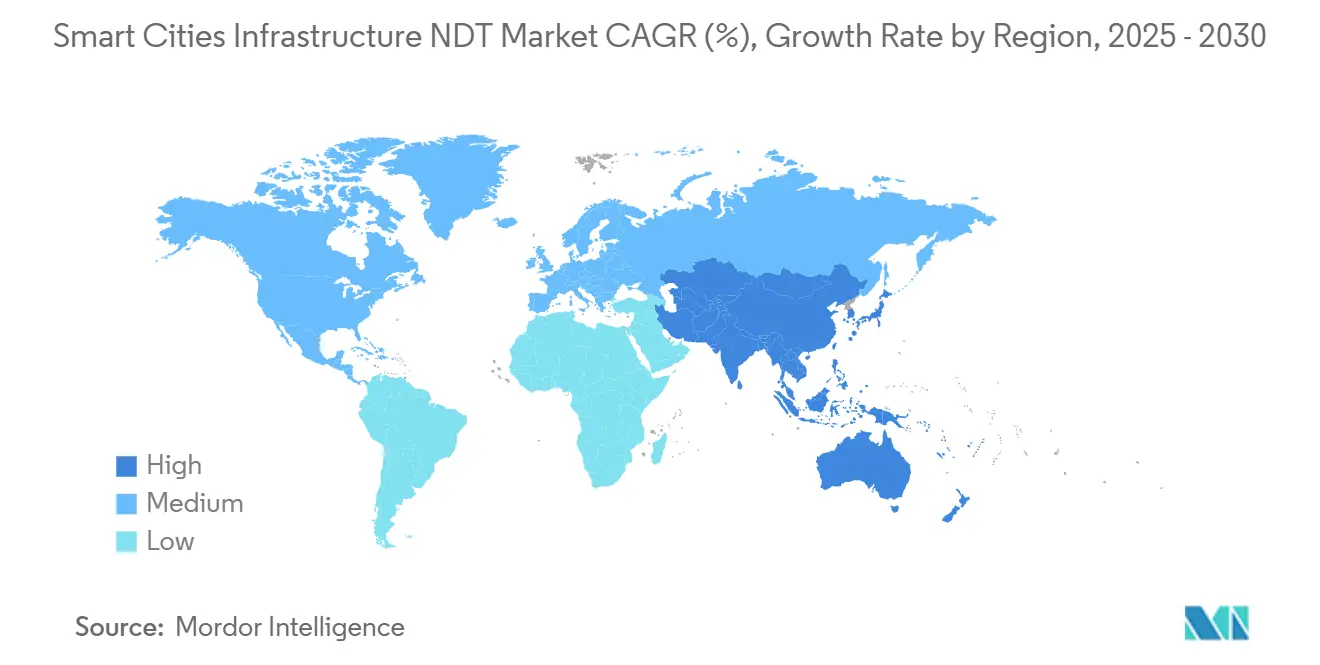
- By geography, North America dominated the Smart Cities Infrastructure NDT market, with a 36.7% share in 2024. In contrast, the Asia-Pacific region is forecast to register a 19.1% CAGR from 2024 to 2030.
Global Smart Cities Infrastructure NDT Market Trends and Insights
Drivers Impact Analysis*
| Driver | (~) % Impact on CAGR Forecast | Geographic Relevance | Impact Timeline |
|---|---|---|---|
| Rapid roll-out of 5G-enabled smart city sensor grids | +3.2% | Global, with early deployment in North America and the Asia-Pacific | Short term (≤ 2 years) |
| Aging critical infrastructure in OECD cities demands life-extension testing | +4.1% | North America and Europe primarily | Medium term (2-4 years) |
| Post-pandemic stimulus funding earmarked for resilient urban assets | +2.8% | Global, concentrated in developed economies | Short term (≤ 2 years) |
| Mandates for carbon-neutral retrofit audits are driving inspection volumes | +2.3% | Europe and North America, expanding to the Asia-Pacific | Medium term (2-4 years) |
| AI-enabled real-time defect analytics improving ROI of NDT deployments | +3.5% | Global, led by technology-advanced markets | Long term (≥ 4 years) |
| Growing public-private partnership models are lowering procurement barriers | +1.9% | Global, particularly strong in emerging markets | Medium term (2-4 years) |
| Source: Mordor Intelligence | |||
Rapid Roll-Out of 5G-Enabled Smart City Sensor Grids
Cities racing to deploy 5G networks must protect dense arrays of towers, fiber conduits, and edge nodes that form the backbone of autonomous vehicle coordination, emergency response, and high-bandwidth services for citizens. Updated ETSI guidelines released in 2024 require periodic non-destructive testing of telecom structures, prompting municipalities to adopt integrated monitoring solutions with live data feeds.[1]European Telecommunications Standards Institute, “Standards for 5G Infrastructure Integration,” etsi.org NDT providers that couple ultrasonic, acoustic, and vibration sensors with cloud dashboards are winning multi-year contracts, as real-time defect alerts prevent network outages and enhance public safety. The Smart Cities Infrastructure NDT market, therefore, sees immediate boosts in hardware sales and recurring analytics subscriptions. North America and the Asia-Pacific region are the first to showcase early deployments, setting benchmarks that later influence deployments in Europe, Latin America, and the Middle East.
Aging Critical Infrastructure in OECD Cities Demanding Life-Extension Testing
More than 60% of bridges, tunnels, and water pipelines across North America and Europe now exceed original design life, creating a USD 3.7 trillion investment gap through 2030.[2]OECD, “OECD Infrastructure Outlook 2024,” oecd.org Instead of full replacement, city engineers deploy continuous NDT to squeeze additional decades from existing assets. Permanent sensors embedded in concrete or steel beam housings collect ultrasonic and acoustic emissions round-the-clock, feeding AI models that predict fatigue with day-level accuracy. This shift converts NDT from a periodic cost item to an essential life-cycle strategy, locking in stable revenues for qualified service providers. Long-term concession contracts, some exceeding 10 years, are becoming increasingly common as city councils seek budget predictability while complying with new safety legislation.
Post-Pandemic Stimulus Funding Earmarked for Resilient Urban Assets
Government stimulus packages, such as the United States Infrastructure Investment and Jobs Act and Europe’s Recovery and Resilience Facility, allocate billions for smart bridges, roads, and utility grids. Inspection and monitoring are now accepted grant-eligible expenses, allowing municipalities to bundle NDT sensors and cloud platforms into capital projects.[3]U.S. Department of Transportation, “Infrastructure Investment and Jobs Act Implementation,” transportation.gov Providers that help cities craft compliance documentation secure preferred-vendor status, accelerating contract volumes in the Smart Cities Infrastructure NDT market. Because stimulus outlays are front-loaded into 2025-2027, vendors able to mobilize equipment and technicians rapidly hold a crucial timing edge.
AI-Enabled Real-Time Defect Analytics Improving ROI of NDT Deployments
Machine-learning models boost flaw detection accuracy up to 40 % and slash false positives, according to a 2024 IEEE review. Vendors such as Waygate Technologies integrate edge AI within ultrasonic probes, delivering instant severity ratings and recommended repair windows. These insights enable asset owners to schedule maintenance only when thresholds warrant action, resulting in measurable savings that validate NDT investments. The capability also eases labor shortages by complementing technician expertise. As proofs of value circulate, purchasing objections decline, fueling a virtuous adoption cycle that sustains the Smart Cities Infrastructure NDT market in the long term.
Restraints Impact Analysis*
| Restraint | (~) % Impact on CAGR Forecast | Geographic Relevance | Impact Timeline |
|---|---|---|---|
| Shortage of certified level-III technicians for large-scale projects | -2.4% | Global, particularly acute in emerging markets | Medium term (2-4 years) |
| Fragmented municipal procurement cycles are delaying contract awards | -1.8% | Global, more pronounced in developing economies | Short term (≤ 2 years) |
| High initial capex for advanced robotics and drone-based systems | -2.1% | Global, affecting smaller service providers | Short term (≤ 2 years) |
| Cybersecurity concerns over connected NDT devices in smart grids | -1.5% | Global, heightened in security-sensitive markets | Medium term (2-4 years) |
| Source: Mordor Intelligence | |||
Shortage of Certified Level-III Technicians for Large-Scale Projects
The American Society for Nondestructive Testing reports 15,000 unfilled level-III roles worldwide, a gap that stretches project timelines and inflates labor costs. Urban infrastructure audits often require simultaneous deployment of many senior specialists, yet certification pathways span 5-7 years. Employers respond by subsidizing fast-track courses and embedding virtual coaching within inspection software; nonetheless, supply constraints are expected to linger through at least 2027. Markets with the steepest smart city buildouts, such as India and parts of Southeast Asia, feel the squeeze most acutely, potentially delaying full project scopes and moderating near-term growth in the Smart Cities Infrastructure NDT market.
Cyber-Security Concerns over Connected NDT Devices in Smart Grids
Forty percent of municipal IT leaders list IoT device security as a top barrier to adopting networked monitoring tools, according to NIST surveys.[4]National Institute of Standards and Technology, “Cybersecurity Framework for Smart City Infrastructure,” nist.gov Intrusions could falsify defect readings or create pathways for broader sabotage of critical infrastructure. The European Union’s Cyber Resilience Act, effective in 2024, mandates the implementation of baseline encryption and intrusion logging for devices used in essential services. Compliance raises equipment costs and extends procurement cycles, especially in defense-sensitive locations. Over time, however, standardized security frameworks tend to favor established vendors that can demonstrate end-to-end protection, potentially consolidating the Smart Cities Infrastructure NDT market around cyber-mature providers.
*Our forecasts treat driver/restraint impacts as directional, not additive. The impact forecasts reflect baseline growth, mix effects, and variable interactions.
Segment Analysis
By Testing Method: Ultrasonic Retains Lead, Drone Inspection Accelerates
Ultrasonic testing held a 34.2% market share in the Smart Cities Infrastructure NDT market in 2024, prized for its ability to detect internal flaws without surface preparation and for earning broad regulatory acceptance. Municipal bridge authorities and water utilities specify ultrasonic sweeps in their routine codes, creating a steady demand for both portable and permanently embedded transducers. The Smart Cities Infrastructure NDT market size for ultrasonic solutions is projected to reach USD 0.55 billion by 2030, as newer phased-array devices reduce scan times and integrate AI-based defect libraries.
Visual inspection via drones, which is growing at a 19.2% CAGR, owes its momentum to evolving flight-safety rules that now permit beyond-line-of-sight missions over urban corridors. Swarm drones equipped with high-resolution optics and LiDAR capture data from façades, telecom masts, and solar arrays far faster than manual rope-access can. As analytics platforms stitch imagery into city-scale digital twins, defect localization becomes automated, spurring adoption by facility managers who prioritize cost and worker safety. While radiographic, electromagnetic, thermography, and acoustic methods each occupy specific niches, ISO 9712’s 2024 update standardizes personnel qualifications, improving cross-method quality and opening multi-discipline contract awards to single providers.


By Infrastructure Asset Type: Roads and Bridges Command Spend, Telecom Surges
Roads and bridges generated 28.5% of 2024 revenue owing to statutory inspection cycles and the sheer linear kilometers under municipal stewardship. In the United States alone, USD 40 billion per year is earmarked for bridge rehabilitation, much of which funnels into ultrasonic, acoustic, and ground-penetrating radar tests at concrete decks and steel beams. The Smart Cities Infrastructure NDT market size for these assets is poised to expand steadily through 2030 as aging interstates and rail flyovers undergo life-extension retrofits.
Telecom and data centers are the fastest-growing sectors, registering a 19.4% CAGR as 5G small-cell densification, fiber backhaul, and edge facilities proliferate in high-traffic districts. High-frequency electromagnetic exposure places stricter tolerance on structural integrity, necessitating denser inspection schedules. Providers with telecom-grade safety clearances and RF-aware test protocols capture premium rates. Buildings, power grids, water networks, and rail systems continue to draw consistent spending, particularly where energy efficiency mandates and smart-mobility programs replace legacy assets with sensor-rich substitutes.
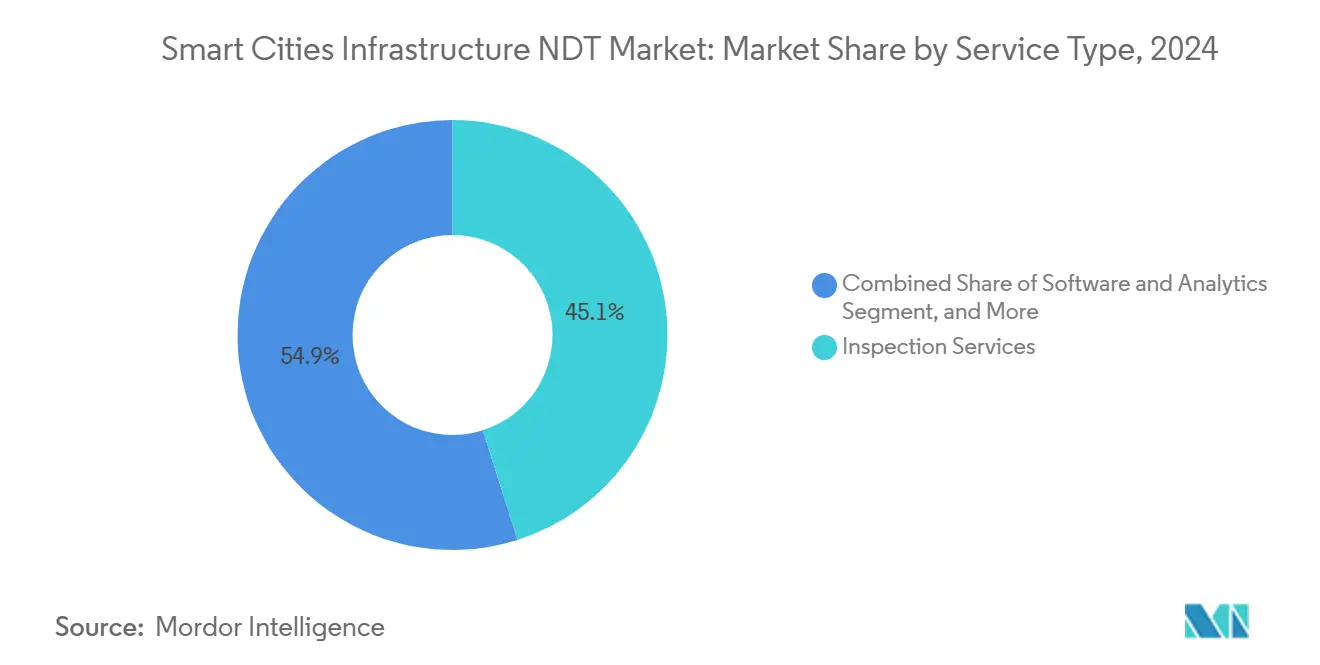
By Service Type: Inspection Services Dominate, Software Analytics Rises
Inspection services accounted for 45.1% of 2024 revenue, reflecting the labor-intensive nature of onsite work and compliance rules that require certified signatures. Multi-year master service agreements bundle recurring inspections across bridges, tunnels, and substations, giving vendors predictable cash flows. Equipment sales progress more modestly because high-performance scanners command long replacement cycles. Leasing and rental lines grow as smaller regional players opt for asset-light models.
Notably, software and analytics are logging the fastest growth rate at a 21.6% CAGR. Cloud dashboards ingest multi-modal sensor feeds, overlay AI for anomaly detection, and issue maintenance work orders, converting raw readings into decision-grade intelligence. Several cities now stipulate that bidders provide open-API data hand-off, positioning analytics as the glue that aligns NDT with broader digital-twin ecosystems. Training and certification services also expand, as vendors monetize proprietary courseware to accelerate technician upskilling and partially alleviate the Level-III scarcity hindering the Smart Cities Infrastructure NDT market.
By End User: Municipalities Spend Most, Facility Managers Scale Fast
Municipal governments represented 40.4% of 2024 expenditures, as safety statutes require them to document inspections, and political accountability intensifies following high-profile collapses. They often write multiyear frameworks that bundle roads, power, and building portfolios, favoring vendors with broad modality coverage.
Facility management firms are the growth champions, with an 18.9% CAGR. As office towers and mixed-use complexes embed smart HVAC, photovoltaics, and automated parking, property managers outsource specialized NDT to validate structural health and energy targets. Utilities and transportation authorities maintain a substantial share of grid modernization and transit-system renewals. Independent inspection bodies serve as third-party verifiers for both public and private owners, especially in jurisdictions where procurement laws require external assurance.
Geography Analysis
North America generated 36.7% of 2024 revenue, anchored by the USD 1.2 trillion Infrastructure Investment and Jobs Act. Federal matching grants channel funds into bridge retrofits, smart highway sensors, and city transit upgrades, all of which embed inspection clauses. The United States also leads on drone flight waivers and AI ethics guidance, enabling early commercialization of automated assessment platforms. Canada adds momentum through its CAD 1.8 trillion (USD 1.35 trillion) National Infrastructure Assessment that spotlights lifecycle monitoring for climate resilience.
The Asia-Pacific is the focal point of acceleration, forecasted to grow at a 19.1% CAGR. China’s 14th Five-Year Plan allocates USD 1.4 trillion for smart city infrastructure, with a focus on AI-enabled safety diagnostics. India’s 100-city mission channels USD 28 billion toward ICT-rich urban cores that require integrated NDT from the outset. Southeast Asian nations, aided by multilateral development banks, invest heavily in elevated metros and fiber grids, fueling cross-border demand for certified inspection capacity that currently lags needs.
Europe continues to expand steadily under the Green Deal. The Renovation Wave aims to achieve 35 million building upgrades by 2030, each of which will require thermal imaging and ultrasonic wall thickness checks. Revised Eurocodes enforce stricter bridge fatigue criteria, resulting in increased inspection frequencies. The Middle East and Africa, while smaller in absolute terms, exhibit strong project pipelines tied to the Gulf Vision 2030 blueprints and African Union smart-city pilots. Public-private partnership structures dominate these regions, making the vendor's ability to assume performance risk a decisive factor.

Competitive Landscape
The Smart Cities Infrastructure NDT market is moderately fragmented, with the top five players collectively holding a significant share of the revenue. SGS, Bureau Veritas, and Intertek each account for less than 8%. These incumbents leverage global laboratory networks, established ISO accreditation, and government connections to secure nationwide inspection mandates. They are now acquiring AI boutiques to enhance analytics depth, as seen in SGS’s USD 85 million purchase of InspectAI in September 2025.
Specialist technology entrants leverage proprietary computer vision, robotics, and edge AI to win niche contracts, notably for telecom mast drones and autonomous sewer crawlers. Patent filings in automated inspection increased by 45% during 2024, underscoring the heat of innovation. Collaborations with cloud giants such as Microsoft and Siemens illustrate the convergence between physical testing and digital-twin ecosystems, blurring the lines between inspection firms and software integrators.
Labor scarcity shapes strategy: large providers pioneer remote-inspection centers where level-III experts supervise on-site junior crews via augmented-reality headsets, boosting productivity and spreading expertise globally. Security credentials also differentiate: Zetec’s ISO 27001 certification for connected devices gained it municipal traffic-tunnel contracts in 2025. Overall, pricing power remains balanced; yet owners increasingly prefer one-stop partners that can guarantee asset uptime, nudging the market toward gradual consolidation.
Smart Cities Infrastructure NDT Industry Leaders
Applus Services S.A.
Eddyfi Technologies Inc.
Zetec Inc.
Olympus-Evident Corporation
MISTRAS Group Inc.
- *Disclaimer: Major Players sorted in no particular order

Recent Industry Developments
- September 2025: SGS acquired AI-powered inspection firm InspectAI for USD 85 million, expanding digital smart-city monitoring capabilities.
- August 2025: Bureau Veritas partnered with Microsoft to launch a cloud monitoring platform integrating NDT feeds with Azure IoT services.
- July 2025: Intertek announced USD 50 million to open 15 smart-city labs across Asia-Pacific, targeting 5G asset certification.
- June 2025: MISTRAS Group acquired drone specialist SkyTech Solutions for USD 35 million to enhance large-structure visual inspection capabilities.


Global Smart Cities Infrastructure NDT Market Report Scope
| Ultrasonic Testing |
| Radiographic Testing |
| Electromagnetic Testing |
| Thermography Testing |
| Acoustic Emission Testing |
| Visual Inspection (Drones and ROVs) Testing |
| Roads and Bridges |
| Buildings and Smart Facilities |
| Power Transmission and Distribution Grids |
| Water and Sewage Networks |
| Mass-Transit and Rail Systems |
| Telecom and Data Centers |
| Inspection Services |
| Equipment Sales |
| Equipment Rental and Leasing |
| Training and Certification |
| Software and Analytics |
| Municipal Governments |
| Utilities and Energy Operators |
| Transportation Authorities |
| Facility Management Firms |
| Independent Inspection Bodies |
| North America | United States | |
| Canada | ||
| Mexico | ||
| South America | Brazil | |
| Argentina | ||
| Rest of South America | ||
| Europe | Germany | |
| United Kingdom | ||
| France | ||
| Italy | ||
| Spain | ||
| Rest of Europe | ||
| Asia Pacific | China | |
| Japan | ||
| India | ||
| South Korea | ||
| South-East Asia | ||
| Rest of Asia Pacific | ||
| Middle East and Africa | Middle East | Saudi Arabia |
| United Arab Emirates | ||
| Turkey | ||
| Rest of Middle East | ||
| Africa | South Africa | |
| Nigeria | ||
| Rest of Africa | ||
| By Testing Method | Ultrasonic Testing | ||
| Radiographic Testing | |||
| Electromagnetic Testing | |||
| Thermography Testing | |||
| Acoustic Emission Testing | |||
| Visual Inspection (Drones and ROVs) Testing | |||
| By Infrastructure Asset Type | Roads and Bridges | ||
| Buildings and Smart Facilities | |||
| Power Transmission and Distribution Grids | |||
| Water and Sewage Networks | |||
| Mass-Transit and Rail Systems | |||
| Telecom and Data Centers | |||
| By Service Type | Inspection Services | ||
| Equipment Sales | |||
| Equipment Rental and Leasing | |||
| Training and Certification | |||
| Software and Analytics | |||
| By End User | Municipal Governments | ||
| Utilities and Energy Operators | |||
| Transportation Authorities | |||
| Facility Management Firms | |||
| Independent Inspection Bodies | |||
| By Geography | North America | United States | |
| Canada | |||
| Mexico | |||
| South America | Brazil | ||
| Argentina | |||
| Rest of South America | |||
| Europe | Germany | ||
| United Kingdom | |||
| France | |||
| Italy | |||
| Spain | |||
| Rest of Europe | |||
| Asia Pacific | China | ||
| Japan | |||
| India | |||
| South Korea | |||
| South-East Asia | |||
| Rest of Asia Pacific | |||
| Middle East and Africa | Middle East | Saudi Arabia | |
| United Arab Emirates | |||
| Turkey | |||
| Rest of Middle East | |||
| Africa | South Africa | ||
| Nigeria | |||
| Rest of Africa | |||


Key Questions Answered in the Report
What is the 2025 valuation of the Smart Cities Infrastructure NDT market?
The market is valued at USD 0.74 billion in 2025.
What is the projected growth rate of the Smart Cities Infrastructure NDT market?
It is forecast to expand at a 17.4% CAGR, reaching USD 1.65 billion by 2030.
Which testing method currently holds the largest share of revenue?
Ultrasonic testing leads with a 34.2% share in 2024.
Which region is growing the fastest?
Asia-Pacific is projected to record a 19.1% CAGR through 2030.
What is the main restraint facing service providers?
A shortage of certified level-III technicians limits large-scale deployment capacity.
Which end-user group is expanding the quickest?
Facility management firms are projected to advance at a 18.9% CAGR through 2030.
Page last updated on:


