Construction And Infrastructure NDT Market Size and Share
Market Overview
| Study Period | 2019 - 2030 |
|---|---|
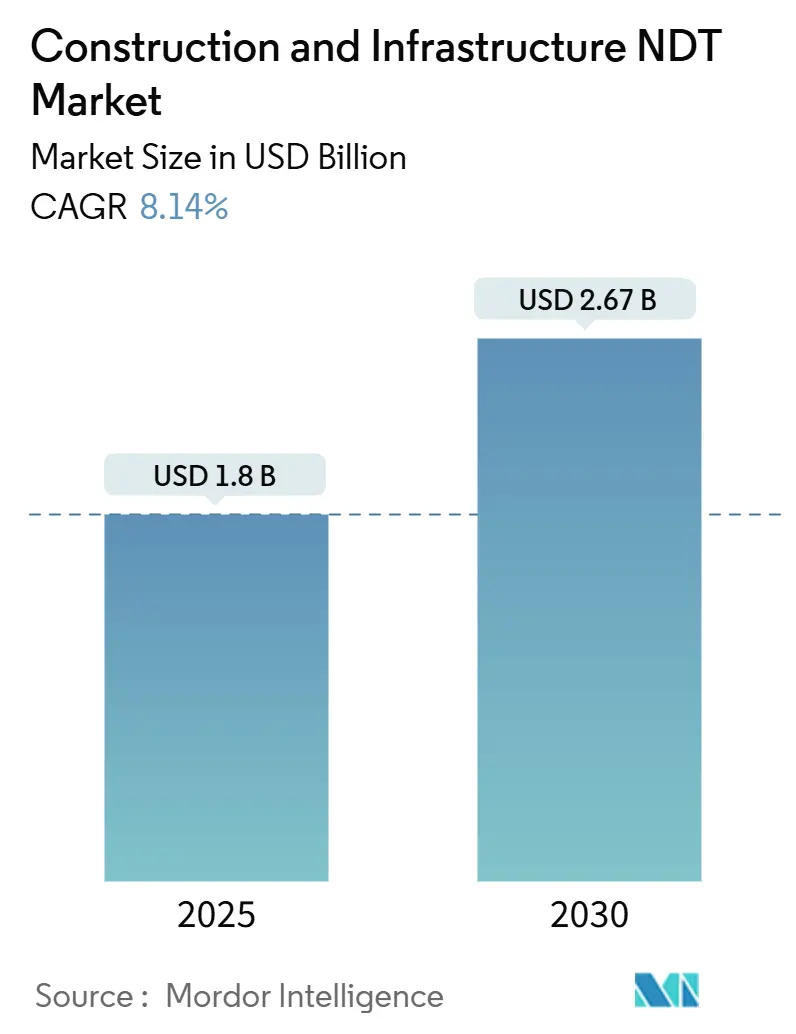
| Market Size (2025) | USD 1.8 Billion |
| Market Size (2030) | USD 2.67 Billion |
| Growth Rate (2025 - 2030) | 8.14% CAGR |
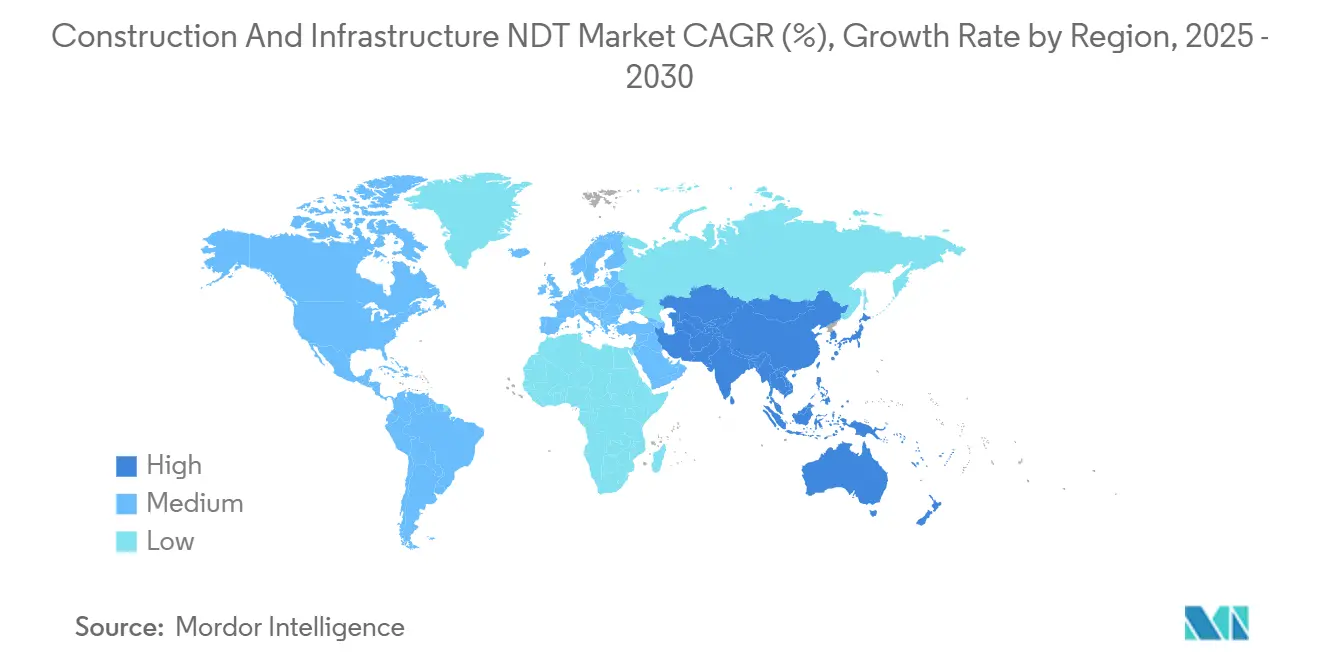
| Fastest Growing Market | Asia Pacific |
| Largest Market | North America |
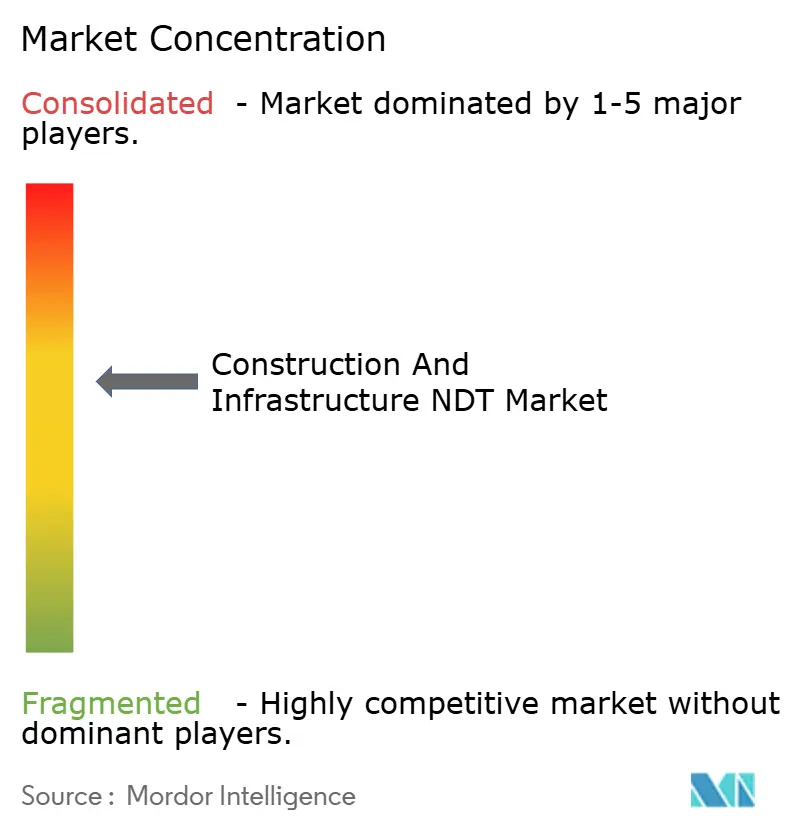
| Market Concentration | Medium |
Major Players *Disclaimer: Major Players sorted in no particular order Image © Mordor Intelligence. Reuse requires attribution under CC BY 4.0. | |
Construction And Infrastructure NDT Market Analysis by Mordor Intelligence
The construction and infrastructure NDT market size reached USD 1.80 billion in 2025 and is forecast to expand at an 8.14% CAGR, pushing total value to USD 2.67 billion by 2030. The vigorous outlook stems from overlapping forces, including aging bridges and tunnels, stricter global safety codes, and the rapid maturation of portable automated inspection systems, which collectively keep the construction and infrastructure NDT market on a sustained growth path. Demand is especially strong where urbanization drives new build activity, yet heightens scrutiny of legacy structures. The widespread availability of high-resolution ultrasonic and radiographic devices shortens inspection cycles, while AI-enabled analytics unlock faster data interpretation, thereby reducing project downtime. Competitive intensity has risen as insurers reward digital documentation with premium discounts; yet, cloud-security anxieties still deter some smaller contractors from fully adopting the platform.
Key Report Takeaways
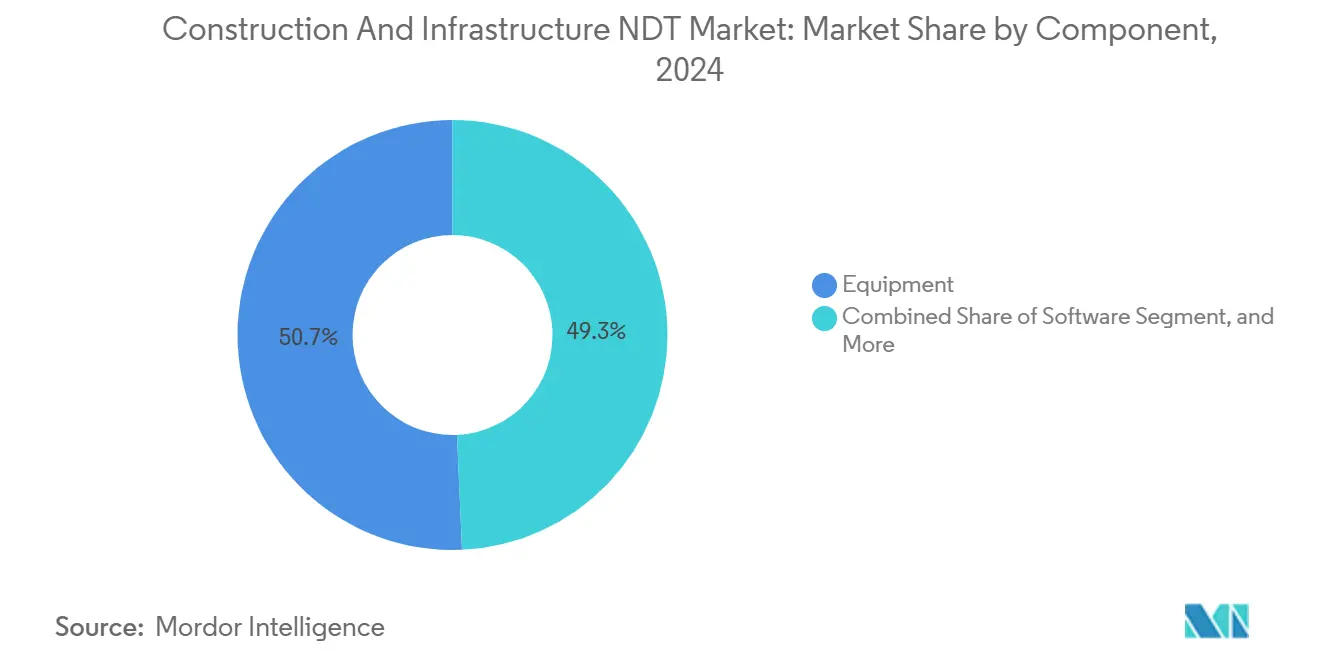
- By component, equipment led with a 50.7% revenue share of the construction and infrastructure NDT market in 2024; software is expected to advance at a 9.6% CAGR through 2030.
- By testing method, ultrasonic testing captured 34.1% of the construction and infrastructure NDT market share in 2024; computed tomography is projected to post the fastest growth rate of 10.8% from 2024 to 2030.
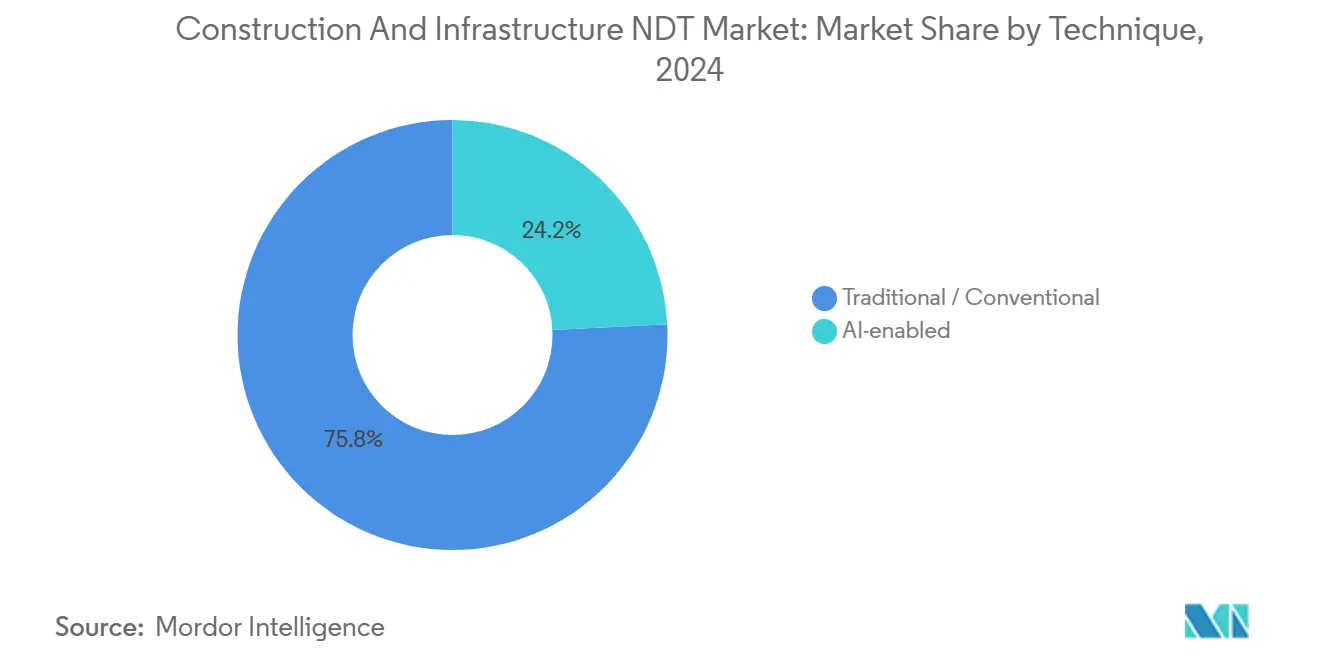
- By technique, traditional approaches held a 75.8% share of the construction and infrastructure NDT market in 2024, while AI-enabled systems are projected to accelerate at an 8.9% CAGR over the same horizon.
- By geography, North America accounted for 37.88% of the 2024 revenues of the construction and infrastructure NDT market; the Asia Pacific is expected to deliver the highest 10.1% CAGR through 2030.
Global Construction And Infrastructure NDT Market Trends and Insights
Drivers Impact Analysis*
| Driver | (~) % Impact on CAGR Forecast | Geographic Relevance | Impact Timeline |
|---|---|---|---|
| Stricter global safety-code enforcement | +1.8% | North America, Europe first movers, now global | Short term (≤ 2 years) |
| Aging bridges, tunnels, and buildings | +2.1% | Core in North America and Europe, spreading to Asia Pacific | Medium term (2-4 years) |
| Portable automated UT and RT systems maturity | +1.4% | Worldwide; manufacturing hubs in Germany and Japan | Short term (≤ 2 years) |
| Insurance premium discounts on digital logs | +0.9% | Piloted in North America and Europe, emerging in Asia Pacific | Medium term (2-4 years) |
| Drone-based facade inspections | +1.2% | Urban centers worldwide; EU and North America regulatory drivers | Short term (≤ 2 years) |
| Green-material stimulus test protocols | +0.7% | Europe and North America first, expanding in sustainability-led Asia Pacific | Long term (≥ 4 years) |
| Source: Mordor Intelligence | |||
Stricter Global Safety-Code Enforcement
Government agencies strengthened building and bridge safety statutes after several high-profile collapses highlighted inspection gaps. Updated rules now require more frequent structural assessments, expanding mandatory test scope beyond visual checks to include ultrasonic, radiographic, and computed tomography techniques. North American states have incorporated AISC NDT competency clauses, while the European Commission has embedded similar language in its revised Construction Products Regulation.[1]European Commission, “Construction Products Regulation Update,” ec.europa.euContractors striving for compliance increasingly adopt integrated platforms that marry data capture, analytics, and cloud archiving, fueling widespread uptake across the construction and infrastructure NDT market. Insurers endorse the move, tying coverage terms to documented compliance, further accelerating demand.
Aging Bridges, Tunnels, and Buildings Reaching End-of-Life
Nearly half of U.S. bridges were over 50 years old in 2024, mirroring patterns across Europe’s 1960s-era highway network. Replacement budgets alone cannot address the volume; hence, asset owners rely on predictive NDT programs to prolong service life. When systematic ultrasonic and acoustic emission testing is applied, service life extensions of 15-20 years are common, resulting in lifecycle costs that are well below reconstruction budgets. Policymakers now bundle inspection mandates with federal funding, embedding demand certainty into the construction and infrastructure NDT market. Similar policies are emerging in Japan and South Korea for earthquake-prone viaducts, expanding the global adoption footprint.
Portable Automated UT and RT Systems Maturity
Advances in detector sensitivity, battery life, and onboard processing trimmed fieldwork time by roughly 60%, making modern handheld devices indispensable for remote sites. Waygate Technologies’ latest portable computed radiography platform incorporates AI-driven defect recognition, reducing interpretation time by 40%. [2]Waygate Technologies, “Portable NDT Solutions for Construction Applications,” waygate-tech.comFaster turnaround lets project managers compress maintenance schedules, unlocking immediate labor savings that outweigh equipment lease costs. The resulting efficiency narrative resonates strongly among project owners juggling tight shutdown windows, sustaining double-digit order growth for portable units across the construction and infrastructure NDT market.
Insurance Premium Discounts Linked to Digital Inspection Logs
Insurers quantify reduced claim frequency when projects keep granular inspection records. Shepherd Insurance recorded a 15% premium drop on a USD 260 million Owner Controlled Insurance Program after the rollout of digital NDT documentation.[3]Shepherd Insurance, “Digital Inspection Systems Premium Reduction Analysis,” shepherdinsurance.comPremium savings often exceed USD 1 million annually on mega-projects, covering most software subscription fees. Contractors now treat the discount as a competitive lever in bids, propelling high adoption rates for cloud-based log systems. Providers that package encryption, multi-stakeholder access, and automated report generation secure recurring revenue streams while embedding themselves deeper into client workflows.
Restraints Impact Analysis*
| Restraint | (~) % Impact on CAGR Forecast | Geographic Relevance | Impact Timeline |
|---|---|---|---|
| High capital cost of advanced equipment | -1.3% | Worldwide; most acute in emerging markets | Medium term (2-4 years) |
| Shortage of certified NDT technicians | -1.1% | Global; pronounced in North America and Western Europe | Long term (≥ 4 years) |
| Slow regulatory accreditation of AI methods | -0.8% | North America and Europe leadership, slow adoption elsewhere | Medium term (2-4 years) |
| Cyber-security worries over cloud data | -0.6% | Critical infrastructure owners worldwide, heightened in utilities | Short term (≤ 2 years) |
| Source: Mordor Intelligence | |||
High Capital Cost of Advanced Equipment
State-of-the-art phased-array ultrasonic rigs with full matrix capture exceed USD 500,000, a threshold that sidelines smaller contractors. Leasing and performance-based contracts mitigate the impact, but interest rates and currency volatility in emerging regions continue to hinder adoption. Vendors now bundle financing with training to widen market access; however, the steep upfront outlay continues to restrain the construction and infrastructure NDT market’s full potential in the medium term.
Shortage of Certified NDT Technicians
An aging workforce meets a rising volume of inspections, creating a talent gap. Certification programs take years, and post-pandemic retirements exacerbated shortages. Companies use AI-assisted interpretation to boost inspector productivity, but regulators still require human sign-off, keeping labor availability a bottleneck that drags on long-term growth.
*Our forecasts treat driver/restraint impacts as directional, not additive. The impact forecasts reflect baseline growth, mix effects, and variable interactions.
Segment Analysis
By Component: Equipment Dominance Challenged by Software Innovation
Equipment generated the largest revenue slice, accounting for 50.7% of 2024 turnover within the construction and infrastructure NDT market. Ultrasonic devices drove hardware demand due to their versatility across steel, concrete, and composite assets, while portable computed radiography units gained traction in bridge deck surveys. However, software revenue is compounding at a 9.6% CAGR, outpacing all other components as AI algorithms elevate defect detection accuracy and automated report generation accelerates compliance cycles.
The rise of cloud platforms means field teams capture data once and share it instantly with engineers, regulators, and insurers. Owners increasingly prioritize end-to-end solutions where software orchestrates data flow across mixed hardware fleets. Vendors now embed analytics directly into handheld units, turning equipment into gateways for continuous data streams that feed predictive maintenance dashboards. Services revenue grows steadily as owners outsource expertise, and consumables sales mirror inspection volume, reinforcing an annuity-like aspect to the construction and infrastructure NDT market.


By Testing Method: Ultrasonic Leadership Faces Computed Tomography Disruption
Ultrasonic testing retained a 34.1% share in 2024, maintaining its position as the top method due to its non-invasive depth profiling and portability. Highway agencies routinely specify phased-array surveys for post-tensioned bridge tendons, while transit authorities use thickness gauging to track tunnel lining wear. Yet computed tomography testing is expanding at a 10.8% CAGR, thanks to dropping scanner costs and the method’s ability to generate 3D reconstructions of complex concrete or composite nodes that evade traditional probes.
Radiographic testing continues to serve as code-mandated weld inspections, and magnetic particle and liquid penetrant techniques remain staples for surface flaw detection. Visual drone-enabled surveys grow as image-analysis AI flags facade defects. Acoustic emission systems monitor live load events, particularly on cable-stayed bridges, where immediate alerts are crucial. Thermography gains momentum in energy-efficiency retrofits, while eddy-current tools occupy narrow niches in aluminum pedestrian bridges. The convergence of imaging and analytics promises blended workflows where operators pair ultrasonic sweeps with targeted CT scans to maximize diagnostic certainty.
By Technique: AI-Enabled Systems Challenge Traditional Dominance
Traditional procedures kept a 75.8% foothold in 2024, reflecting entrenched certification rules that privilege proven methodologies. Experienced technicians value familiar workflows, and liability insurers currently discount projects that follow conventional codes. Nonetheless, AI-enabled solutions are racing ahead at an 8.9% CAGR. Pattern-recognition models trained on millions of flaw images catch micro-cracking earlier than human eyes and cut interpretation variability, a vital benefit for high-risk assets.
Regulators are now conducting validation pilots, and early approvals in Canada and Singapore demonstrate the trajectory toward broader acceptance. Leading service providers integrate AI engines as decision-support tools rather than replacements, easing workforce skepticism while capturing efficiency gains. As datasets grow and false-positive rates decline, market share will inevitably shift toward AI-assisted workflows, narrowing the gap with conventional techniques by the end of the decade within the construction and infrastructure NDT market.
Geography Analysis
North America accounted for 37.88% of 2024 revenue, underpinned by the Infrastructure Investment and Jobs Act, which allocated USD 550 billion for transportation upgrades. Federal agencies couple funding with stringent ASCE inspection intervals, anchoring steady demand. Asset owners widely adopted digital logbooks to qualify for insurance rebates, thereby reinforcing the uptake of software. Canada follows a similar trajectory, with provincial bridge-maintenance programs mandating phased-array ultrasonic scans every five years.
Asia Pacific posts the fastest 10.1% CAGR, catalyzed by China’s Belt and Road Initiative and India’s USD 1.4 trillion National Infrastructure Pipeline. Governments source advanced testing rigs from Japan and Germany but nurture local technician pools through accelerated certification drives. Elevated urbanization spawns high-rise safety rules that mandate drone facade inspections, adding another growth vector to the construction and infrastructure NDT market.
Europe shows steady expansion fueled by post-war infrastructure reaching critical age thresholds. Germany sponsors R&D in computed tomography at institutes like Fraunhofer, accelerating the diffusion of technology. The EU’s refreshed Construction Products Regulation codifies NDT protocols for sustainable materials, channeling funds toward green-retrofit projects. In parallel, emerging regions in South America, the Middle East, and Africa are integrating ISO-based inspection frameworks into new road and rail megaprojects, gradually expanding the global revenue base.

Competitive Landscape
The marketplace remains moderately fragmented, yet the momentum for consolidation is unmistakable. SGS vaulted into pole position after its USD 1.325 billion acquisition of ATS in July 2025.[4]SGS Group, “ATS Acquisition Press Release,” sgs.comThe deal combines SGS’s global laboratory network with ATS’s U.S. bridge-testing expertise, resulting in an unmatched geographic footprint. ShawCor’s USD 260 million purchase of Desert NDT in the same month strengthened ultrasound and radiography capacity across the U.S. Southwest.
Technology leadership shapes competitive advantage. MISTRAS Group has secured ISO 9001:2015 certification for its AI-enhanced platforms, providing conservative asset owners with an assurance layer. Waygate Technologies launched a portable computed radiography system with onboard AI, reducing evaluation time by 40%. Meanwhile, Flyability’s confined-space drones dominate European facade mandates. Vendors differentiate through integrated offerings that fuse hardware, software, and services under a single quality umbrella, a model gaining traction among multinational construction consortia.
Despite headline mergers, hundreds of regional specialists survive by focusing on niche domains, such as cathodic-protection audits or tunnel LIDAR mapping. These firms often partner with global primes to access projects outside their home territories. The resulting ecosystem balances economies of scale with localized expertise, sustaining competitive tension and innovation velocity within the construction and infrastructure NDT market.
Construction And Infrastructure NDT Industry Leaders
Baker Hughes Company
Mistras Group Inc.
SGS SA
Intertek Group plc
Applus Services SA
- *Disclaimer: Major Players sorted in no particular order

Recent Industry Developments
- August 2025: Waygate Technologies has released a portable computed radiography system featuring embedded AI defect recognition.
- July 2025: SGS acquired ATS for USD 1.325 billion, creating the largest integrated NDT services platform in North America and Europe.
- July 2025: ShawCor completed the USD 260 million takeover of Desert NDT, reinforcing ultrasound and radiography capabilities across the U.S. Southwest.
- May 2025: Element Materials Technology bought ISS, expanding European steel and concrete testing coverage.
- May 2025: Flyability introduced a confined-space drone specifically designed for tunnel and underground inspections.
- April 2025: Zetec launched a 12-hour battery phased-array ultrasonic system for extended bridge surveys.


Global Construction And Infrastructure NDT Market Report Scope
Non-destructive testing (NDT) involves inspecting, testing, or evaluating components, materials, or assemblies. NDT involves examining disparities in characteristics or discontinuities, primarily without hampering the serviceability of the product or part.
The construction and infrastructure NDT market report is segmented by component (equipment, software, Services, Consumables), testing method (ultrasonic testing, radiographic testing, magnetic particle testing, liquid penetrant testing, visual inspection testing, eddy-current testing, acoustic emission testing, thermography / infrared testing, computed tomography testing), technique (traditional/conventional, and ai-enabled), and geography (North America, South America, Europe, Asia Pacific, Middle East, and Africa). The market forecasts are provided in terms of value (USD).
| Equipment |
| Software |
| Services |
| Consumables |
| Ultrasonic Testing |
| Radiographic Testing |
| Magnetic Particle Testing |
| Liquid Penetrant Testing |
| Visual Inspection Testing |
| Eddy-Current Testing |
| Acoustic Emission Testing |
| Thermography / Infrared Testing |
| Computed Tomography Testing |
| Traditional / Conventional |
| AI-enabled |
| North America | United States |
| Canada | |
| Mexico | |
| South America | Brazil |
| Argentina | |
| Rest of South America | |
| Europe | Germany |
| United Kingdom | |
| France | |
| Italy | |
| Spain | |
| Rest of Europe | |
| Asia Pacific | China |
| Japan | |
| India | |
| South Korea | |
| South East Asia | |
| Rest of Asia Pacific | |
| Middle East | Saudi Arabia |
| United Arab Emirates | |
| Turkey | |
| Rest of Middle East | |
| Africa | South Africa |
| Nigeria | |
| Rest of Africa |
| By Component | Equipment | |
| Software | ||
| Services | ||
| Consumables | ||
| By Testing Method | Ultrasonic Testing | |
| Radiographic Testing | ||
| Magnetic Particle Testing | ||
| Liquid Penetrant Testing | ||
| Visual Inspection Testing | ||
| Eddy-Current Testing | ||
| Acoustic Emission Testing | ||
| Thermography / Infrared Testing | ||
| Computed Tomography Testing | ||
| By Technique | Traditional / Conventional | |
| AI-enabled | ||
| By Geography | North America | United States |
| Canada | ||
| Mexico | ||
| South America | Brazil | |
| Argentina | ||
| Rest of South America | ||
| Europe | Germany | |
| United Kingdom | ||
| France | ||
| Italy | ||
| Spain | ||
| Rest of Europe | ||
| Asia Pacific | China | |
| Japan | ||
| India | ||
| South Korea | ||
| South East Asia | ||
| Rest of Asia Pacific | ||
| Middle East | Saudi Arabia | |
| United Arab Emirates | ||
| Turkey | ||
| Rest of Middle East | ||
| Africa | South Africa | |
| Nigeria | ||
| Rest of Africa | ||


Key Questions Answered in the Report
What is the 2025 value of the construction and infrastructure NDT market?
The market generated USD 1.80 billion in 2025.
How fast is the market expected to grow through 2030?
Industry revenue is projected to rise at an 8.14% CAGR, reaching USD 2.67 billion.
Which component category is expanding the quickest?
Software leads growth with a 9.6% CAGR as AI-enabled analytics gain traction.
Why are drone-based facade inspections gaining popularity?
New high-rise safety laws in the EU and North America mandate comprehensive facade checks, and drones cut inspection costs by up to 60%.
Which region shows the strongest future growth?
Asia Pacific is forecast to post a 10.1% CAGR through 2030 due to large-scale infrastructure programs in China and India.
What drives insurer support for digital NDT logs?
Documented inspection histories lower claim frequency and severity, enabling premium reductions of up to 15%.
Page last updated on:


