IoT-Enabled NDT Market Size and Share
Market Overview
| Study Period | 2019 - 2030 |
|---|---|
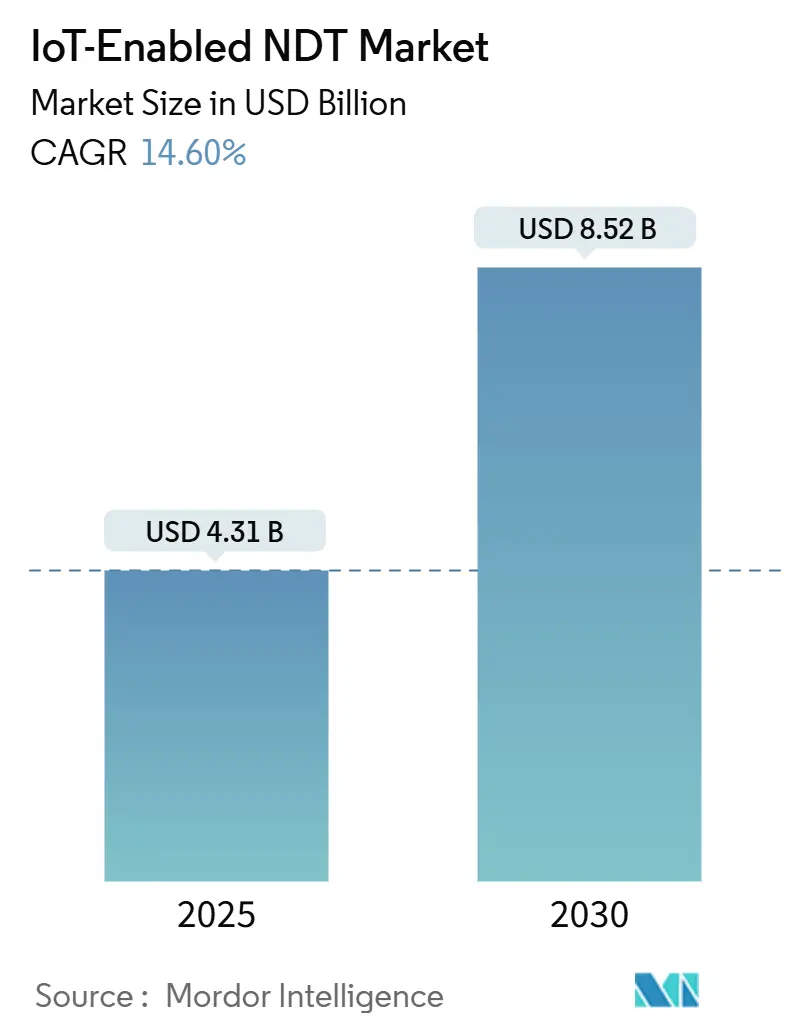
| Market Size (2025) | USD 4.31 Billion |
| Market Size (2030) | USD 8.52 Billion |
| Growth Rate (2025 - 2030) | 14.60% CAGR |
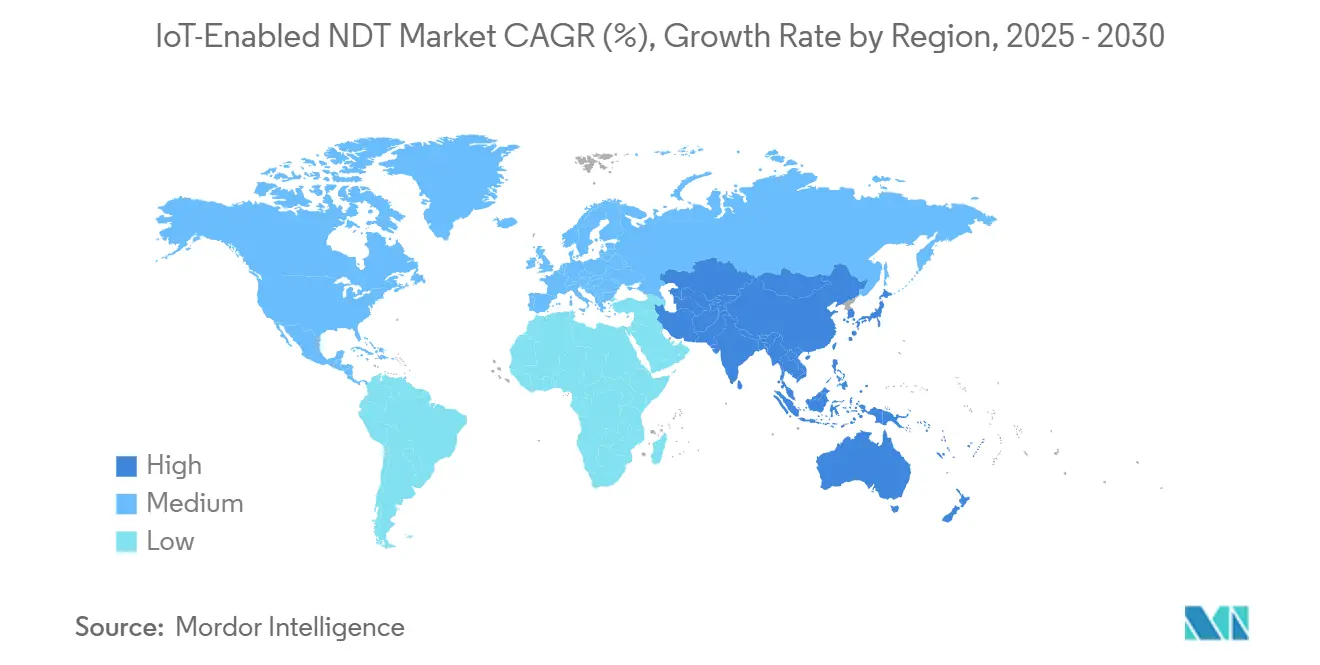
| Fastest Growing Market | Asia Pacific |
| Largest Market | North America |
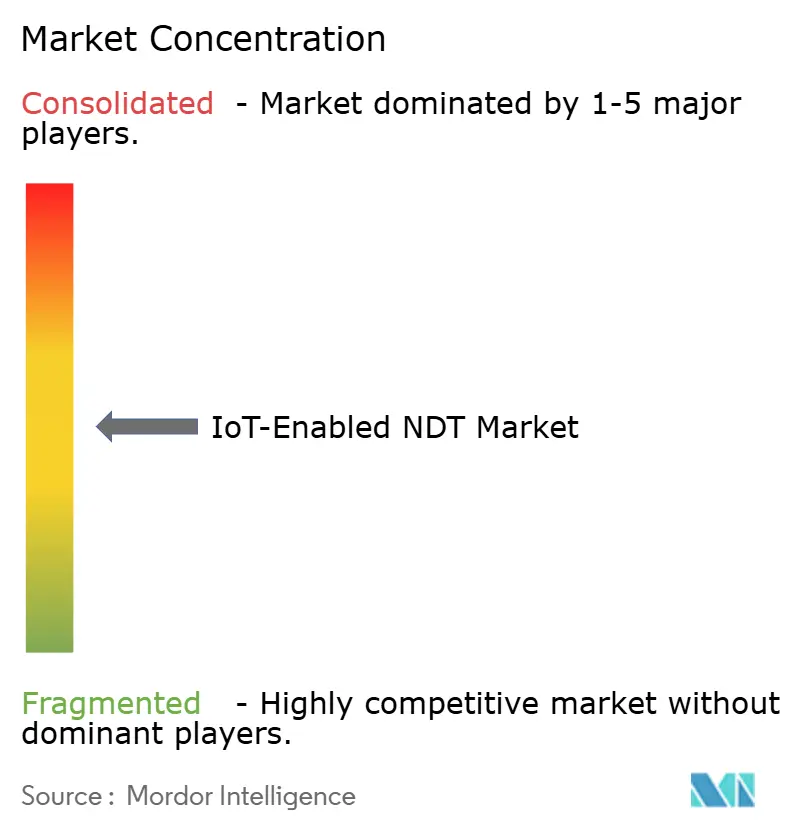
| Market Concentration | Medium |
Major Players *Disclaimer: Major Players sorted in no particular order Image © Mordor Intelligence. Reuse requires attribution under CC BY 4.0. | |
IoT-Enabled NDT Market Analysis by Mordor Intelligence
The IoT-enabled NDT market size is estimated at USD 4.31 billion in 2025 and is projected to reach USD 8.52 billion by 2030, registering a 14.6% CAGR. Expansion reflects the convergence of mandatory digitalization programs, edge-computing maturity, and the growing need for real-time defect detection that avoids production stoppages. Heightened regulatory focus on predictive maintenance in hazardous environments accelerates first-mover purchases, while private 5G rollouts shrink latency barriers and enable the deployment of massive sensor densities. Integrated cloud–edge frameworks lower the total cost of ownership, encouraging retrofit projects in brownfield facilities that previously relied on manual inspection rounds. At the same time, partnerships between legacy NDT manufacturers and hyperscale cloud providers enhance data interoperability, a long-standing challenge for operators managing multi-technology inspection fleets.
Key Report Takeaways
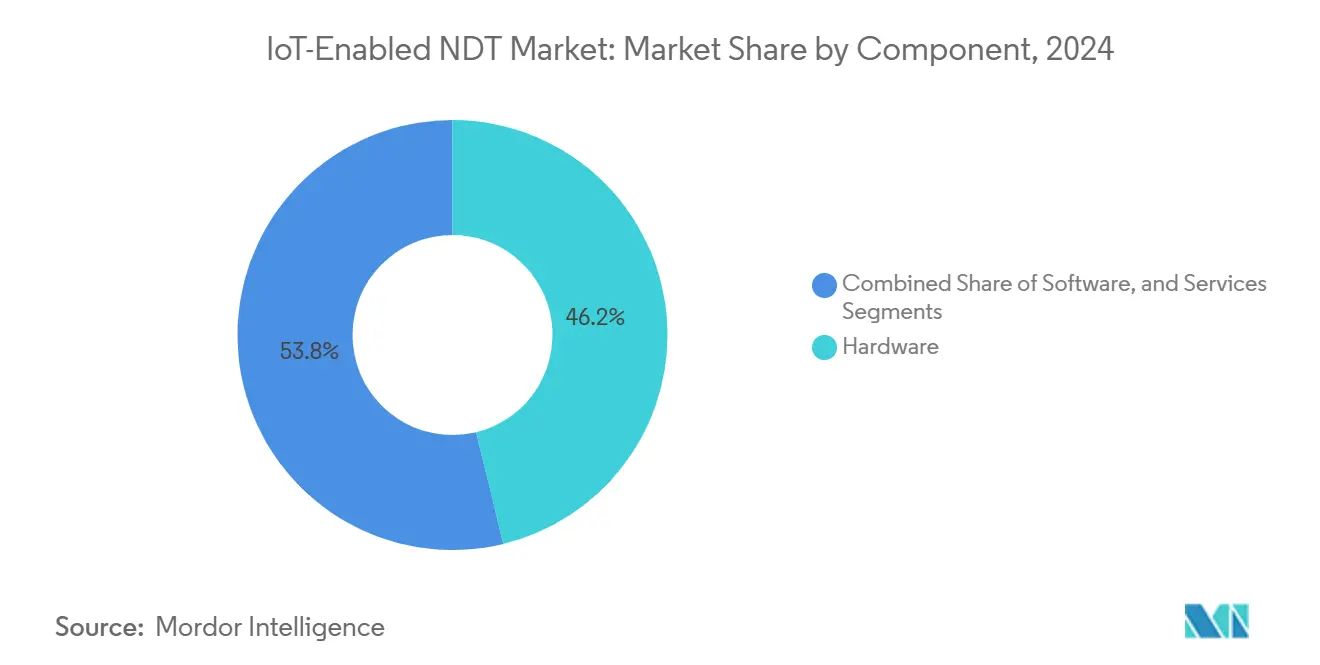
- By component, hardware contributed 46.2% of the IoT-enabled NDT market share in 2024, whereas services are projected to log a 16.4% CAGR through 2030.
- By testing method, ultrasonic testing is expected to lead the IoT-enabled NDT market, accounting for 28.3% of the market size in 2024. Meanwhile, eddy-current testing is forecasted to advance at a 19.3% CAGR through 2030.
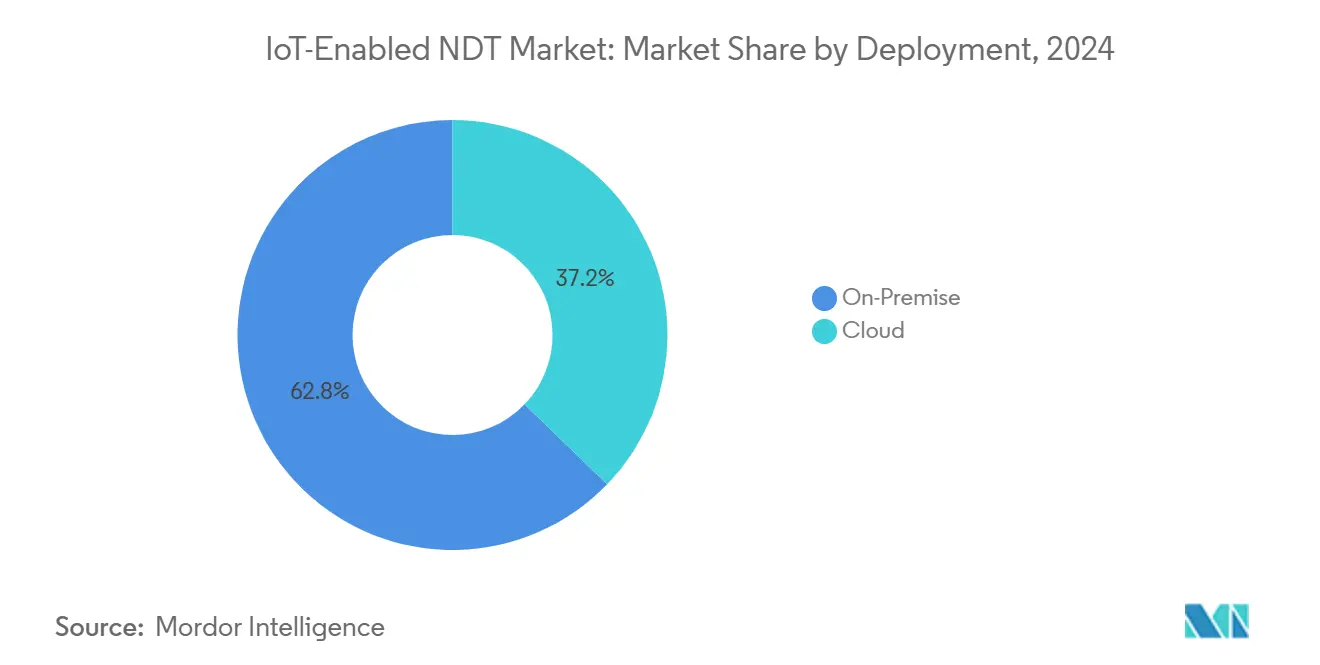
- By deployment, on-premise architectures accounted for 62.8% of the IoT-enabled NDT market size in 2024; however, cloud deployment is poised for the highest growth at a 19.7% CAGR over the same period.
- By end-user industry, the oil and gas sector dominated with a 24.6% IoT-enabled NDT market share in 2024, while the automotive and transportation sectors are projected to post an 18.9% CAGR through 2030.
- By geography, North America led with a 34.5% revenue share in 2024, and the Asia-Pacific region is projected to expand at a 15.8% CAGR through 2030.
Global IoT-Enabled NDT Market Trends and Insights
Drivers Impact Analysis*
| Driver | (~) % Impact on CAGR Forecast | Geographic Relevance | Impact Timeline |
|---|---|---|---|
| Proliferation of edge AI sensors | +2.8% | Global – early uptake in North America and Europe | Medium term (2-4 years) |
| Falling cost of cloud connectivity modules | +2.1% | Global – strongest boost in Asia-Pacific | Short term (≤ 2 years) |
| Mandates for remote asset integrity | +3.2% | North America and the Middle East – spreading offshore globally | Long term (≥ 4 years) |
| Transition to predictive maintenance | +2.9% | Global – accelerated in manufacturing hubs | Medium term (2-4 years) |
| Expansion of private 5G networks | +1.8% | North America and Europe – rolling out in Asia-Pacific | Long term (≥ 4 years) |
| Miniaturization of phased-array probes | +1.7% | Automotive and aerospace production centers worldwide | Medium term (2-4 years) |
| Source: Mordor Intelligence | |||
Proliferation of Edge AI Sensors Reducing Power Needs
Edge-based inference chips reduce energy consumption by up to 70% compared to cloud-dependent streaming, enabling multi-year battery life in offshore installations.[1]Fraunhofer Institute, “Edge AI Integration in Industrial Inspection Systems,” fraunhofer.de Self-learning algorithms continually adapt to material properties, enabling detection accuracy for weld defects to reach 95% while operating at a power consumption of less than 5 watts. These characteristics unlock continuous monitoring in hazardous or isolated assets where cabling is impractical and maintenance access is costly. Adoption also expands in mobility-constrained inspections, such as drone-mounted ultrasonic arrays surveying wind-turbine blades. Vendors now integrate neuromorphic processors directly onto probe heads, eliminating the need for separate edge gateways and simplifying deployment.
Falling Cost of Cloud Connectivity Modules
Module prices for NB-IoT and LTE-M radios fell 40% between 2022 and 2025, lowering retrofit barriers in price-sensitive brownfield plants. Affordable connectivity supports centralized analytics that consolidate multi-site inspection data, reducing local IT overhead. Satellite IoT links extend coverage to offshore rigs and desert mines, widening the addressable customer base beyond terrestrial networks. Case studies document 30% total cost-of-ownership savings when operators shift from standalone instruments to connected inspection fleets that receive firmware updates over the air. Equipment rental firms now bundle connectivity subscriptions within monthly fees, turning CapEx into predictable OpEx.
Mandates for Remote Asset Integrity in Hazardous Sites
Revised 2024 rules from the Pipeline and Hazardous Materials Safety Administration require continuous monitoring in high-consequence areas, making IoT-enabled NDT systems a compliance obligation rather than a discretionary upgrade.[2]Pipeline and Hazardous Materials Safety Administration, “Integrity Management Regulations Update,” phmsa.dot.gov Similar statutes in the North Sea and Gulf Cooperation Council nations embed remote asset integrity clauses in licensing rounds. For operators, regulatory certainty justifies multi-year contracts, removing budget volatility that historically stalled inspection projects. Supplier pipelines are tightening as procurement teams prioritize certified solutions that can deliver encrypted, real-time data to regulators, shifting the competitive landscape toward vendors with secure cloud integrations.
Transition from Time-Based to Predictive Maintenance Models
Manufacturers report 25% lower maintenance spend and 70% fewer unexpected failures after replacing calendar-based inspections with condition-monitored strategies enabled by streaming NDT data. Continuous data feeds fuel machine-learning models that preemptively flag degradation trends, allowing maintenance during planned downtimes. Greater process visibility reduces spare-part inventories and boosts overall equipment effectiveness, compelling finance departments to back IoT rollouts. The cultural shift elevates NDT from a regulatory checkbox to an operational profit lever, aligning inspection budgets with production-efficiency metrics.
Restraints Impact Analysis*
| Restraint | (~) % Impact on CAGR Forecast | Geographic Relevance | Impact Timeline |
|---|---|---|---|
| Cybersecurity vulnerabilities in legacy NDT | −1.9% | Global – acute in critical infrastructure | Short term (≤ 2 years) |
| Interoperability gaps across vendors | −1.4% | Global – multi-vendor industrial environments | Medium term (2-4 years) |
| High initial CAPEX for brownfield retrofit | −2.3% | Emerging and mature economies with aging assets | Long term (≥ 4 years) |
| Limited bandwidth in offshore settings | −1.1% | Remote oil and gas, deep-sea mining | Medium term (2-4 years) |
| Source: Mordor Intelligence | |||
Cyber-Security Vulnerabilities in Legacy NDT Devices
Sixty percent of installed analog probes show exploitable flaws once network adapters are fitted, creating new attack surfaces in pipelines, refineries, and power stations. Remediation requires secure boot, encrypted firmware, and role-based access controls, which older microcontrollers cannot support. Asset owners in nuclear and defense supply chains often retain air-gapped policies, delaying IoT migrations until certified hardening kits become available. Insurance premiums for cyber-induced outages increased in 2025, prompting operators to accelerate device replacements while straining their capital budgets.
Inter-Operability Gaps Across Vendor Ecosystems
Fragmented data schemas require operators to maintain parallel dashboards for ultrasonic, eddy-current, and thermography results, thereby limiting their ability to gain holistic insights into asset health.[3]IEEE Standards Association, “Industrial IoT Interoperability Standards,” ieee.org Custom middleware bridges inflate project timelines and complicate long-term maintenance. Although the OPC UA for Field eXchange working group promises common semantics, proprietary extensions remain prevalent as suppliers defend intellectual property. Customers increasingly stipulate open-API compliance in tenders, encouraging joint ventures between sensor makers and cloud platforms that can present unified data lakes.
*Our forecasts treat driver/restraint impacts as directional, not additive. The impact forecasts reflect baseline growth, mix effects, and variable interactions.
Segment Analysis
By Component – Services Emerge as the Growth Accelerator
Services are projected to hold a 16.4% CAGR to 2030 as operators shift from device ownership to performance-based contracts, in which vendors guarantee defect-detection thresholds. Hardware remains the largest revenue source, but multi-functional probes with longer lifespans temper the need for replacement cycles. Inspection-as-a-service offerings combine sensor leasing, periodic calibration, and 24/7 analytics support, moving risk from plant engineers to specialized providers. Smaller manufacturers embrace this model because it converts unpredictable maintenance into fixed monthly charges and provides access to scarce NDT expertise. Vendors enhance margins by layering artificial-intelligence subscriptions atop basic monitoring fees, creating sticky recurring revenue streams that offset hardware commoditization.
Digital twins further deepen service consumption, as real-time inspection data populates simulation models that forecast asset fatigue. The resulting insights back warranty extensions, a value proposition that operators monetarily reward. Training services delivered through augmented-reality headsets shorten learning curves for on-site technicians and generate ancillary income for OEMs. In regulated industries, third-party verification services remain crucial, ensuring that predictive analytics outputs align with the requirements of certification authorities. The IoT-enabled NDT market benefits from this ecosystem because each additional service layer enlarges lifetime contract value while fortifying vendor-client relationships.


By Testing Method – Eddy-Current Testing Accelerates Through Miniaturization
Ultrasonic testing accounted for 28.3% of 2024 revenue, underscoring its versatility across various materials, including metals, composites, and welds. However, eddy-current testing’s 19.3% CAGR reflects breakthroughs in printed-circuit coils that shrink probe footprints and permit high-speed inline checks on automotive stamping lines. Portable radiographic systems face licensing hurdles related to radiation safety, which slows their adoption in densely populated manufacturing corridors. Visual inspection is evolving rapidly as convolutional neural network algorithms classify defects within milliseconds, reducing operator subjectivity.
Thermography is gaining traction for live electrical panels because it detects hot spots without physical contact, thereby minimizing downtime and potential hazards. Acoustic-emission sensors widen maintenance windows for wind-turbine blades by catching micro-cracks before they propagate. Computed tomography, although still cost-intensive, is now utilized in additive-manufacturing quality assurance, particularly for internal geometries that are inaccessible to surface techniques. Across these modalities, standardized APIs enable data fusion, allowing for cross-validation that boosts detection confidence. The proliferating method mix raises overall demand for integrated software capable of prioritizing alerts based on combined probability metrics.
By Deployment – Cloud Momentum Builds on Scalability and Analytics Depth
On-premise setups remain dominant due to latency-sensitive control loops and stringent data-sovereignty policies, yet cloud deployments are growing at a 19.7% CAGR as bandwidth upgrades proliferate. Edge gateways preprocess high-volume ultrasonic waveforms locally, forwarding only compressed analytics to the cloud —a strategy that balances response time with storage efficiency. Multi-tenant cloud environments enable mid-sized plants to leverage enterprise-grade AI without incurring significant infrastructure costs.
Regulatory bodies increasingly accept encrypted cloud storage for inspection logs, eliminating a previous deal-breaker in heavily audited industries. Cloud–native microservices rapidly incorporate new algorithms, thereby shortening innovation cycles compared to firmware-locked edge devices. Vendors monetarily benefit from subscription pricing that smooths revenue and funds continuous feature releases. Disaster-recovery capabilities inherent in hyperscale infrastructure further sway critical-asset owners toward cloud adoption. As a result, the IoT-enabled NDT market is witnessing a shift in evaluation criteria from upfront hardware costs to lifetime analytic value.
By End-User Industry – Automotive Leads Growth, Oil and Gas Holds Scale
Oil and gas retained a 24.6% share in 2024 due to the constant need for pipeline networks and offshore platforms to maintain structural integrity under strict regulatory oversight. The automotive and transportation segment, however, charts the highest 18.9% CAGR, fueled by electric-vehicle battery production lines that require defect-free welds and adhesive bonds. Aerospace continues to invest in composite inspection to meet airworthiness directives, while power utilities utilize continuous ultrasonic and thermographic scans to extend the life of aging steam turbines.
Defensive industries deploy encrypted wireless probes in munition factories, prioritizing zero sparks and electromagnetic compatibility. Construction firms embed passive acoustic sensors in new bridges, aligning with smart-city resilience goals. Semiconductor fabs utilize laser ultrasonics for wafer inspection, aiming for nanometer-level precision. Mining companies utilize ruggedized IoT probes that withstand vibration and dust, feeding centralized analytics centers located hundreds of miles away. Each vertical’s unique operating constraints spur tailored solution packages, broadening revenue channels for providers that maintain versatile product families.
Geography Analysis
North America contributed 34.5% of 2024 revenue, primarily driven by the United States, where updated pipeline-integrity statutes mandate continuous monitoring. Private 5G networks inside aerospace assembly halls support burst uploads of high-resolution radiographic images, improving quality-control takt times. Canada’s oil-sands operators deploy edge-AI probes that can tolerate sub-zero temperatures, ensuring continuous inspection during the winter months. Regional academic-industry consortia accelerate technology transfer, securing domestic supply chains for mission-critical sensors.
The Asia-Pacific region is expected to record a 15.8% CAGR through 2030, as mega-infrastructure programs in China and India incorporate IoT inspection from the blueprint stages. Smart-factory subsidies in South Korea and Thailand drive early adoption among Tier-1 automotive suppliers. Japanese utilities retrofit ultrasonic arrays onto aging dams and tunnels, reflecting national resilience mandates. Australia’s remote LNG facilities rely on satellite-linked devices to overcome patchy terrestrial networks, illustrating how regional geography shapes deployment architectures.
Europe maintains momentum through stringent environmental statutes that compel real-time detection of emissions and leaks across chemical corridors. Germany’s Industrie 4.0 road-map provides tax incentives for cloud analytics, while France pilots hydrogen pipeline projects monitored by fiber-optic acoustic sensors. The European Union’s Industrial Data Act clarifies cross-border data sharing, eliminating compliance ambiguity that once slowed cloud migration. The Middle East and Africa utilize IoT-enabled NDT to mitigate sand-induced corrosion in desert pipelines, while South American miners employ solar-powered probes to monitor tailings dams located high in the Andes, underscoring the technology’s adaptability across diverse climates.

Competitive Landscape
The market remains moderately fragmented, yet consolidation is accelerating as equipment makers partner with cloud hyperscalers to integrate hardware, software, and analytics into a single offering. Olympus’s acquisition of Novosound adds MEMS-based transducers to its portfolio, enabling lighter probes that are well-suited for drone inspections. Eddyfi’s USD 45 million capacity expansion adds automated clean-room lines for miniaturized phased-array sensors, positioning the firm to meet just-in-time demands from automotive clients.[4]Eddyfi Technologies, “Manufacturing Expansion Announcement,” eddyfi.com
Waygate Technologies wins multi-year pipeline contracts by bundling encrypted edge gateways with Microsoft-Azure-hosted dashboards, illustrating the rising value of cybersecurity certifications. Mistras guides customers to its cloud platform through freemium AI licenses that convert to paid tiers after demonstrating significant reductions in downtime. Drone specialists such as Skyspecs secure capital inflows, signaling investor confidence in aerial inspection models that complement ground-based techniques.
Patent filings concentrate on piezoelectric-film probes, self-powered vibration harvesters, and AI-optimized waveform inversion, underscoring a race to differentiate beyond mere connectivity. Vendors that offer open-API access increasingly win competitive bids as operators prioritize ecosystem flexibility over single-source lock-in. The trend nudges traditional instrument makers into software partnerships or outright mergers, reshaping the competitive chessboard over the forecast horizon.
IoT-Enabled NDT Industry Leaders
Eddyfi Technologies Inc.
Waygate Technologies GmbH
Zetec Inc.
Olympus Corporation
MISTRAS Group Inc.
- *Disclaimer: Major Players sorted in no particular order

Recent Industry Developments
- September 2025: Eddyfi Technologies announced a USD 45 million expansion of its manufacturing facility in Quebec, Canada, to increase production capacity for IoT-enabled phased array probes by 200%.
- August 2025: Olympus Corporation completed the acquisition of Novosound Ltd. for USD 85 million, gaining access to advanced ultrasonic sensor technologies and AI-powered defect classification algorithms.
- July 2025: Waygate Technologies secured a USD 120 million contract with a major oil and gas operator to provide comprehensive pipeline integrity monitoring services across 2,000 kilometers of offshore infrastructure.
- June 2025: MISTRAS Group launched its new cloud-based predictive analytics platform, integrating machine-learning algorithms with real-time inspection data from IoT-enabled sensors.


Global IoT-Enabled NDT Market Report Scope
| Hardware |
| Software |
| Services |
| Ultrasonic Testing |
| Radiographic Testing |
| Magnetic Particle Testing |
| Liquid Penetrant Testing |
| Visual Inspection Testing |
| Eddy-Current Testing |
| Acoustic Emission Testing |
| Thermography / Infrared Testing |
| Computed Tomography Testing |
| On-Premise |
| Cloud |
| Oil and Gas |
| Power Generation |
| Aerospace |
| Defense |
| Automotive and Transportation |
| Manufacturing and Heavy Engineering |
| Construction and Infrastructure |
| Chemical and Petrochemical |
| Marine and Ship Building |
| Electronics and semiconductor |
| Mining |
| Medical Devices |
| Others |
| North America | United States | |
| Canada | ||
| Mexico | ||
| South America | Brazil | |
| Argentina | ||
| Rest of South America | ||
| Europe | Germany | |
| United Kingdom | ||
| France | ||
| Italy | ||
| Spain | ||
| Rest of Europe | ||
| Asia Pacific | China | |
| Japan | ||
| India | ||
| South Korea | ||
| South-East Asia | ||
| Rest of Asia Pacific | ||
| Middle East and Africa | Middle East | Saudi Arabia |
| United Arab Emirates | ||
| Turkey | ||
| Rest of Middle East | ||
| Africa | South Africa | |
| Nigeria | ||
| Rest of Africa | ||
| By Component | Hardware | ||
| Software | |||
| Services | |||
| By Testing Method | Ultrasonic Testing | ||
| Radiographic Testing | |||
| Magnetic Particle Testing | |||
| Liquid Penetrant Testing | |||
| Visual Inspection Testing | |||
| Eddy-Current Testing | |||
| Acoustic Emission Testing | |||
| Thermography / Infrared Testing | |||
| Computed Tomography Testing | |||
| By Deployment | On-Premise | ||
| Cloud | |||
| By End-user Industry | Oil and Gas | ||
| Power Generation | |||
| Aerospace | |||
| Defense | |||
| Automotive and Transportation | |||
| Manufacturing and Heavy Engineering | |||
| Construction and Infrastructure | |||
| Chemical and Petrochemical | |||
| Marine and Ship Building | |||
| Electronics and semiconductor | |||
| Mining | |||
| Medical Devices | |||
| Others | |||
| By Geography | North America | United States | |
| Canada | |||
| Mexico | |||
| South America | Brazil | ||
| Argentina | |||
| Rest of South America | |||
| Europe | Germany | ||
| United Kingdom | |||
| France | |||
| Italy | |||
| Spain | |||
| Rest of Europe | |||
| Asia Pacific | China | ||
| Japan | |||
| India | |||
| South Korea | |||
| South-East Asia | |||
| Rest of Asia Pacific | |||
| Middle East and Africa | Middle East | Saudi Arabia | |
| United Arab Emirates | |||
| Turkey | |||
| Rest of Middle East | |||
| Africa | South Africa | ||
| Nigeria | |||
| Rest of Africa | |||


Key Questions Answered in the Report
How large is the IoT-enabled NDT market in 2025?
The IoT-enabled NDT market size is projected to reach USD 4.31 billion by 2025.
What is the expected growth rate for IoT-based non-destructive testing solutions?
The market is forecast to expand at a 14.6% CAGR between 2025 and 2030.
Which region shows the fastest growth for connected NDT technologies?
Asia-Pacific leads growth with a projected 15.8% CAGR through 2030.
Which testing method is growing the quickest?
Eddy-current testing is projected to post the highest CAGR at 19.3% due to probe miniaturization.
Why are services gaining momentum compared with hardware sales?
Operators favor outcome-based contracts that bundle devices, analytics, and expertise, driving a 16.4% CAGR for services.
What are the main cybersecurity challenges for IoT-enabled NDT implementations?
Legacy probes lack encryption and secure boot, exposing facilities to vulnerabilities that require costly mitigation.
Page last updated on:


