Pipeline Integrity NDT Market Size and Share
Market Overview
| Study Period | 2019 - 2030 |
|---|---|
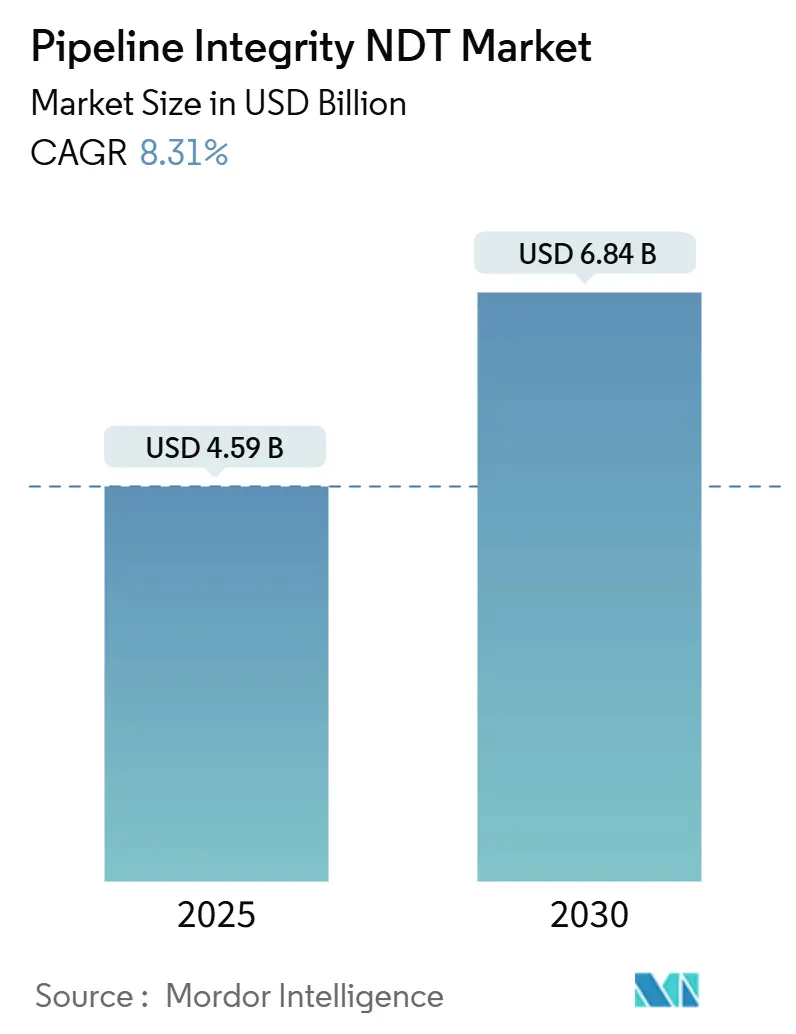
| Market Size (2025) | USD 4.59 Billion |
| Market Size (2030) | USD 6.84 Billion |
| Growth Rate (2025 - 2030) | 8.31% CAGR |
| Fastest Growing Market | Asia Pacific |
| Largest Market | North America |
| Market Concentration | Medium |
Major Players *Disclaimer: Major Players sorted in no particular order Image © Mordor Intelligence. Reuse requires attribution under CC BY 4.0. | |
Pipeline Integrity NDT Market Analysis by Mordor Intelligence
The pipeline integrity NDT market size is estimated to be USD 4.59 billion in 2025 and is projected to increase to USD 6.84 billion by 2030, growing at an 8.31% CAGR. The modernization of mid-century pipeline networks, stringent safety codes, and rapid digitization are fueling this expansion. North America maintains high demand as operators confront end-of-life assets, while the Asia-Pacific region drives double-digit growth by integrating monitoring capabilities into new gas corridors. Technology suppliers are accelerating innovation around non-contact ultrasonic and electromagnetic acoustic transducer (EMAT) platforms, helping operators reduce downtime and increase detection accuracy. Service providers, in parallel, invest in cloud analytics that transform raw inspection data into predictive insights, trimming maintenance budgets and improving risk ranking across entire grids. Competitive dynamics remain balanced, yet capital-intensive robotics, technician shortages, and patchwork regulations continue to threaten roll-out schedules.
Key Report Takeaways
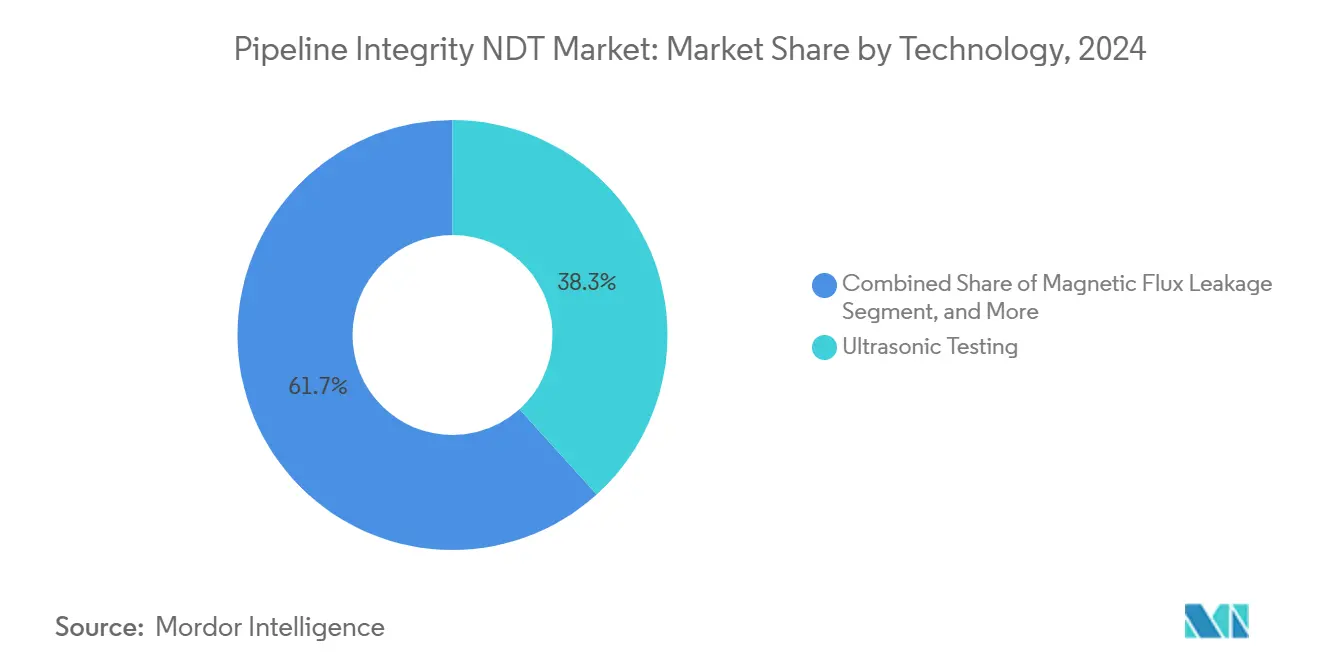
- By technology, ultrasonic testing led the pipeline integrity NDT market with a 38.3% market share in 2024, while EMAT is forecasted to rise at a 10.6% CAGR through 2030.
- By service type, inspection services accounted for 45.7% of the pipeline integrity NDT market size in 2024, whereas data management and analytics are projected to expand at a 14.6% CAGR to 2030.
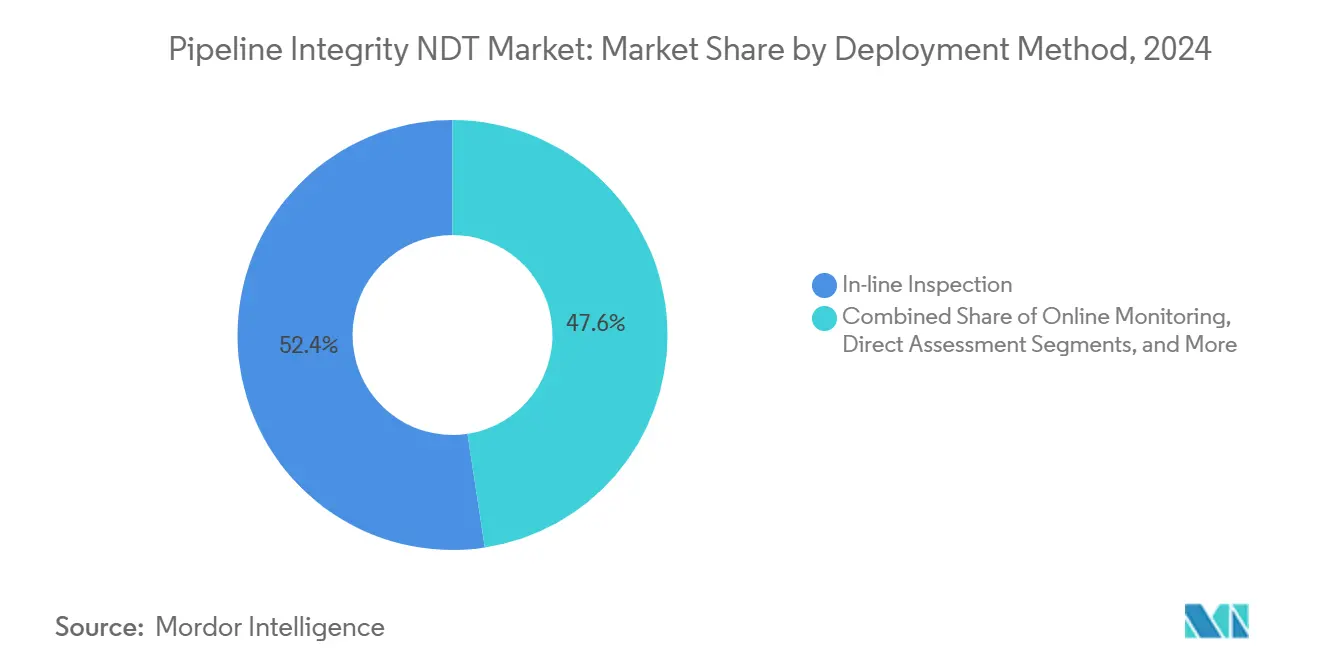
- By deployment method, in-line inspection dominated the market, accounting for a 52.4% revenue share in 2024. Drone-based inspection is expected to post the fastest CAGR of 13.8% between 2025 and 2030.
- By end-user, oil and gas pipelines held 48.6% of the pipeline integrity NDT market share in 2024, while water and wastewater assets are anticipated to grow at an 11.4% CAGR through 2030.
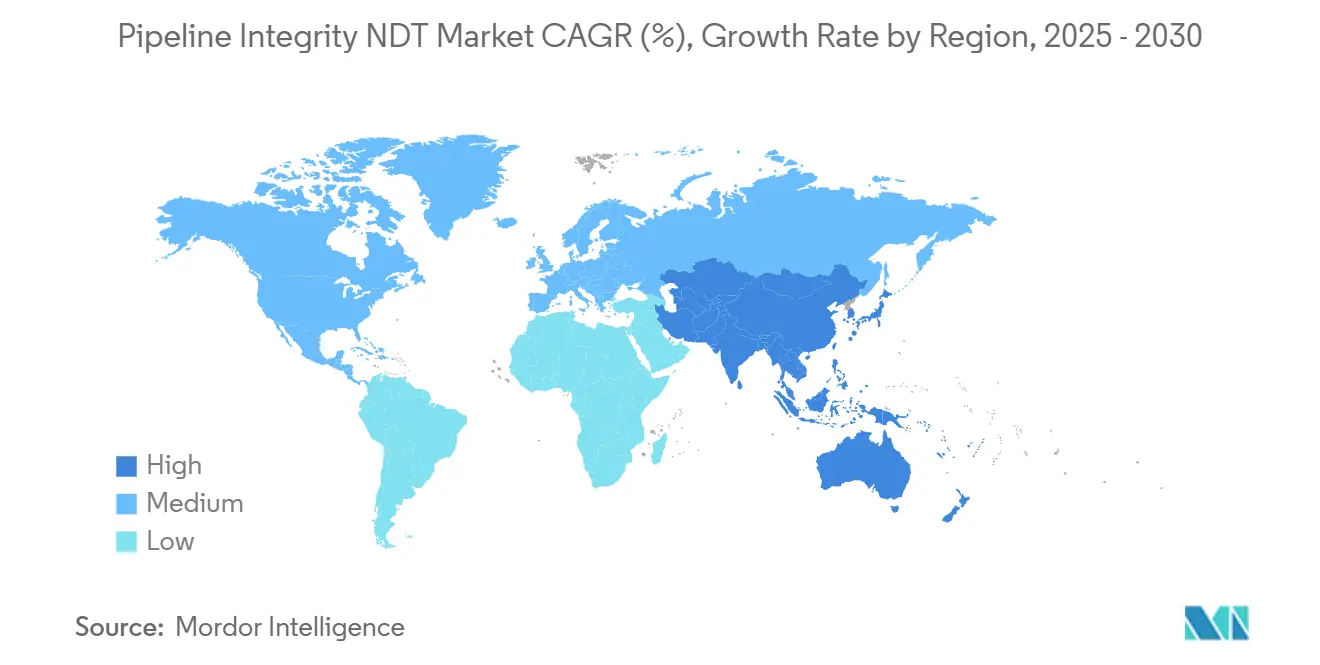
- By geography, North America accounted for 39.4% of global revenue in 2024; the Asia-Pacific region is projected to register the strongest CAGR of 10.4% over the forecast period.
Global Pipeline Integrity NDT Market Trends and Insights
Drivers Impact Analysis*
| Driver | (~) % Impact on CAGR Forecast | Geographic Relevance | Impact Timeline |
|---|---|---|---|
| Accelerated adoption of high-pressure gas pipelines | +2.1% | North America and Europe | Medium term (2-4 years) |
| Rising regulatory mandates on aging pipeline infrastructure | +1.8% | North America, Europe, Asia-Pacific | Long term (≥ 4 years) |
| Transition to hydrogen blends and the need for material assessment | +1.5% | Europe, Asia-Pacific, North America | Long term (≥ 4 years) |
| Digitization-driven demand for real-time anomaly detection | +1.3% | Global | Medium term (2-4 years) |
| Expansion of subsea pipelines in deep-water projects | +0.9% | Middle East, North Sea, Gulf of Mexico, Asia-Pacific | Medium term (2-4 years) |
| Venture capital funding into NDT robotics startups | +0.7% | North America, Europe, Asia-Pacific | Short term (≤ 2 years) |
| Source: Mordor Intelligence | |||
Accelerated Adoption of High-Pressure Gas Pipelines
Gas transmission lines operating above 1,000 psi require more sophisticated inspection modalities. Operators increasingly select EMAT tools because they function without couplants, which can become unstable under extreme pressure gradients. PHMSA rules adopted in 2024 require more frequent surveys of lines exceeding 1,440 psi, resulting in a measurable increase in service orders.[1]U.S. Pipeline and Hazardous Materials Safety Administration, “Pipeline Safety: Enhanced Inspection Requirements for High-Pressure Gas Transmission Systems,” Federal Register, phmsa.dot.gov European grid owners also report inspection costs that are 23% higher for high-pressure segments, yet they recoup these outlays within eighteen months through extended maintenance intervals. Advanced X80-X100 steel grades demand higher-frequency ultrasonic probes, steering procurement toward next-generation platforms. Together, these factors lift the pipeline integrity NDT market CAGR by roughly 2.1%.
Rising Regulatory Mandates on Aging Pipeline Infrastructure
More than 65% of U.S. gas transmission pipelines are expected to have surpassed 40 years of service by 2024, and similar patterns are anticipated across Europe. New directives now link inspection schedules to environmental and safety consequences rather than just elapsed time, spurring risk-based maintenance programs. Canada likewise tightened review triggers as 50-year vintages emerge across Alberta and British Columbia. Parallel rules for municipal water assets in California and Texas widen the regulatory net beyond energy pipelines, boosting addressable demand. Regulators’ insistence on quantified integrity proofs underpins roughly 1.8% of the forecast CAGR.
Transition to Hydrogen Blends and Need for Material Assessment
Hydrogen molecules diffuse rapidly into steel, thereby increasing the propensity for cracking. Pilot projects, such as the Netherlands’ HyDelta, have confirmed the need to shorten inspection cycles by up to 60% when blend ratios exceed 10%.[2]Netherlands Enterprise Agency, “HyDelta Hydrogen Infrastructure Demonstration Project: NDT Requirements Assessment,” rvo.nl Germany’s hydrogen backbone plan envisions 9,700 km of pipe by 2030, requiring inspection modalities capable of capturing sub-millimeter defects in embrittled metal. ISO 16111:2024 codifies such procedures, encouraging technology upgrades from phased-array ultrasonics to guided wave systems tuned for hydrogen. This emerging segment contributes about 1.5% of growth for the pipeline integrity NDT market.
Digitization-Driven Demand for Real-Time Anomaly Detection
Cloud analytics and IoT sensors convert traditional point-in-time inspections into continuous integrity monitoring. Baker Hughes reported a 28% revenue increase in digital pipeline solutions for 2024, reflecting an operator's appetite for predictive insights. Updated API 1160 now compels linkage between inspection output and enterprise asset systems. Machine-learning algorithms sift through terabytes of waveform data, flagging deviations that field crews might overlook. Operators report 25-30% fewer physical call-outs, yet record higher detection confidence, translating into a 1.3% tailwind for the pipeline integrity NDT market.
Restraints Impact Analysis*
| Restraint | (~) % Impact on CAGR Forecast | Geographic Relevance | Impact Timeline |
|---|---|---|---|
| Shortage of certified NDT technicians | −1.2% | North America and Europe | Long term (≥ 4 years) |
| High capital cost of advanced inspection tools | −0.9% | Global | Medium term (2-4 years) |
| Limited standardization across regional regulators | −0.6% | Global | Long term (≥ 4 years) |
| Data ownership concerns in cloud-based monitoring | −0.4% | North America, Europe, Asia-Pacific | Short term (≤ 2 years) |
| Source: Mordor Intelligence | |||
Shortage of Certified NDT Technicians
ASNT reported an 8% decline in Level II and Level III certificates since 2020, despite a 15% increase in inspection workload.[3]American Society for Nondestructive Testing, “Workforce Development Report: NDT Technician Certification Trends,” asnt.org Pipeline-specific upskilling has been ongoing for almost two years, and the average technician age in Europe now exceeds 48. Offshore projects magnify the shortfall because travel, safety, and pay premiums place smaller contractors at a disadvantage. Service firms respond by accelerating their robotics investments, yet talent scarcity still reduces their potential CAGR by roughly 1.2%.
High Capital Cost of Advanced Inspection Tools
State-of-the-art EMAT or phased-array pigging units often exceed USD 2 million per set. Rapid obsolescence, which occurs within five to seven years, rather than the decade or more typical of analog gear, raises the total cost of ownership. Smaller operators struggle to justify these outlays, except on high-risk lines, which narrows their supplier reach and trims growth by about 0.9%. Leasing options are evolving, but contract tenors rarely align with project length, creating cash-flow stress for regional vendors unable to amortize assets quickly.
*Our forecasts treat driver/restraint impacts as directional, not additive. The impact forecasts reflect baseline growth, mix effects, and variable interactions.
Segment Analysis
By Technology: Ultrasonic Testing Dominance Faces EMAT Disruption
Ultrasonic platforms held a 38.3% share of the pipeline integrity NDT market in 2024, driven by technician familiarity and standardized procedures. EMAT is closing the gap as its 10.6% CAGR outpaces legacy modalities, signaling operator preference for non-contact methods on rough-coated or high-pressure pipe. Magnetic flux leakage and guided wave tools fill niche ferromagnetic and long-range use cases. Digital radiography adoption is accelerating in weld verification because it reduces on-site exposure windows by 50%. Over the forecast horizon, automated crawlers equipped with EMAT heads are poised to redefine field productivity. The pipeline integrity NDT market size tied to EMAT alone is projected to exceed USD 1.1 billion by 2030, underscoring a shift in technology preference.
A second shift lies in real-time data output. Vendors embed edge processors on pigs to pre-filter gigabyte-scale datasets, lightning satellite backhaul costs for remote assets. Optical and laser methods, though still niche, deliver accurate wall-thickness readings on high-temperature lines where couplant would vaporize. Acoustic emission systems, as specified in ASME B31.8S-2024, complement an expanding toolkit, enabling operators to select modality mixes tailored to metallurgy, product, and location. Collectively, these advances maintain the integrity of the NDT pipeline market on a solid growth trajectory.


By Service Type: Inspection Services Lead While Analytics Surge
Traditional inspection retained 45.7% of the revenue in 2024 as the core workflow; however, data management and analytics are poised to be the breakout arena, with a 14.6% CAGR. Operators are increasingly contracting bundled campaigns, where vendors deliver inspection, analytics, and remedial action planning under a single purchase order, thereby compressing downtime. Predictive dashboards now estimate the remaining life of pipe sections with 5% accuracy, enabling just-in-time digs. Training and calibration fill capability gaps created by the technician shortage, with new facilities targeting 500 graduates yearly in Houston alone. For many independents, the decision to outsource analytics rather than build in-house teams offers an immediate cost-benefit.
The transformation shifts value toward intellectual property—algorithms and cloud platforms—rather than field labor. Vendors differentiate themselves on software usability, anomaly classification precision, and cybersecurity compliance. PRCI guidelines from 2024 encourage data standardization, fostering multi-operator benchmarking. As adoption scales, pipeline operators expect to slice inspection budgets by up to 15% without compromising safety. The pipeline integrity NDT industry is therefore shifting from a hardware-heavy model to a service-centric ecosystem centered on insight generation.
By Deployment Method: Drones Challenge In-Line Inspection Supremacy
In-line inspection tools, or pigs, still accounted for 52.4% of 2024 revenues, thanks to their ability to profile metal loss and cracking over thousands of kilometers in a single pass. However, drone-based surveys are projected to rise at a brisk 13.8% CAGR, enabled by updated FAA and EASA frameworks. Uncrewed aircraft scan above-ground lines and river crossings, feeding orthomosaic imagery into defect-detection software. Miniaturized EMAT and ultrasonic payloads extend their scope to lightly buried pipe. Online monitoring, which combines fixed sensors with monthly flyovers, forms a hybrid model that appeals to operators facing terrain or permitting barriers to pigging.
Remote monitoring over satellite networks closes data gaps in deserts and offshore fields. Direct assessment still plays a role where pig launchers are absent, yet it is declining as robotics becomes cost-competitive. The pipeline integrity NDT market size associated with drone deployments is expected to exceed USD 750 million by 2030, indicating a gradual shift in spending from pig fleets to aerial fleets. As autonomy increases, flight times stretch and per-kilometer survey costs fall, eroding the incumbent advantage of in-line technologies.
By End-User Industry: Water Infrastructure Drives Unexpected Growth
Oil and gas retained 48.6% of 2024 spending, affirming its status as the cornerstone customer group. Nonetheless, municipal water networks are the growth surprise, with 11.4% CAGR, fueled by American Rescue Plan allocations and stricter leak-loss caps. AWWA now prescribes NDT for mains laid prior to 1990, expanding the regulated universe by thousands of kilometers. Refinery and petrochemical operators continue to make a steady outlay on corrosion monitoring due to the high-temperature hydrogen attack risk.
Chemical and power generation users adopt advanced modalities for corrosive and high-pressure steam lines, respectively. Mining firms invest in slurry-pipeline diagnostics, a niche yet margin-rich segment. Across sectors, willingness to outsource end-to-end integrity programs favors vendors with broad modality portfolios. Such cross-industry adoption further embeds the pipeline integrity NDT market as an indispensable layer of critical-infrastructure stewardship.
Geography Analysis
North America accounted for 39.4% of 2024 revenue as operators comb through mid-century assets nearing design life limits. PHMSA’s tightened oversight and carbon-capture pipeline proposals ensure sustained spending. Canada’s mainline corridors, exposed to extreme cold, motivate the adoption of low-temperature EMAT sensors, while Mexico’s post-reform gas grid opens greenfield opportunities for multinational service providers.
Asia-Pacific is projected to log a 10.4% CAGR through 2030, powered by China’s quest to reach 163,000 km of gas pipelines and India’s USD 60 billion grid build-out. Regional governments, guided by APEC safety protocols[4]Asia-Pacific Economic Cooperation, “APEC Pipeline Safety Guidelines: Regional Standards for Integrity Management,” apec.org , embed integrity programs from day one, creating revenue streams centered on baseline surveys, guided wave screening, and drone patrols. Southeast Asian offshore gas discoveries also stimulate demand for subsea ultrasonic crawlers designed for depths of up to 3,000 meters.
Europe’s mature footprint wrestles with hydrogen transition. Operators redirect budgets to material compatibility checks and embrittlement surveillance, catalyzed by ISO 16111:2024. Germany’s hydrogen backbone requires bespoke inspections of converted natural-gas lines, while North Sea exporters retrofit subsea assets for ammonia carriage. Middle East and Africa post steady uptake, driven by offshore trunk line expansions in the Persian Gulf and East Africa. Collectively, these dynamics reinforce the global relevance of the pipeline integrity NDT market.

Competitive Landscape
The market shows moderate concentration. ROSEN Group, Baker Hughes, and T.D. Williamson leverages patented sensor arrays, global depots, and regulatory expertise to secure multi-year frame agreements. ROSEN’s magnetic flux leakage series underpins many pigging schedules, while Baker Hughes merges its legacy inspection suite with the newly acquired Pipeline Analytics algorithms to deliver end-to-end digital twins. T.D. Williamson differentiates through hot-tapping and plugging services that allow repairs without flow shutdowns.
Emerging players are harnessing AI and robotics to disrupt the field's economics. Venture funding topped USD 150 million in 2024, backing autonomous crawler startups and cloud-native anomaly-detection engines. Such entrants often target unserved water-utility clients where legacy vendors lack local presence. API 1163:2024 introduces performance-based qualifications that may cement share for incumbents who can meet rigorous proof-of-performance criteria across modalities.
Strategic collaborations shape future rivalry. Intertek partners with Microsoft Azure to fuse IoT telemetry into inspection workflows, while Mistras Group invests in technician academies to offset workforce aging. Suppliers of miniaturized EMAT boards strike OEM deals with drone makers to embed sensors at scale. Competitive intensity is therefore shifting from sheer equipment ownership toward data science depth, platform interoperability, and talent pipelines, elements now prized by asset owners.
Pipeline Integrity NDT Industry Leaders
Baker Hughes Company
Applus Services S.A.
MISTRAS Group Inc.
Eddyfi Technologies Inc.
NDT Global Ltd.
- *Disclaimer: Major Players sorted in no particular order

Recent Industry Developments
- September 2025: ROSEN Group invested USD 75 million in autonomous inspection robotics aimed at hazardous pipeline environments.
- August 2025: Baker Hughes acquired Pipeline Analytics Corporation for USD 180 million, deepening its machine-learning portfolio.
- July 2025: T.D. Williamson launched SmartPig 4.0, integrating EMAT and ultrasonic probes to cut run times by 40%.
- June 2025: NDT Global secured a USD 120 million, five-year integrity deal with Enbridge for 4,800 km of the Canadian Mainline.


Global Pipeline Integrity NDT Market Report Scope
| Ultrasonic Testing |
| Infra-red Thermography |
| Visual (High-Res / AI) |
| Shearography |
| Acoustic Emission |
| Eddy Current |
| Drone-Based Systems |
| Robotic Climbers |
| Rope-Access Teams with Portable NDT |
| Ground-Based Imaging Towers |
| Embedded Sensor Networks |
| Wind Turbine Blades |
| Solar Heliostat / Mirror Blades |
| Onshore Wind |
| Offshore Wind |
| Utility-Scale Solar |
| Distributed Solar |
| North America | United States | |
| Canada | ||
| Mexico | ||
| South America | Brazil | |
| Argentina | ||
| Rest of South America | ||
| Europe | Germany | |
| United Kingdom | ||
| France | ||
| Italy | ||
| Spain | ||
| Rest of Europe | ||
| Asia Pacific | China | |
| Japan | ||
| India | ||
| South Korea | ||
| South-East Asia | ||
| Rest of Asia Pacific | ||
| Middle East and Africa | Middle East | Saudi Arabia |
| United Arab Emirates | ||
| Turkey | ||
| Rest of Middle East | ||
| Africa | South Africa | |
| Nigeria | ||
| Rest of Africa | ||
| By Inspection Technique | Ultrasonic Testing | ||
| Infra-red Thermography | |||
| Visual (High-Res / AI) | |||
| Shearography | |||
| Acoustic Emission | |||
| Eddy Current | |||
| By Inspection Platform | Drone-Based Systems | ||
| Robotic Climbers | |||
| Rope-Access Teams with Portable NDT | |||
| Ground-Based Imaging Towers | |||
| Embedded Sensor Networks | |||
| By Asset Type | Wind Turbine Blades | ||
| Solar Heliostat / Mirror Blades | |||
| By Application | Onshore Wind | ||
| Offshore Wind | |||
| Utility-Scale Solar | |||
| Distributed Solar | |||
| By Geography | North America | United States | |
| Canada | |||
| Mexico | |||
| South America | Brazil | ||
| Argentina | |||
| Rest of South America | |||
| Europe | Germany | ||
| United Kingdom | |||
| France | |||
| Italy | |||
| Spain | |||
| Rest of Europe | |||
| Asia Pacific | China | ||
| Japan | |||
| India | |||
| South Korea | |||
| South-East Asia | |||
| Rest of Asia Pacific | |||
| Middle East and Africa | Middle East | Saudi Arabia | |
| United Arab Emirates | |||
| Turkey | |||
| Rest of Middle East | |||
| Africa | South Africa | ||
| Nigeria | |||
| Rest of Africa | |||


Key Questions Answered in the Report
What is the size of the global pipeline integrity NDT market in 2025?
The market is valued at USD 4.59 billion in 2025 and is projected to reach USD 6.84 billion by 2030.
Which region grows fastest in pipeline integrity NDT?
Asia-Pacific is expected to post the strongest 10.4% CAGR through 2030 on the back of massive gas-grid build-outs.
What technology segment is gaining momentum?
EMAT solutions drive technology growth with a forecasted 10.6% CAGR, owing to their non-contact inspection advantage.
Why are water utilities adopting pipeline integrity NDT?
Aging municipal mains and tighter leak-loss rules drive an 11.4% CAGR for NDT services in water and wastewater pipelines.
What is the main barrier to market growth?
An industry-wide shortage of certified technicians subtracts approximately 1.2 percentage points from the potential CAGR, despite advances in automation.
Page last updated on:


