Securities Brokerage Market Size and Share
Market Overview
| Study Period | 2020 - 2031 |
|---|---|
| Market Size (2026) | USD 1.91 Trillion |
| Market Size (2031) | USD 2.85 Trillion |
| Growth Rate (2026 - 2031) | 8.34% CAGR |
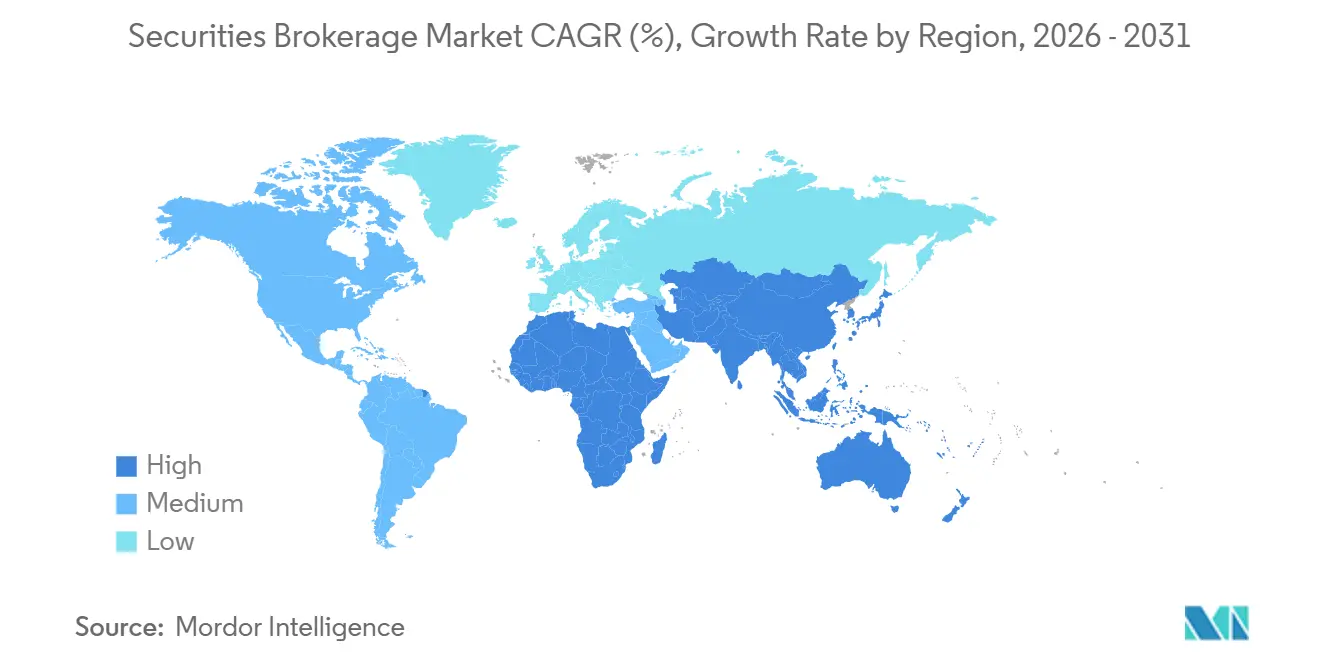
| Fastest Growing Market | Asia-Pacific |
| Largest Market | North America |
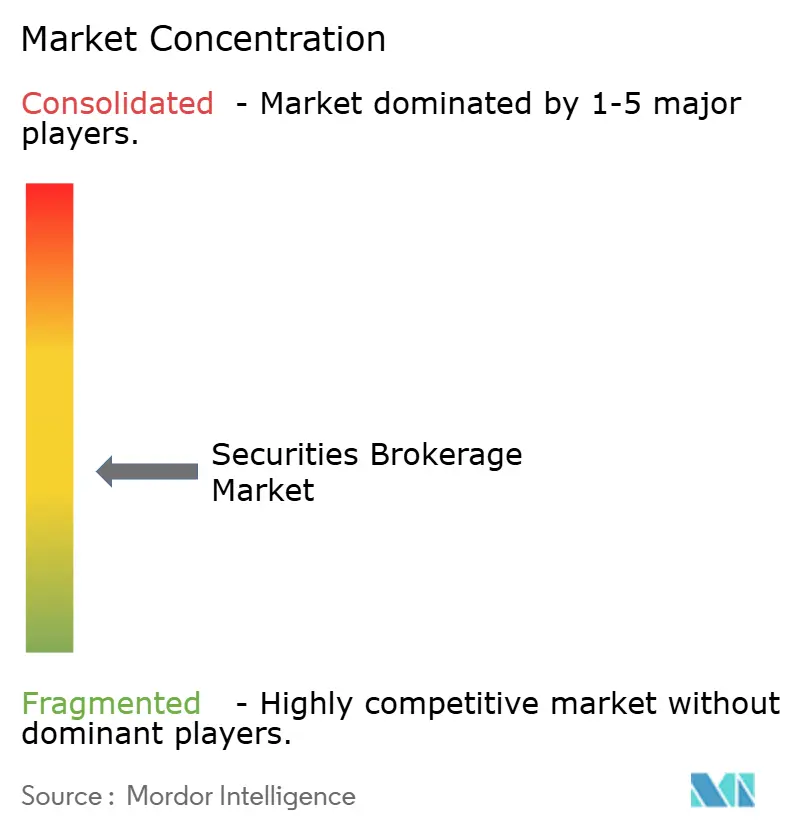
| Market Concentration | Medium |
Major Players *Disclaimer: Major Players sorted in no particular order Image © Mordor Intelligence. Reuse requires attribution under CC BY 4.0. | |
Securities Brokerage Market Analysis by Mordor Intelligence
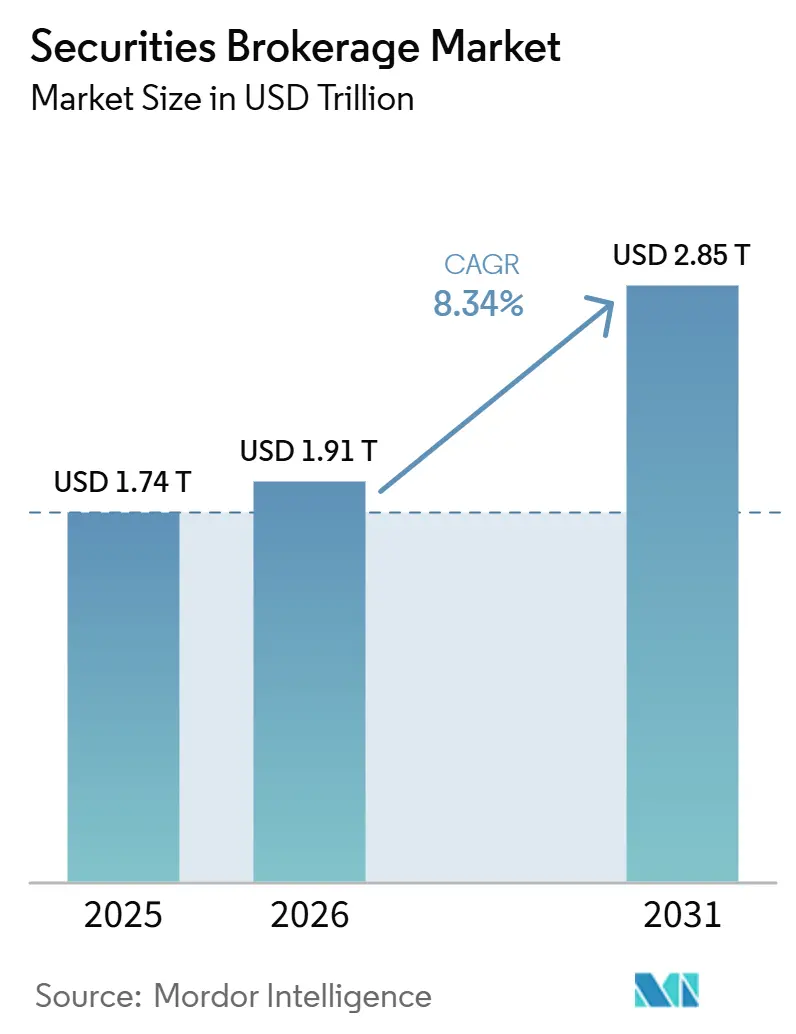
The Securities Brokerage Market size is projected to expand from USD 1.74 trillion in 2025 and USD 1.91 trillion in 2026 to USD 2.85 trillion by 2031, registering a CAGR of 8.34% between 2026 to 2031.
The securities brokerage market is moving higher as digital execution, mobile trading, and lower entry costs continue to widen access across retail and institutional channels. Trading depth has remained strong, with average daily dollar volume of exchange-listed United States equity securities reaching USD 828 billion in 2025, which shows the scale of activity flowing through brokerage platforms. The securities brokerage market is also shifting toward fee-based and advisory income as firms rely less on trade commissions and place more weight on recurring client relationships. North America remains the largest revenue pool, while Asia-Pacific is set to expand faster as account penetration, digital onboarding, and local platform development continue to rise. Competitive pressure remains uneven across the securities brokerage market, with scale and balance sheet strength still mattering most in prime brokerage, while mid-tier and digital platforms compete more directly on pricing, product breadth, and user experience.
Key Report Takeaways
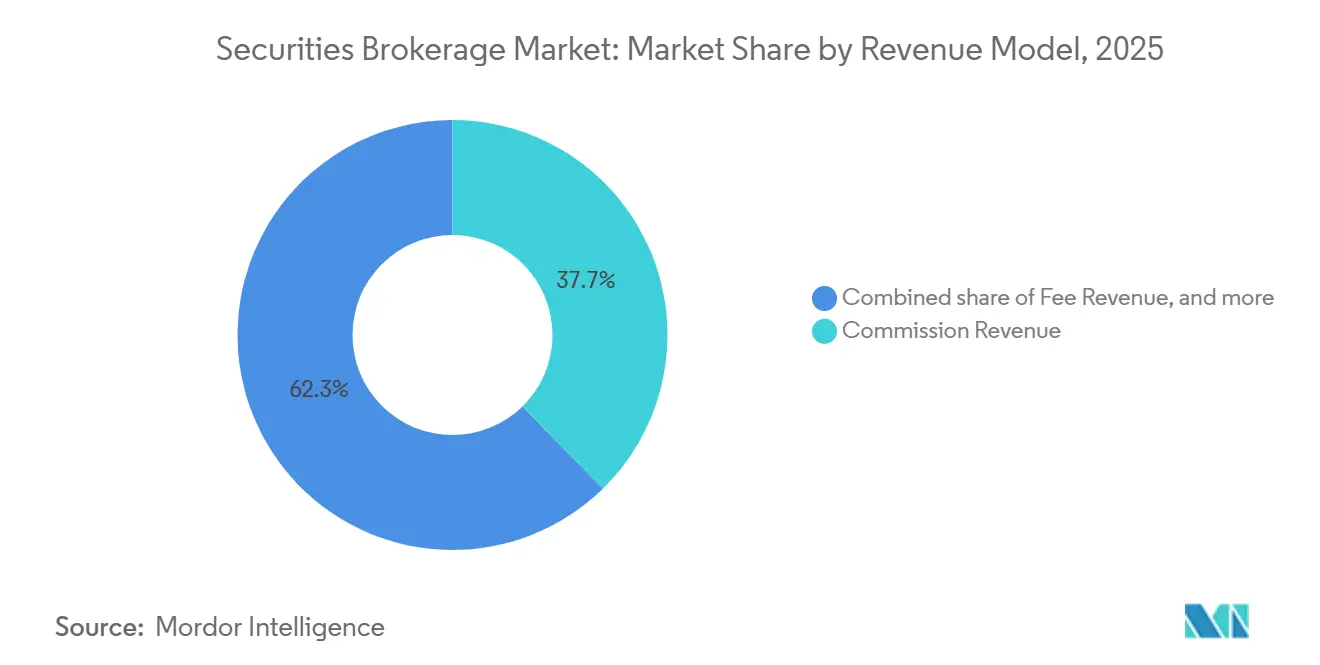
- By revenue model, commission revenue held 37.67% of the securities brokerage market share in 2025, while fee revenue is forecast to grow at 10.82% through 2031.
- By client type, institutional investors held 56.43% of the securities brokerage market share in 2025, while retail investors are projected to grow at 9.71% CAGR through 2031.
- By service model, full-service brokerage accounted for 44.96% of the securities brokerage market share in 2025, while advisory brokerage is forecast to expand at 9.23% through 2031.
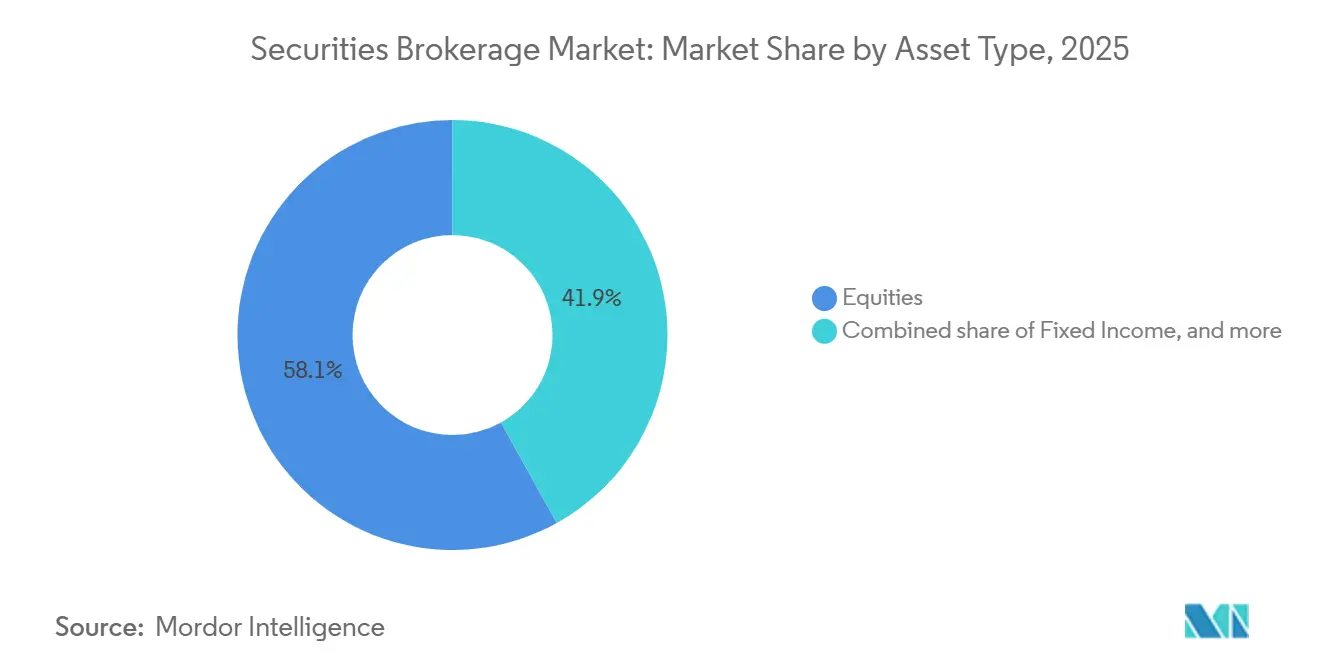
- By asset type, equities captured 58.06% of the securities brokerage market share in 2025, while derivatives are projected to grow at 8.89% CAGR through 2031.
- By delivery model, digital and online platforms accounted for 48.12% of the securities brokerage market share in 2025, while robo-advisory and automated advisory platforms are forecast to advance at 12.79% through 2031.
- By geography, North America captured 43.24% of the securities brokerage market share in 2025, while Asia-Pacific is projected to grow at 11.33% CAGR through 2031.
Note: Market size and forecast figures in this report are generated using Mordor Intelligence’s proprietary estimation framework, updated with the latest available data and insights as of January 2026.
Global Securities Brokerage Market Trends and Insights
Drivers Impact Analysis*
| Driver | (~) % Impact on CAGR Forecast | Geographic Relevance | Impact Timeline |
|---|---|---|---|
| Commission-Free and Low-Fee Digital Brokerage Adoption | +2.1% | Global, strongest in North America and Asia-Pacific | Short term (≤ 2 years) |
| Rising Retail Participation in Securities Trading | +1.8% | Global, the highest velocity in India, Southeast Asia, and Latin America | Medium term (2-4 years) |
| Growth In Algorithmic and Mobile-First Execution Demand | +1.5% | North America, Europe, Asia-Pacific core, with spillover to the Middle East and Africa | Medium term (2-4 years) |
| Increasing Use of Multi-Asset and Cross-Border Brokerage Platforms | +1.2% | Global, led by Asia-Pacific institutional and retail corridors | Long term (≥ 4 years) |
| Embedded Compliance Automation as a Cost-Reduction Lever | +0.6% | North America and Europe, with spillover to regulation-intensive markets | Medium term (2-4 years) |
| Account Aggregation Across Retirement, Taxable, and Advisory Wallets | +0.5% | North America is dominant, expanding in Europe | Long term (≥ 4 years) |
| Source: Mordor Intelligence | |||
Commission-Free and Low-Fee Digital Brokerage Adoption
The securities brokerage market continues to absorb the long-term effects of zero-commission and low-fee trading, but the revenue model has shifted rather than disappeared. Pricing is now used mainly to acquire and retain accounts, while firms earn more from margin lending, cash sweep balances, premium tools, and managed products. Charles Schwab reported record net revenues of USD 23.9 billion in 2025, up 22% from 2024, and margin loan balances rose 34% year over year to USD 112.3 billion, which showed how balance sheet products support earnings after commissions fall[1]Charles Schwab Corporation, “2025 Annual Report,” Charles Schwab, content.schwab.com. The securities brokerage market has therefore moved toward longer-duration client economics, where the first trade matters less than the total wallet captured over time. Firms that attract users on price but do not build advisory, lending, or retirement relationships face weaker monetization and lower retention. This pattern has become one of the clearest structural changes shaping the securities brokerage market.
Rising Retail Participation in Securities Trading
Retail participation remains one of the main demand engines in the securities brokerage market, especially in countries where digital onboarding and app-based access have reduced the cost of entry. India added 235 lakh new demat accounts through December in FY26, taking the total beyond 21.6 crore, showing how quickly the addressable retail base is widening[2] FORTUNEINDIA.COM Economic Survey 2026: 235 lakh demat accounts added in FY26 till Dec; total crosses 21.6 crore. SEBI also stated that 63% of Indian households are aware of securities market products, while only 9.5% actively invest, indicating a large participation gap that could still translate into funded brokerage activity. The securities brokerage market is not only adding accounts, it is also pushing firms to improve education, cross-sell depth, and client engagement because registered users do not always become active traders. That issue was evident in India, where several top brokerages saw pressure on active clients even as total accounts grew, suggesting the next stage of competition is likely to center more on usage than on sign-ups. The securities brokerage market should continue to benefit from retail inflows, but the firms that convert passive accounts into repeat users are likely to capture more value.
Growth in Algorithmic and Mobile-First Execution Demand
The securities brokerage market is seeing a steady convergence between retail trading tools and the features once reserved for institutional desks. United States listed options activity remained elevated in 2025, with average daily transactions reaching 8.4 million, and zero-days-to-expiration options accounted for a meaningful share of that flow[3]MORNINGSTAR.COM FINRA Publishes 2026 Industry Snapshot | Morningstar. This activity matters because high-frequency decision-making works best on platforms that support fast routing, live analytics, and mobile access at scale. Interactive Brokers expanded its AI trading interface in June 2026 by adding ChatGPT and Grok alongside Claude, allowing clients to research, analyze, and generate order instructions across equities, options, futures, and ETFs through natural language workflows. The securities brokerage market is therefore moving toward a model where platform quality depends less on basic order entry and more on the speed and quality of assisted execution. As those tools become standard, the investment burden rises for smaller firms that still depend on older front-end systems.
Increasing Use of Multi-Asset and Cross-Border Brokerage Platforms
The securities brokerage market is also broadening through platforms that combine multiple asset classes and jurisdictions into a single client interface. Interactive Brokers launched access to the Korea Exchange in May 2026, becoming the first major United States-based broker to provide direct access to that market from a unified global platform[4]BUSINESSWIRE.COM Interactive Brokers Launches Access to Korean Equities, Breaking New Ground for Global Investors. Futu Holdings reported total client assets of USD 155.8 billion in Q1 2026, up 47.2% year over year, with double-digit growth across Canada, Japan, Malaysia, and Australia, which showed the pull of cross-border account models in Asia-Pacific. Robinhood also expanded its international product set in 2025 by launching tokenized United States stocks and ETFs across multiple European markets, reflecting growing demand for always-on access and broader asset choice. The securities brokerage market is increasingly rewarding platforms that can hold client attention across equities, derivatives, crypto-assets, and cross-border portfolios, rather than serving only a single domestic use case. That shift is likely to support firms with stronger licensing reach, more integrated custody systems, and deeper product menus.
Restraints Impact Analysis*
| Restraint | (~) % Impact on CAGR Forecast | Geographic Relevance | Impact Timeline |
|---|---|---|---|
| Margin Compression from Zero-Commission and Price Transparency | -0.9% | Global, highest in United States and European retail brokerage | Short term (≤ 2 years) |
| Rising Cybersecurity and Identity-Fraud Exposure in Digital Onboarding | -0.7% | Global, acute in Japan, Hong Kong, India, and the United States | Medium term (2-4 years) |
| Execution And Settlement Friction in Volatile and Fragmented Markets | -0.5% | North America and Europe, with spillover to the Asia-Pacific | Medium term (2-4 years) |
| Product Suitability and Cross-Border Regulatory Complexity | -0.4% | Europe, Asia-Pacific, and selective Middle East and Africa markets | Long term (≥ 4 years) |
| Source: Mordor Intelligence | |||
Margin Compression from Zero-Commission and Price Transparency
Margin pressure remains one of the clearest operating constraints in the securities brokerage market because trade execution is now priced close to a commodity in many retail channels. As commissions approach zero, firms without meaningful balances in margin lending, advisory assets, or client cash programs have fewer ways to recover acquisition costs. This pressure has made scale more important and pushed weaker operators toward consolidation or exit. Okasan Securities said in March 2026 that it would transfer around 460,000 online brokerage accounts to SBI Securities after rising cybersecurity and operating costs made the business difficult to sustain, which showed how fee pressure and compliance costs can interact. Europe adds another layer of strain because the payment-for-order-flow ban that took effect on June 30, 2026, removed a revenue source for retail brokers in key markets. The securities brokerage market can still grow under these conditions, but earnings quality becomes more uneven across firms.
Rising Cybersecurity and Identity-Fraud Exposure in Digital Onboarding
The securities brokerage market faces a rising operational burden from digital fraud, especially as account opening becomes faster and more remote. FINRA's 2026 Annual Regulatory Oversight Report documented the use of deepfake selfies, fake identity documents, and voice cloning to circumvent onboarding controls, thereby increasing both compliance costs and reputational risk for digitally native brokers. Japan also saw a sharp increase in account hijacking, with 3,400 unauthorized online brokerage transactions recorded in March and April 2025 alone, compared with 72 in January and February of the same year. These attacks matter because they no longer focus solely on theft and can also be used to place manipulative trades through compromised accounts. The securities brokerage market is therefore being pushed to spend more on surveillance, identity controls, and incident response, even when clients still expect low-cost service. That cost is manageable for large firms, but it is more difficult for smaller platforms with thinner margins.
*Our forecasts treat driver/restraint impacts as directional, not additive. The impact forecasts reflect baseline growth, mix effects, and variable interactions.
Segment Analysis
By Revenue Model: Fee-Based Revenue Gains Ground as Commission Margins Thin
Commission revenue accounted for 37.67% of the securities brokerage market by revenue model in 2025, making it the largest revenue stream even as pricing remained under pressure. The segment still reflects the scale of client trading activity across both retail and institutional accounts. At the same time, low or zero commissions have reduced the pricing power of basic execution, meaning volume alone is no longer enough to protect margins. That has made transaction income less secure than it once was, especially for firms that built their client base on price-led acquisition. The securities brokerage market has therefore kept commission revenue in the lead, but its role inside the business model is becoming narrower.
Fee revenue is forecast to grow at 10.82% through 2031, making it the fastest-growing revenue sub-segment in the securities brokerage market. This line includes advisory fees, managed account charges, and subscription-style income, which tend to be less volatile than trading-led revenue. Charles Schwab reported that net flows into managed investing solutions rose 36% in 2025 from 2024, which showed how firms are pushing clients toward recurring asset-based relationships. Interest revenue still provides a useful earnings buffer, and Schwab's net interest revenue rose to USD 11.75 billion in 2025, up 29% from 2024, but that line is more exposed to rate cycles than fee income. The direction of travel across the securities brokerage industry is clear, with firms placing more weight on stable wallet share and less on one-time trade income.


By Client Type: Institutional Scale Contrasts with Retail Velocity
Institutional investors held 56.43% of the securities brokerage market share in 2025, making them the main revenue anchor across execution, financing, and advisory services. Their importance reflects the scale of prime brokerage, block trading, derivatives support, and cross-asset service demands. Institutional relationships also tend to be harder to win and harder to replace because they depend on financing capacity, risk controls, and global market access. That creates higher entry barriers than in most retail channels. The securities brokerage market still depends heavily on these clients for profit pools, even as retail growth accelerates.
Retail investors are forecast to grow at 9.71% through 2031, the fastest rate among client types in the securities brokerage market. The growth case rests on digital account opening, better product access, and broader participation from first-time investors in emerging economies. Apex Fintech said its platform sustained trading volumes of 20 to 30 times normal levels for weeks during Q1 2026 volatility, suggesting that retail activity is becoming deeper and more disciplined in periods of stress. The remaining gap between awareness and active investment in markets such as India also leaves room for additional funded accounts over the medium term. The securities brokerage market is therefore likely to continue to see faster account-led expansion on the retail side, even as institutional clients remain larger in revenue terms.
By Service Model: Full-Service Holds Majority, Advisory Grows Fastest
Full-service brokerage accounted for 44.96% of the securities brokerage market in 2025, indicating that many clients still value integrated advice, research, and execution. This model remains strongest among affluent retail clients, institutions, and households with more complex planning needs. The appeal of the format lies in its breadth, as clients can combine portfolio guidance, product access, and relationship support in one place. Morgan Stanley's Wealth Management division reported record revenue of USD 31.8 billion in 2025 and net new assets of USD 356 billion, which reflected the resilience of high-balance advisory relationships. The securities brokerage market continues to support full-service firms, where trust, advice, and balance-sheet capability still carry pricing power.
Advisory brokerage is forecast to grow at 9.23% through 2031, the fastest rate across service models in the securities brokerage market. This growth reflects both investor demand for more guidance and rising suitability expectations in regulated markets. Clients are responding to more complex asset choices, more frequent volatility, and a wider need for retirement and wealth planning support. Execution-only brokerage remains relevant for cost-sensitive and active users, and Interactive Brokers showed that the model can still scale, with 2025 revenue of USD 6.16 billion and strong growth in options and futures activity. Even so, the securities brokerage market is gradually rewarding firms that can add advice without losing digital efficiency, especially in client segments between pure self-directed trading and traditional private wealth service.
By Asset Type: Equity Dominance Coexists with Derivatives Acceleration
Equities accounted for 58.06% of brokerage revenue by asset type in 2025, making them the largest asset pool in the securities brokerage market. This position reflects the central role of listed shares in both retail trading and institutional portfolio activity. FINRA reported that the average daily dollar volume of exchange-listed United States equities reached USD 828 billion in 2025, which showed how much client flow still centers on stocks. Extended-hours activity and app-based access have further supported the importance of equities as the default entry point for many investors. The securities brokerage market, therefore, continues to rely on stock trading as its main activity base even as product sets expand.
Derivatives are forecast to grow at 8.89% through 2031, which makes them the fastest-growing asset type in the securities brokerage market. Growth is being supported by higher options participation, more active futures use, and broader acceptance of complex products among experienced retail clients. Global exchange-traded derivatives volume rose 38.8% in Q1 2026, and options open interest reached 1.25 billion contracts by the end of March 2026. Fixed income remains important as a stabilizing client channel, while the other securities category continues to widen through ETFs, structured products, and tokenized instruments. The securities brokerage market is therefore becoming more balanced in product depth, even though equities still dominate revenue.
By Delivery Model: Digital Leads, Robo-Advisory Extends the Fastest
Digital and online platforms accounted for 48.12% of the securities brokerage market in 2025, making them the largest delivery model. The shift reflects a client preference for app-based trading, self-service tools, and immediate access across devices. Digital delivery is now standard in most retail segments, and it is becoming a basic expectation even in advisory-led channels. Traditional branch-based models still matter for some high-net-worth and institutional relationships, but they no longer define volume growth. The securities brokerage market has therefore moved firmly toward digital-first interaction as its main operating base.
Robo-advisory and automated advisory platforms are forecast to grow at 12.79% through 2031, which makes them the fastest-growing delivery model in the securities brokerage market. Growth is being driven by lower-cost portfolio management, automated rebalancing, and wider acceptance of hybrid support models. Industry estimates cited in the user draft show that robo-advisors managed more than USD 1.5 trillion in assets by 2026, while established platforms such as Schwab Intelligent Portfolios and Fidelity Go continued to add scale. AAII also noted in June 2026 that the model is evolving toward a hybrid format, with automation handling routine servicing and human advisors focusing on more complex planning needs. The securities brokerage market is likely to continue favoring firms that can combine automated efficiency with selective human advice rather than relying solely on a pure robo structure.
Geography Analysis
North America accounted for 43.24% of the securities brokerage market in 2025, giving the region the largest revenue footprint. The lead comes from the depth of the United States capital markets, the scale of domestic broker-dealers, and the size of managed investment balances. Charles Schwab reported record 2025 revenue of USD 23.9 billion, total client assets of USD 11.9 trillion, and 4.7 million new brokerage accounts, which showed how large the United States platform base has become. Fidelity also ended 2025 with total revenue of USD 37.7 billion, up 15% from the prior year, reinforcing the weight of the largest United States franchises. The securities brokerage market in North America also remains a demanding operating environment because cybersecurity, suitability, and identity controls are raising the compliance floor for mid-tier firms.
Asia-Pacific is projected to grow at 11.33% through 2031, making it the fastest-expanding regional segment in the securities brokerage market. India remains a central driver, with NSE trading accounts crossing 26 crores in June 2026 and 4.3 crores added in the previous 12 months. Japan also posted stronger earnings momentum, and the country's 5 major online brokerages reported combined net profit growth of 24% in FY2026, while SBI Securities crossed 16 million accounts. Southeast Asia is also strengthening market infrastructure, and the Singapore Exchange reported record derivatives volumes of 329 million contracts in 2025. The securities brokerage market in Asia-Pacific is benefiting from rising investor participation and from local exchanges and brokers building deeper digital and multi-asset capability.
Europe continues to hold a meaningful share of the securities brokerage market, but its operating model is under more regulatory pressure than in most other regions. The payment-for-order-flow ban that took effect on June 30, 2026, removed a core revenue tool for some retail platforms and is forcing pricing and routing changes in parts of the region. South America, the Middle East, and Africa remain smaller revenue pools today, but digital-first brokerage adoption and capital market liberalization are pointing in a constructive direction. Robinhood's in-principle approval in Singapore in 2026 also showed that major platforms still view the Asia-Pacific regulatory corridor as a priority for licensed expansion.

Competitive Landscape
The securities brokerage market remains moderately concentrated at the institutional and prime brokerage tier, while retail and regional activity is more fragmented. The top 3 prime brokers collectively service a significant share of global prime brokerage assets, underscoring that scale still matters heavily when financing, derivatives support, and global market access are essential. That concentration does not carry over evenly into the broader securities brokerage market, where digital platforms and local firms still compete for self-directed and mid-market accounts. Large incumbents keep an advantage because they can spread technology and compliance spending across a much larger revenue base. The securities brokerage market, therefore, combines high concentration at one level with broad fragmentation at another.
Technology spending is now one of the clearest points of separation inside the securities brokerage market. Interactive Brokers expanded its AI trading tools in June 2026 and widened international market access in May 2026 with direct connectivity to Korean equities, which showed how product depth and workflow quality are being used together as competitive levers. Charles Schwab also completed its acquisition of Forge Global in March 2026, extending retail and RIA access into private securities and broadening its product stack beyond public markets. U.S. Bancorp completed the acquisition of BTIG in June 2026, which strengthened its institutional capital markets and prime brokerage reach. These moves show that the securities brokerage market is being shaped not only by price competition but also by the expansion into new products, improved workflows, and stronger institutional coverage.
Balance sheet strength and operating discipline remain just as important as front-end features in the securities brokerage market. Large firms can absorb heavier cybersecurity and supervision costs, while smaller firms face more pressure when margins are already thin. That difference was visible when Okasan chose to transfer its online accounts to SBI rather than continue to carry rising costs on its own. The securities brokerage market is likely to continue seeing selective consolidation, with compliance intensity rising faster than standalone earnings capacity.
Securities Brokerage Industry Leaders
Charles Schwab Corporation
Fidelity Investments
Morgan Stanley
Interactive Brokers LLC
Robinhood Markets, Inc.
- *Disclaimer: Major Players sorted in no particular order

Recent Industry Developments
- June 2026: United States Bancorp completed the acquisition of BTIG LLC, one of the top-10 United States equity brokers by high-touch volume, strengthening its institutional capital markets and prime brokerage platform and positioning it to compete for mid-market institutional and hedge fund brokerage mandates.
- June 2026: Interactive Brokers expanded its agentic trading ecosystem with the addition of ChatGPT and Grok, alongside its existing Claude integration, enabling AI-driven research, analysis, and order instruction generation across equities, options, futures, and ETFs from a single platform.
- June 2026: NSE's unique trading accounts crossed 26 crore, with 4.3 crore added in the past year, marking the latest milestone in India's accelerating retail brokerage expansion, and Robinhood received in-principle approval from the Monetary Authority of Singapore to offer a full-spectrum brokerage service in the city-state.
- May 2026: Interactive Brokers launched access to the Korea Exchange, becoming the first major United States-based broker to enable trading in South Korea's USD 4 trillion-plus equity market from a unified multi-asset global platform.


Global Securities Brokerage Market Report Scope
| Commission Revenue |
| Fee Revenue |
| Interest Revenue |
| Other Revenue |
| Retail Investors | Retail / Mass Affluent |
| High-Net-Worth Individuals (HNW) | |
| Ultra-High-Net-Worth Individuals (UHNW) | |
| Institutional Investors | Asset & Fund Managers |
| Hedge Funds & Alternative Investment Managers | |
| Pension Funds, Endowments & Sovereign Wealth Funds | |
| Insurance Companies & Other Financial Institutions | |
| Corporates & Non-Financial Institutions |
| Execution-Only Brokerage |
| Advisory Brokerage |
| Full-Service Brokerage |
| Equities |
| Fixed Income |
| Derivatives |
| Other Securities |
| Digital / Online Platforms |
| Traditional / Branch-based |
| Hybrid |
| Robo-Advisory / Automated Advisory Platforms |
| North America | United States |
| Canada | |
| Mexico | |
| South America | Brazil |
| Argentina | |
| Rest of South America | |
| Europe | United Kingdom |
| Germany | |
| France | |
| Italy | |
| Spain | |
| Rest of Europe | |
| Asia-Pacific | China |
| Japan | |
| India | |
| South Korea | |
| Australia | |
| South East Asia (Singapore, Malaysia, Thailand, Indonesia, Vietnam, and Philippines) | |
| Rest of Asia-Pacific | |
| Middle East and Africa | Saudi Arabia |
| United Arab Emirates | |
| Turkey | |
| South Africa | |
| Egypt | |
| Rest of Middle East and Africa |
| By Revenue Model | Commission Revenue | |
| Fee Revenue | ||
| Interest Revenue | ||
| Other Revenue | ||
| By Client Type | Retail Investors | Retail / Mass Affluent |
| High-Net-Worth Individuals (HNW) | ||
| Ultra-High-Net-Worth Individuals (UHNW) | ||
| Institutional Investors | Asset & Fund Managers | |
| Hedge Funds & Alternative Investment Managers | ||
| Pension Funds, Endowments & Sovereign Wealth Funds | ||
| Insurance Companies & Other Financial Institutions | ||
| Corporates & Non-Financial Institutions | ||
| By Service Model | Execution-Only Brokerage | |
| Advisory Brokerage | ||
| Full-Service Brokerage | ||
| By Asset Type | Equities | |
| Fixed Income | ||
| Derivatives | ||
| Other Securities | ||
| By Delivery Model | Digital / Online Platforms | |
| Traditional / Branch-based | ||
| Hybrid | ||
| Robo-Advisory / Automated Advisory Platforms | ||
| By Geography | North America | United States |
| Canada | ||
| Mexico | ||
| South America | Brazil | |
| Argentina | ||
| Rest of South America | ||
| Europe | United Kingdom | |
| Germany | ||
| France | ||
| Italy | ||
| Spain | ||
| Rest of Europe | ||
| Asia-Pacific | China | |
| Japan | ||
| India | ||
| South Korea | ||
| Australia | ||
| South East Asia (Singapore, Malaysia, Thailand, Indonesia, Vietnam, and Philippines) | ||
| Rest of Asia-Pacific | ||
| Middle East and Africa | Saudi Arabia | |
| United Arab Emirates | ||
| Turkey | ||
| South Africa | ||
| Egypt | ||
| Rest of Middle East and Africa | ||


Key Questions Answered in the Report
What is the 2031 value forecast for securities brokerage?
The securities brokerage market is forecast to reach USD 2.85 trillion by 2031, up from USD 1.91 trillion in 2026.
What is the expected growth rate between 2026 and 2031?
The securities brokerage market is expected to grow at an 8.3% CAGR over 2026 to 2031.
Which client group leads brokerage revenue today?
Institutional investors led with 56.43% share in 2025, supported by prime brokerage, block execution, and multi-asset service needs.
Which delivery format is expanding the fastest?
Robo-advisory and automated advisory platforms are projected to grow at 12.79% through 2031, faster than other delivery models.
Which region is growing the fastest?
Asia-Pacific is the fastest-growing region with an 11.33% CAGR through 2031, supported by rising account penetration and digital trading adoption.
What is the biggest structural pressure on brokerages?
Margin compression remains a key issue because zero-commission pricing reduces trade revenue and pushes firms to rely more on advisory, lending, and cash-based income.
Page last updated on:


