United States Securities Brokerage Market Size and Share
Market Overview
| Study Period | 2020 - 2031 |
|---|---|
| Forecast Data Period | 2026 - 2031 |
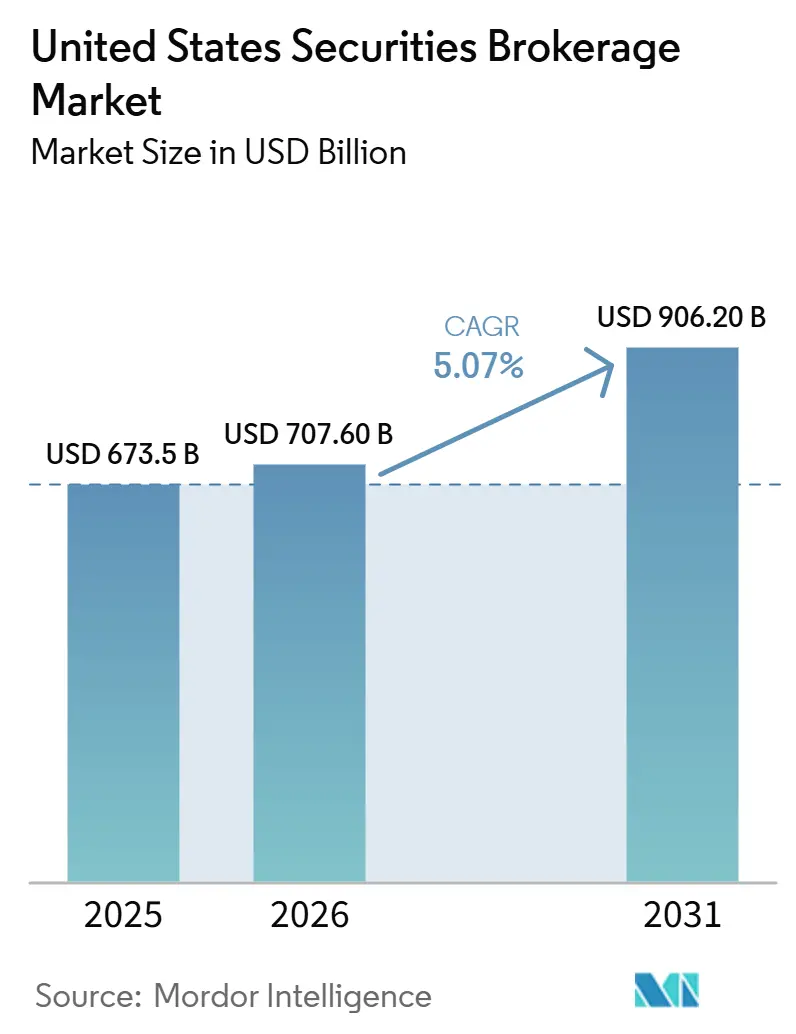
| Base Year Market Size (2025) | USD 673.5 Billion |
| Market Size (2026) | USD 707.60 Billion |
| Market Size (2031) | USD 906.20 Billion |
| Growth Rate (2026 - 2031) | 5.07% CAGR |
| Market Concentration | Medium |
Major Players *Disclaimer: Major Players sorted in no particular order Image © Mordor Intelligence. Reuse requires attribution under CC BY 4.0. | |
United States Securities Brokerage Market Analysis by Mordor Intelligence
The United States Securities Brokerage Market size is expected to increase from USD 673.5 billion in 2025 to USD 707.60 billion in 2026 and reach USD 906.20 billion by 2031, growing at a CAGR of 5.07% over 2026-2031.
Zero-commission trading removed execution frictions and supported a surge in retail activity that delivered USD 308 billion of inflows into U.S. equities in 2025, reinforcing asset accumulation at scale. The move to T+1 settlement enhanced capital efficiency by cutting clearing fund requirements and margin demands, which strengthened liquidity and reduced counterparty risk across the United States securities brokerage market. Retail investors accounted for 20-35% of daily equity trading volume in 2025, and their consistent engagement is now a structural feature shaping pricing, product, and service design. Consolidation has concentrated client assets among a small set of scaled platforms, while compliance and cyber requirements continue to compress operating margins for smaller firms. Margin debt rose to a record USD 1.279 trillion in January 2026, which adds sensitivity to rate cycles and volatility regimes across the United States securities brokerage market[1]Staff, “Margin Statistics,” FINRA, finra.org.
Key Report Takeaways
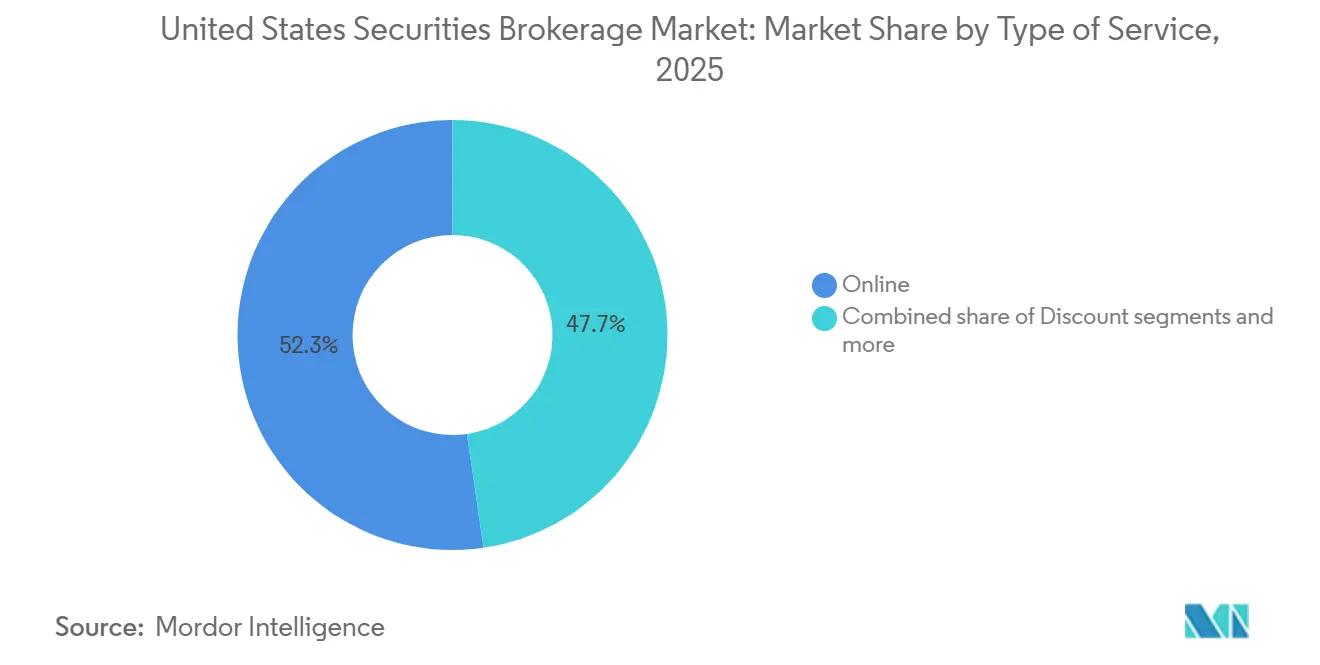
- By type of service, online brokerage led the United States securities brokerage market with 52.3% revenue share in 2025, while robo-advisor platforms are projected to expand at a 15.2% CAGR through 2031.
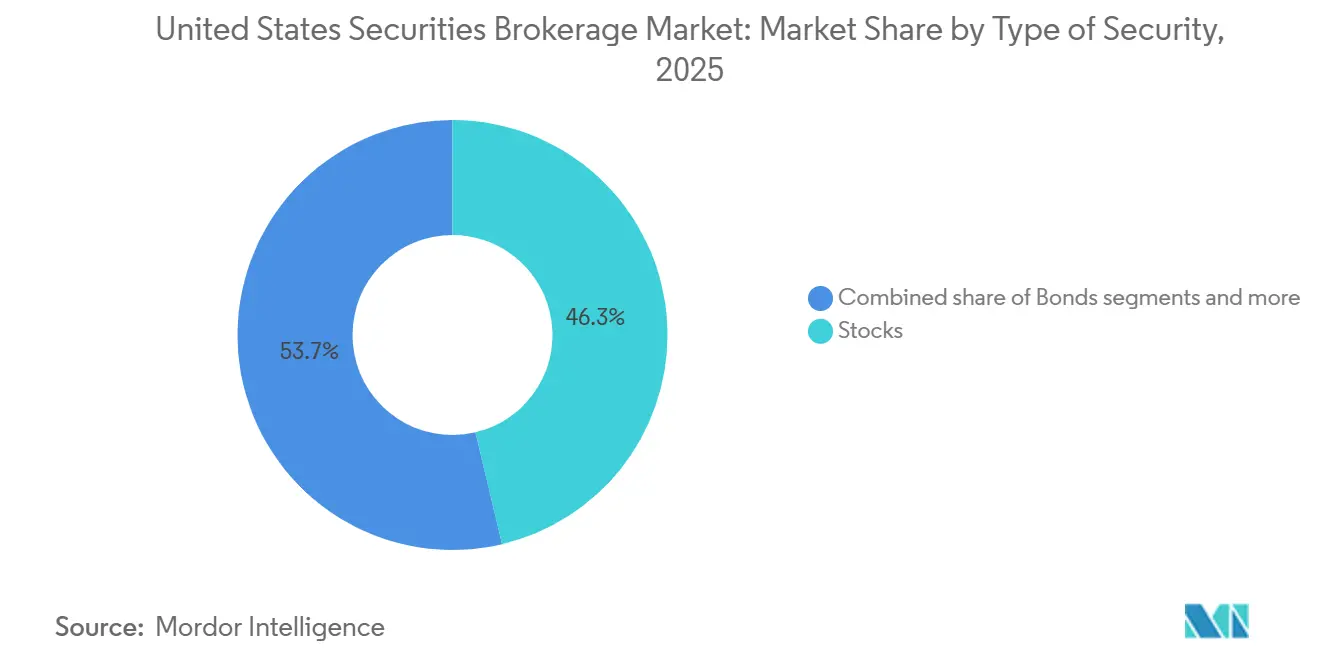
- By type of security, stocks commanded 46.3% of the United States securities brokerage market in 2025, and derivatives are set to grow the fastest at a 9.2% CAGR over 2026-2031.
- By client type, retail investors held a 61.4% share of the United States securities brokerage market in 2025, with this cohort also forecast to grow the fastest at a 9% CAGR to 2031.
- By geography, the South accounted for 35.4% of the United States securities brokerage market in 2025, while the West is projected to post the fastest growth at a 6.6% CAGR over 2026-2031.
- By type of brokerage service, stock brokerage captured 41.2% of the United States securities brokerage market in 2025, and forex brokerage is projected to be the fastest-growing service at a 7.9% CAGR to 2031.
Note: Market size and forecast figures in this report are generated using Mordor Intelligence’s proprietary estimation framework, updated with the latest available data and insights as of 2026.
United States Securities Brokerage Market Trends and Insights
Drivers Impact Analysis*
| Driver | (~) % Impact on CAGR Forecast | Geographic Relevance | Impact Timeline |
|---|---|---|---|
| Heightened retail participation post-zero-commission shift | +3.2% | National, concentration in South and West | Medium term (2-4 years) |
| Accelerated digitization of back-office clearing and settlement | +2.5% | National, led by Northeast financial centers | Short term (≤ 2 years) |
| SEC Regulation Best Interest pushing advisory upgrades | +1.8% | National, with heightened compliance in Northeast | Medium term (2-4 years) |
| Tokenization of traditional assets enabling fractional trading | +2.3% | National, early adoption in West tech hubs with spill-over to Northeast | Long term (≥ 4 years) |
| Adoption of AI-driven investor analytics for hyper-personalization | +1.9% | National, concentration in large metro areas | Medium term (2-4 years) |
| Banks’ embedded-brokerage offerings within super-apps | +1.3% | National, early gains in major urban centers | Long term (≥ 4 years) |
| Source: Mordor Intelligence | |||
Heightened Retail Participation Post-Zero-Commission Shift
Retail inflows into the United States equities reached USD 308 billion in 2025, which surpassed prior peaks and validated how zero-commission access now translates into sustained asset gathering across the United States securities brokerage market. Retail investors contributed 20-35% of daily equity trading volume in 2025, and that share supported depth in single-name liquidity, higher options turnover, and more continuous cash deployment. Wholesale market makers continue to intermediate a large share of retail order flow under the existing order-handling framework, which sustains execution-quality scrutiny and potential rulemaking focus[2]Staff, “Examination Priorities 2026,” U.S. Securities and Exchange Commission, sec.gov. Platforms with scaled customer bases expanded premium features and broadened product menus, which supported recurring engagement while softening the impact of lower per-trade monetization. Margin lending remains important to revenue mixes as rates hold at elevated levels, but it raises sensitivity to volatility spikes given record leverage in early 2026. The combination of mobile-first design, fractional access, and continuous education has expanded participation among younger cohorts, which is reshaping product development and advisory models across the United States securities brokerage market.
Accelerated Digitization of Back-Office Clearing & Settlement
The T+1 settlement change, effective in 2024, reduced clearing fund needs and margin requirements, which improved liquidity usage and compressed counterparty risk across the United States securities brokerage market. Tokenization pilots across traditional custody are now approved for phased rollout, which lays the groundwork for programmable settlement and asset mobility. Broadridge’s distributed ledger repo platform registered a sharp increase in daily volumes by late 2025, which demonstrates sustained demand for real-time collateral and funding workflows. Messaging standardization has advanced through ISO 20022 adoption in cross-border traffic, which helps improve reconciliation performance and supports future near-real-time affirmation. The Clearing House’s real-time payments network processed rising volumes in 2025, and that momentum supports faster cash movements around trade funding and disbursements[3]Corporate Communications, “RTP Quarterly Metrics,” The Clearing House, theclearinghouse.org. Large institutions have increased technology investment to modernize core processing stacks, which positions the United States securities brokerage market for further settlement-cycle compression as operational resiliency improves.
SEC Regulation Best Interest Pushing Advisory Upgrades
Regulation Best Interest has been a consistent supervisory focus, and enforcement activity in 2025 confirmed that documentation standards, conflict mitigation, and product-suitability oversight are central to broker-dealer operations. Examinations in 2026 list Reg BI as a priority area, and firms are expected to enhance monitoring of account-type recommendations, rollovers, and comparative cost analysis. Several actions in 2025 cited failures to disclose fee changes or to evidence care obligations, which reinforced the need for real-time controls embedded in client-onboarding and recommendation workflows. CFP professionals reported that compliance with heightened standards did not trigger widespread client offboarding or higher minimums, and many support convergence to uniform fiduciary requirements over time. Form CRS requirements have improved transparency on services, fees, and conflicts, and they support client comparisons between transactional and fee-based offerings. These changes accelerate the migration toward advisory and planning-centric models that stabilize recurring revenue and reduce dependence on trade commissions within the United States securities brokerage industry.
Tokenization of Traditional Assets Enabling Fractional Trading
The tokenization of real-world assets is scaling across fixed income, funds, and private credit, with 2025 assets on-chain growing and longer-term projections pointing to multi-trillion value by 2031 as adoption spreads from pilots to production. Tokenized United States Treasuries expanded through 2025 as institutions deployed on-chain money market and short-duration strategies managed by established asset managers. BlackRock’s on-chain money fund crossed USD 550 million in assets in 2025, illustrating mainstream buy-side participation in tokenized cash equivalents[4] Corporate Communications, “BUIDL Fund Update,” BlackRock, blackrock.com. The SEC clarified elements of the tokenized securities taxonomy in early 2026, which reduced legal uncertainty for platforms integrating on-chain issuance and secondary trading. DTCC’s tokenization pilot for DTC-custodied assets supports interoperability with existing market plumbing and offers an institutional-grade path for scale. The NYSE announced plans in 2026 to build a trading environment for tokenized securities, which addresses investor demand for fractional access, continuous trading windows, and near-instant settlement.
Restraints Impact Analysis*
| Restraint | (~) % Impact on CAGR Forecast | Geographic Relevance | Impact Timeline |
|---|---|---|---|
| Margin-loan exposure amid rising rate volatility | -2.1% | National, heightened impact during volatile periods | Short term (≤ 2 years) |
| Cyber-security spend escalation compressing margins | -1.7% | National, disproportionate burden on mid-size firms | Medium term (2-4 years) |
| Consolidation-driven price wars eroding commission revenue | -2.4% | National, with greater effects in large financial centers | Medium term (2-4 years) |
| Escalating compliance costs from AML/KYC mandates | -1.5% | National, with stricter oversight in certain jurisdictions | Short term (≤ 2 years) |
| Source: Mordor Intelligence | |||
Margin-Loan Exposure Amid Rising Rate Volatility
FINRA reported margin debt at USD 1.279 trillion in January 2026, which set a new record and extended a multi-month climb in investor leverage. Elevated policy rates have kept borrowing costs high, and that forces leveraged accounts to clear higher return hurdles during volatile periods. Maintenance requirements can be adjusted unilaterally by brokers, and FINRA’s rules set minimums that firms often exceed for risk management, which raises the potential for sudden liquidations during stress. Historical patterns show that drawdowns are larger and faster in margin accounts than in cash accounts during risk-off episodes, which amplifies feedback loops when volatility spikes. The build-up of leverage has therefore become a systemic monitoring point for supervisors and brokers within the United States securities brokerage market.
Cyber-Security Spend Escalation Compressing Margins
Average breach costs in financial services reached USD 6.08 million in 2024, which was materially higher than the cross-industry average and underscores the financial stakes for broker-dealers. Amendments to Regulation S-P adopted in 2024 require incident response programs, vendor oversight, and customer notifications within 30 days for large entities by late 2025, which expands required investments in detection and response. FINRA actions in 2024 highlighted failures to implement basic controls such as multi-factor authentication and encryption, and those cases signaled that enforcement of cyber controls would tighten in 2025 and 2026. Cyber insurance markets increasingly require specific technical controls for underwriting and renewal, which shifts costs toward firms with lagging maturity. Broker-dealers of smaller scale carry a higher relative burden because fixed cyber costs scale poorly, which depresses margins unless platforms consolidate or adopt shared services. This cost profile is now a structural factor in the competitive dynamics of the United States securities brokerage market.
*Our forecasts treat driver/restraint impacts as directional, not additive. The impact forecasts reflect baseline growth, mix effects, and variable interactions.
Segment Analysis
By Type of Security: Derivatives Emerge from Stocks’ Shadow
Stocks commanded a 46.3% share in 2025, supported by persistent retail engagement and the availability of low-friction execution that grew volumes across the United States securities brokerage market. Options and futures activity accelerated as investors used hedging and income strategies alongside equity exposure, and options trading volume rose 27% year over year in Q4 2025 at a leading electronic broker. Fractional ownership and mobile access kept single-name equities central to client portfolios, while suitability standards continue to demand enhanced supervision for complex products. Tokenized fixed income and funds expanded in 2025, which added new digital wrappers to the security mix in custody and clearing pipelines. The segment’s structure reflects a balance between equity-driven participation and derivatives usage for tactical and risk management purposes across the United States securities brokerage market.
Derivatives are projected to post the fastest growth at a 9.2% CAGR over 2026-2031, reflecting adoption of options overlays and volatility strategies on mainstream platforms. Regulatory frameworks require options-specific approvals and margin governance, which shape risk appetite and strategy selection for both retail and advisory accounts. Money market and Treasury exposures have also modernized through tokenization, and on-chain funds managed by established asset managers have validated institutional use cases. This diversification broadens the investable toolkit beyond traditional wrappers, and it supports incremental growth from investors seeking precise exposures and liquidity features. As platforms expand education, analytics, and pre-trade controls, adoption of multi-asset strategies is likely to deepen within the United States securities brokerage industry.


By Type of Brokerage Service: Stock Dominates, Forex Accelerates
Stock brokerage captured a 41.2% share in 2025 as equity dealing, options overlays, and fractional access remained the anchor of client activity on leading platforms. Larger brokers monetize through advisory fees, interest income, and securities trading revenue, as trade commissions now play a smaller role in total income for the sector. Deep product menus and unified digital experiences have improved client retention, while best-execution oversight sustains focus on execution quality and routing practices. Cross-asset access within a single account remains a differentiator, as investors prefer consolidated workflows that connect trading, cash management, and advice.
Forex brokerage is projected to grow at a 7.9% CAGR over 2026-2031 as platforms expand currency pairs, real-time funding rails, and integrated analytics for retail and professional users. Multi-asset brokers use currency access to complement equities, derivatives, and fixed income, with tight spreads and transparent pricing models improving adoption among active traders. Securities-backed credit and non-purpose lending provide alternative liquidity to fund investments or manage personal finance needs, which reinforces the value of brokerage ecosystems that integrate banking-like features. Advisory and compliance requirements vary across stocks, forex, and commodities, and the need to supervise multiple rule sets favors firms with strong central compliance functions. This mix continues to support growth as clients seek convenience, breadth, and cost efficiency across the United States securities brokerage market.
By Type of Service: Online Reigns, Robo Advisors Surge
Online brokerage services held a 52.3% share in 2025, reflecting the migration from branch-based to mobile-first models and the scale advantages of digital onboarding, education, and self-directed tools. Leading platforms reported strong account and asset growth in 2025, which reinforced how digital infrastructure converts engagement into durable client relationships. Online penetration also accelerated advisory workflows through integrated planning and analytics, which helped diversify revenue toward recurring fee streams as trade commissions diminished. Form CRS improved transparency and supported client understanding of fee-based versus transactional services in digital channels.
Robo advisor platforms are projected to be the fastest-growing model at a 15.2% CAGR through 2031, with automation, tax optimization, and low-cost index strategies aligning with mass-affluent needs. Hybrid advice models that combine digital portfolios with human planners continue to scale, and retirement and goals-based features have become standard within managed account offerings. Broker-dealers and registered investment advisers adapt to distinct regulatory frameworks, and disclosures seek to clarify standards of conduct in ways clients can compare. As automation diffuses across onboarding, rebalancing, and reporting, cost-to-serve declines, and that supports broader adoption across the United States securities brokerage market.
By Client Type: Retail Leads, Sustains Momentum
Retail investors held 61.4% of activity in 2025 and are projected to grow the fastest at a 9% CAGR through 2031, as mobile experiences, low-friction funding, and fractional access keep participation consistent across market cycles. Retail trading maintained a 20-35% daily volume contribution in 2025, which deepened single-name and options liquidity on mainstream venues. This cohort’s growth is also influenced by advisory transparency under Reg BI and the expansion of educational content, which improves financial literacy and portfolio resilience over time.
High-net-worth and institutional segments remain important to execution quality, product breadth, and prime services economics. Institutional participation drives demand for algorithmic execution, securities lending, and cross-margin capabilities, while high-net-worth clients require bespoke planning and access to alternatives. Broker-dealers optimize their service models across segments, with scale platforms deploying tiered offerings that maintain consistency in supervision and reporting. This segmentation supports balanced growth and resilience across the United States securities brokerage market.
Geography Analysis
The South held a 35.4% share in 2025, helped by wealth migration to tax-advantaged states and business relocations that expanded the local client base for wealth and brokerage services. Regional hubs in Florida and Texas attracted asset flows and platform expansion, while advisory firms scaled up in fast-growing metros to support new client acquisition. The regulatory environment and operating costs favor growth in several Southern states, and that supports branch and talent expansion plans. The South’s share in the United States securities brokerage market reflects this combination of migration trends, business climate, and ongoing digital adoption that enables remote service delivery. The region’s exposure to climate and infrastructure risks remains an operational planning factor for business continuity and data protection.
The West accounted for a roughly 28% share in 2025 and is projected to post the fastest regional growth at a 6.6% CAGR over 2026-2031. Technology-sector wealth in California and the Pacific Northwest, combined with concentrated equity compensation, continues to drive demand for planning, diversification, and derivatives-based hedging. Innovation hubs also accelerate the adoption of tokenized instruments, digital assets, and advanced analytics, which are increasingly integrated with traditional brokerage workflows. California’s privacy rules add compliance complexity that firms harmonize with federal privacy expectations under Regulation S-P. Some players balance cost pressures by expanding in neighboring states that offer lower operating expenses while retaining client coverage in core West Coast markets.
The Northeast held about a 24% share in 2025 and serves as the primary nexus for capital markets infrastructure, with clearing, custody, and exchange operations anchoring the region. DTCC reported large volumes through New York operations in 2024, which supports leadership in post-trade modernization and tokenization pilots that are advancing into 2026. The region’s dense advisor, asset management, and institutional client base supports a deep bench of expertise in quantitative strategies and regulatory technology. Regulatory oversight remains pronounced, and state rules in New York complement federal oversight with strict cyber and AML expectations. Despite gradual migration to lower-tax states, the Northeast remains pivotal in shaping standards, technology adoption, and market structure within the United States securities brokerage market.
Competitive Landscape
Consolidation has reduced the number of registered broker-dealers and concentrated assets under administration among large platforms, with 2024 data showing a smaller firm count alongside a high concentration of industry assets. Scaled players have executed major acquisitions and onboarded large asset bases, which created network advantages in product breadth, pricing, and technology. A leading electronic broker reported 32% account growth and higher commission revenue in 2025, helped by strong options and futures volumes, while net interest income benefited from larger margin balances. These moves underline how scale, cost of capital, and engineering depth define competitiveness across the United States securities brokerage market.
Business models continue to rotate toward fee-based advisory, interest income, and diversified trading revenue as commission contributions decline in the overall mix. Best execution, order routing transparency, and potential changes to market-structure rules remain under review, and firms have adapted to the current framework as regulatory agendas evolve. At the same time, T+1 settlement, tokenization pilots, and real-time payments are modernizing post-trade workflows and client funding, which reduces friction and supports higher engagement. Cybersecurity and privacy obligations continue to rise, and these costs reinforce scale advantages that allow larger firms to spread fixed expenses across broader revenue bases.
Technology capabilities are now central to differentiation, with AI-enabled analytics, client communication aids, and automated documentation used by leading wealth platforms in 2025 and 2026. Morgan Stanley deployed AI support for advisor meetings to streamline documentation and compliance evidence, while other institutions embedded agentic workflows for rebalancing and supervisory checks. Asset managers advanced AI copilots within portfolio systems and analytics dashboards, which improve narrative generation and stress testing for client reporting. Custody and brokerage providers also enabled tokenized product access and stablecoin rails for faster funding, which shows how digital asset infrastructure is becoming complementary rather than separate from traditional services. These investments reinforce competitive positions as the United States securities brokerage market scales on modern infrastructure.
United States Securities Brokerage Industry Leaders
Charles Schwab
Fidelity Investments
Robinhood Markets
Interactive Brokers
Morgan Stanley Wealth Management
- *Disclaimer: Major Players sorted in no particular order

Recent Industry Developments
- April 2026: Charles Schwab has announced the launch of Schwab Crypto, a spot crypto trading platform set for a phased rollout to retail clients in the coming weeks. The platform will enable direct trading of bitcoin and ethereum, supported by educational resources and professional guidance, offered at competitive pricing.
- January 2026: Interactive Brokers has introduced stablecoin funding for brokerage accounts, enabling eligible clients to deposit funds and access trading in traditional securities across 170 global markets within minutes. The service operates continuously, including weekends and holidays.
- January 2026: The NYSE announced development of a trading platform for tokenized securities that targets 24/7 access, fractional ownership, and near-instant settlement, aligned with the SEC’s January 2026 clarification of tokenized securities taxonomy.
- July 2025: The GENIUS Act established a federal framework for payment stablecoins and designated issuers as financial institutions under the Bank Secrecy Act, with implications for broker-dealers that integrate stablecoin rails for funding and settlement.


United States Securities Brokerage Market Report Scope
Securities brokerage means brokering or representing any person in the purchase, sale, or exchange of securities in the normal course of business in consideration of a commission, fee, or other remuneration therefrom. A complete background analysis of the United States securities brokerage market is covered in the report, which includes an assessment of the economy, a market overview, market size estimation for key segments, emerging trends in the market, market dynamics, and key company profiles.
The United States securities brokerage market is segmented by type, by mode, and by type of establishment. By type, the market is sub-segmented into derivatives and commodities brokerage, stock exchanges, bond brokerage, equities brokerage, and other stock brokerage. By mode, the market is sub-segmented into online and offline. By type of establishment, the market is sub-segmented into exclusive brokers, banks, investment firms, other types of establishments. The report offers market size and forecasts for the United States securities brokerage market in terms of value (USD) for all the above segments.
| Bonds |
| Stocks |
| Treasury Notes |
| Derivatives |
| Others (ETFs, Mutual Funds) |
| Stock |
| Insurance |
| Mortgage |
| Real Estate |
| Forex |
| Leasing |
| Others (Commodities) |
| Full-Service |
| Discount |
| Online |
| Robo Advisor |
| Broker-Dealers |
| Retail |
| High Net Worth Individuals |
| Institutional |
| Small & Mid-Sized Enterprises |
| Northeast |
| Midwest |
| South |
| West |
| By Type of Security | Bonds |
| Stocks | |
| Treasury Notes | |
| Derivatives | |
| Others (ETFs, Mutual Funds) | |
| By Type of Brokerage Service | Stock |
| Insurance | |
| Mortgage | |
| Real Estate | |
| Forex | |
| Leasing | |
| Others (Commodities) | |
| By Type of Service | Full-Service |
| Discount | |
| Online | |
| Robo Advisor | |
| Broker-Dealers | |
| By Client Type | Retail |
| High Net Worth Individuals | |
| Institutional | |
| Small & Mid-Sized Enterprises | |
| By Geography | Northeast |
| Midwest | |
| South | |
| West |


Key Questions Answered in the Report
What is the United States securities brokerage market size and growth outlook to 2031?
The United States securities brokerage market size was USD 673.5 billion in 2025 and is estimated to rise from USD 707.6 billion in 2026 to USD 906.2 billion by 2031, at a 5.07% CAGR over 2026-2031.
Which client segment leads activity in the United States securities brokerage market?
Retail clients led with 61.4% share in 2025 and are also projected to grow the fastest at a 9% CAGR through 2031, supported by mobile-first platforms and fractional access.
What is driving operational change across the United States securities brokerage market?
T+1 settlement, tokenization pilots, and real-time payment rails are modernizing post-trade and funding workflows, reducing risk windows and improving liquidity usage.
Which service and product categories are expanding the fastest in this space?
Robo advisor platforms are projected to grow at a 15.2% CAGR and derivatives at a 9.2% CAGR over 2026-2031, reflecting broader adoption of automation and options strategies.
How are regulations shaping business models in the United States securities brokerage market?
Regulation Best Interest, Form CRS, and data privacy rules are accelerating the pivot to advisory revenue, stronger conflict mitigation, and enhanced client disclosures.
What are the key risks brokerages are watching in 2026?
Record margin debt levels, rising cybersecurity costs, and continuous compliance demands are the main headwinds that pressure operating margins and risk controls.
Page last updated on:


