Market Overview
| Study Period | 2020 - 2031 |
|---|---|
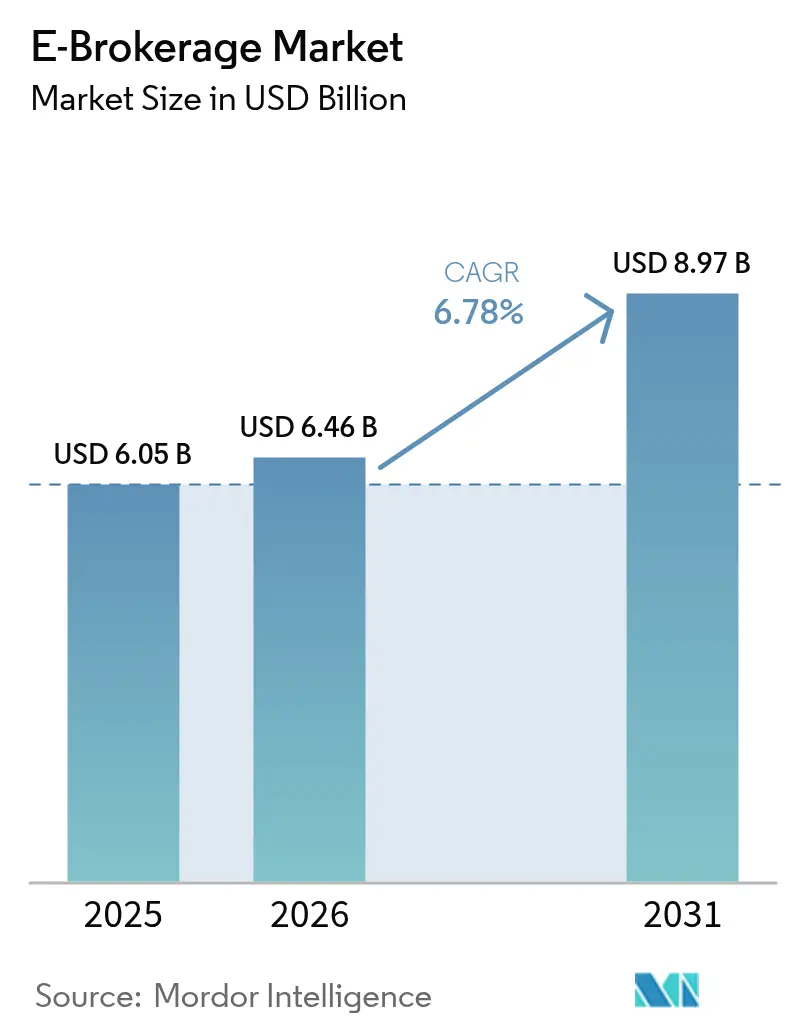
| Market Size (2026) | USD 6.46 Billion |
| Market Size (2031) | USD 8.97 Billion |
| Growth Rate (2026 - 2031) | 6.78% CAGR |
| Fastest Growing Market | Asia Pacific |
| Largest Market | North America |
| Market Concentration | Medium |
Major Players *Disclaimer: Major Players sorted in no particular order Image © Mordor Intelligence. Reuse requires attribution under CC BY 4.0. | |
E-Brokerage Market Analysis by Mordor Intelligence
The E-Brokerage market size is expected to grow from USD 6.05 billion in 2025 to USD 6.46 billion in 2026 and is forecast to reach USD 8.97 billion by 2031 at 6.78% CAGR over 2026-2031.
Mobile-first design, zero-commission pricing, and rapid digital onboarding continue to redirect investor traffic from legacy full-service houses toward streamlined apps that promise low friction and intuitive interfaces. Scale efficiencies gained through cloud infrastructure and artificial-intelligence-driven order routing reduce operating costs and allow leading platforms to widen their product suites without raising headline fees. At the same time, regulators intensify scrutiny of payment-for-order-flow (PFOF) income, cybersecurity lapses, and settlement cycles, introducing execution risks that can alter competitive positioning. Shifting consumer demographics, notably a younger cohort comfortable with fractional investing and community features, strengthen recurring engagement and help sustain the medium-term growth trajectory of the e-brokerage market.
Key Report Takeaways
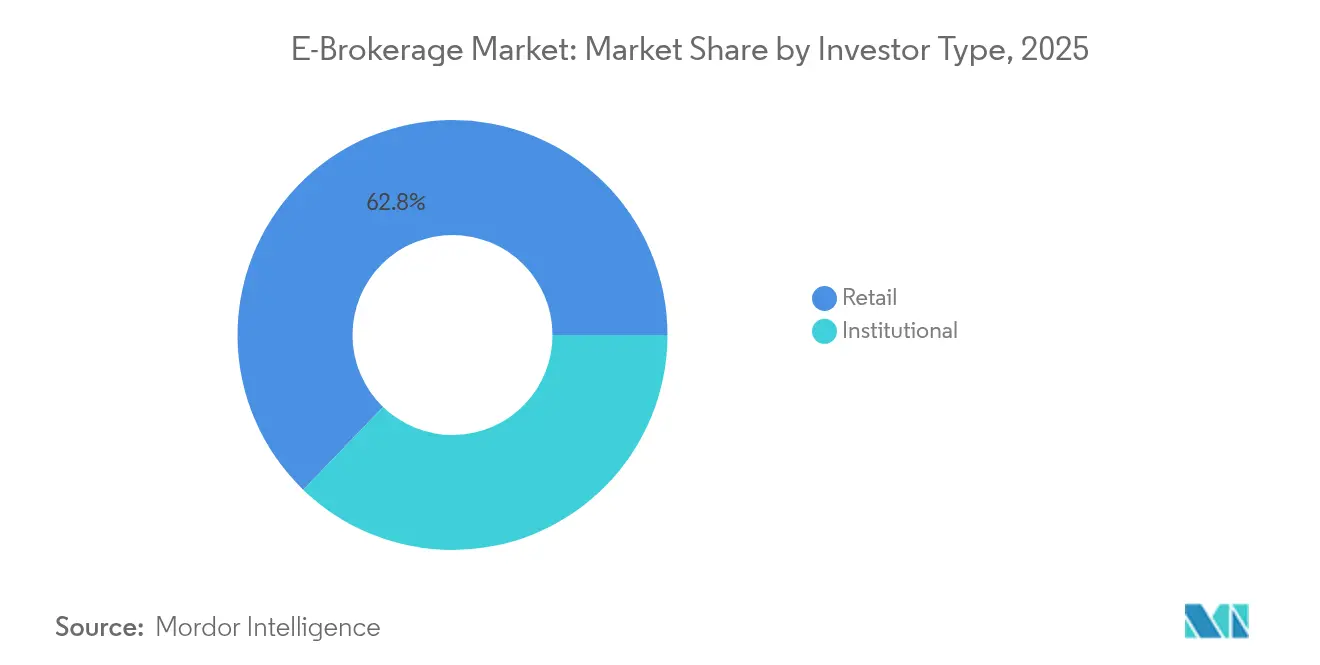
- By investor type, retail investors controlled 62.78% of the e-brokerage market share in 2025 and are expanding at an 11.05% CAGR through 2031.
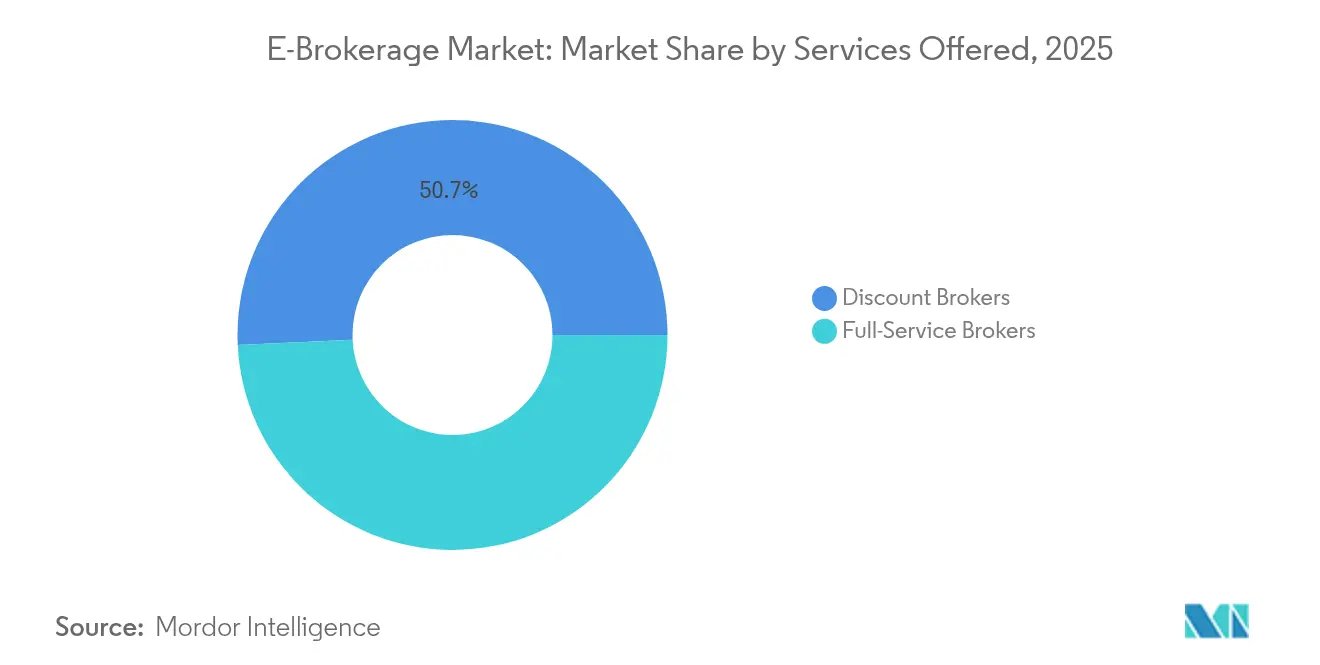
- By services offered, discount brokers led with 50.74% share of the e-brokerage market size in 2025, while robo-advisory services are advancing at a 11.72% CAGR to 2031.
- By operation, domestic trading held 67.62% share of the e-brokerage market size in 2025; foreign operations recorded the highest projected CAGR at 12.88% through 2031.
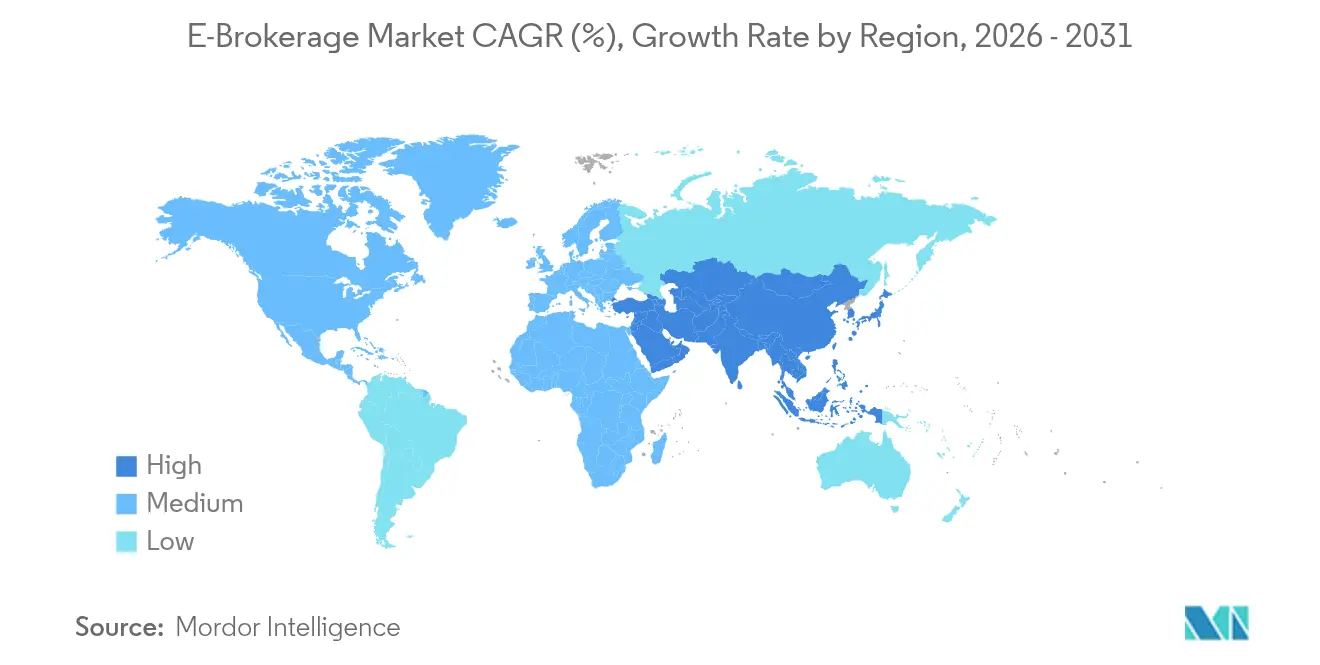
- By geography, the Asia-Pacific region is projected to post the fastest 14.35% CAGR through 2031, while North America remains the largest regional revenue contributor at 40.88% in 2025
Note: Market size and forecast figures in this report are generated using Mordor Intelligence’s proprietary estimation framework, updated with the latest available data and insights as of 2026.
Global E-Brokerage Market Trends and Insights
Drivers Impact Analysis*
| Driver | (~) % Impact on CAGR Forecast | Geographic Relevance | Impact Timeline |
|---|---|---|---|
| Rising smartphone penetration enabling mobile trading | +2.1% | Global, strongest in APAC and emerging markets | Medium term (2-4 years) |
| Lower brokerage fees due to intense price competition | +1.8% | North America, Europe, global diffusion | Short term (≤ 2 years) |
| Growing retail-investor appetite post-pandemic | +1.5% | North America, Europe, expanding to APAC | Medium term (2-4 years) |
| Regulatory push for seamless e-KYC and digital onboarding | +1.2% | APAC, MEA, EU T+1 settlement | Long term (≥ 4 years) |
| Integration of AI-driven robo-advisory within trading apps | +0.8% | North America, Europe, APAC next | Long term (≥ 4 years) |
| Fractional-share and micro-investing features broadening access | +0.6% | Global, emerging-market focus | Medium term (2-4 years) |
| Source: Mordor Intelligence | |||


Rising Smartphone Penetration Enabling Mobile Trading
Smartphone adoption supplies the hardware backbone for real-time trading and portfolio tracking, especially in economies where mobile broadband leapfrogs desktop infrastructure. Trade Republic has eight million European clients, underscoring the capacity of app-centric platforms to capture large user bases with minimal branch overhead. Younger investors gravitate to swipe-friendly order tickets, biometric login, and push-notification alerts that preserve attention spans and encourage frequent engagement. In Brazil, Webull’s promotional dollar-denominated yields specifically target mobile users, highlighting how platforms customize incentives for local conditions. Mobile interfaces also compress customer-acquisition cost because digital referrals and viral features outpace traditional advertising channels. As underbanked populations come online, the e-brokerage market gains incremental volume from first-time investors who bypass desktop trading entirely.
Lower Brokerage Fees Due to Intense Price Competition
The race to zero commissions has redefined baseline economics in the e-brokerage market, shifting monetization toward PFOF, securities lending, and subscription bundles. The European Union’s looming ban on PFOF from 2026 forces brokers to innovate with tiered membership plans and asset-based advisory fees[1]Fin-tech desk, “EU Payment-for-Order-Flow Ban Takes Effect 2026,” Financial Times, ft.com.. Trade Republic’s launch of junior custody accounts illustrates how platforms pursue lifetime customer value by onboarding clients at younger ages. In North America, Schwab offsets lost commission revenue by expanding into cash-management spreads and proprietary ETF offerings [2]“Post-TD Ameritrade Integration Progress Report,” Charles Schwab, aboutschwab.com. . Competitive pricing spurs continuous upgrades in analytic dashboards, social-trading overlays, and thematic baskets since differentiation can no longer rely on headline cost. As margins narrow, only providers with robust technology scale and diversified revenue pipelines retain pricing flexibility without impairing profitability.
Growing Retail-Investor Appetite Post-Pandemic
Lockdowns shifted discretionary time toward financial experimentation, and many first-time traders have matured into habitual equity investors. India’s Groww captured 25% domestic app downloads after its 2024 campaign linking investment narratives to popular culture. Community features embedded by platforms such as eToro transform solitary stock picking into participatory learning, thereby extending user retention beyond volatile trading moments. Retail users elevate demand for bite-sized educational clips, ESG scoring widgets, and automated tax documents that simplify compliance. Fractional shares and recurring investment plans further enlarge ticket sizes without imposing high capital thresholds. Sustained engagement lifts order flow and balances cyclical lulls, supporting an upward volume baseline for the e-brokerage market.
Regulatory Push for Seamless e-KYC and Digital Onboarding
National regulators promote digital identity standards to curb money-laundering risks while accelerating financial inclusion. China’s one-hour breach notification rule exemplifies tighter oversight that mandates real-time reporting infrastructure, pushing brokers toward automated surveillance and predictive risk flagging. In the European Union, the T+1 settlement migration requires straight-through processing workflows and robust back-office automation[3]Press Office, “ESMA Final Report on T+1 Settlement,” European Securities and Markets Authority, esma.europa.eu. . Simplified e-KYC lowers onboarding friction, cutting verification time to minutes and allowing platforms to scale internationally without a brick-and-mortar presence. Increased standardization also supports passporting rights, reducing duplicate checks when clients invest across borders. Over time, platforms with enterprise-grade compliance engines gain a regulatory moat that smaller rivals struggle to match.
Restraints Impact Analysis*
| Restraint | (~) % Impact on CAGR Forecast | Geographic Relevance | Impact Timeline |
|---|---|---|---|
| Escalating cybersecurity & fraud incidents on trading platforms | −1.4% | Global, high alert in North America and Europe | Short term (≤ 2 years) |
| Regulatory uncertainty around payment-for-order-flow models | −0.9% | North America, Europe focus | Medium term (2-4 years) |
| Latency-sensitive HFT demand straining retail infrastructures | −0.7% | Developed markets with active HFT | Short term (≤ 2 years) |
| Digital divide in emerging markets limiting platform adoption | −0.5% | APAC, MEA, Latin America | Long term (≥ 4 years) |
| Source: Mordor Intelligence | |||
Escalating Cybersecurity & Fraud Incidents on Trading Platforms
A high-profile data breach at several Canadian brokerages in 2024 exposed millions of client credentials and intensified public scrutiny of platform resilience. Phishing attacks that impersonate well-known brokers proliferate across social media, exploiting inexperienced investors through cloned apps. Compliance departments now mandate multi-factor authentication, biometric checks, and behavioural analytics scoring as default protocols. The resulting cost outlay redirects capital from product innovation toward defensive tooling, squeezing smaller platforms’ operating margins. Persistent threat vectors raise the Specter of regulatory penalties and class-action litigation, which could erode brand equity and slow user acquisition across the e-brokerage market.
Regulatory Uncertainty Around Payment for Order Flow Models
U.S. lawmakers debated enhanced disclosures for PFOF after meme-stock volatility, and the Securities and Exchange Commission’s proposed rule may cap rebates or require auction mechanisms. In Europe, the outright ban, effective 2026, eliminates a primary income stream for discount brokers, forcing experimentation with flat-fee subscriptions, higher margin-lending spreads, and premium analytics tiers. Business-model fragility could trigger consolidation as sub-scale brokers seek protective mergers with cash-flow-rich incumbents. Larger players hedge by emphasizing diversified revenue such as advisory fees, asset-management products, and cash sweep programs. Uncertainty remains an overhang on investor sentiment and may temper near-term valuation multiples for listed e-brokerage stocks.
*Our forecasts treat driver/restraint impacts as directional, not additive. The impact forecasts reflect baseline growth, mix effects, and variable interactions.
Segment Analysis
By Investor Type: Retail Dominance Drives Platform Innovation
Retail accounts held a 62.78% share of the e-brokerage market in 2025 and are forecast to maintain an 11.05% CAGR through 2031 as mobile-centric platforms widen their reach. The segment’s momentum builds on fractional shares, social-trading feeds, and bite-sized educational modules that simplify equity participation for novices. Gamified interfaces convert small, frequent trades into habitual behaviour, generating high engagement metrics that attract advertisers and product partnerships. Meanwhile, institutional investors concentrate order flow among fewer complex-order-capable platforms, securing negotiable commission tiers that preserve wallet share despite lower headcount. Suitability tests required under MiFID II and comparable rules compel retail-focused brokers to embed risk quizzes and automated warnings that institutional desks can omit.
Growing adoption of thematic baskets and ESG filters further differentiates retail propositions, enabling users to align portfolios with personal values without mastering security selection. Conversely, institutional platforms enhance latency and smart-order routing to manage algorithmic execution and dark-pool access. Cross-selling between segments remains minimal due to divergent service expectations, though a handful of brokers deploy tiered dashboards that unlock advanced analytics once account value surpasses defined thresholds. Retail segment expansion enlarges liquidity pools, reducing bid-ask spreads and indirectly benefiting institutional trading quality. The combined dynamics keep the e-brokerage market vibrant and customer-centric as user expectations evolve.


By Services Offered: Robo-Advisory Disrupts Traditional Models
Discount brokers dominated 50.74% of 2025 service revenue, yet robo-advisory offerings exhibit a 11.72% CAGR, the fastest within the e-brokerage market. Algorithm-driven portfolios automate rebalancing, tax-loss harvesting, and risk drift control, democratizing capabilities once reserved for high-fee managers. Full-service houses respond by launching hybrid programs that marry human planners with digital dashboards, safeguarding relationships with affluent clients seeking nuanced estate planning. Regulatory clarity evolves as agencies acknowledge AI-generated advice under investment-advisor rules, mandating disclosures about model assumptions and algorithm testing.
The regulatory landscape influences service differentiation, with robo-advisors subject to investment advisor regulations that require fiduciary duty compliance, while discount brokers operate under less stringent broker-dealer frameworks. Origin's SEC-regulated AI advisor launch exemplifies the regulatory evolution toward recognizing automated investment advice as a legitimate financial service. Full-service brokers leverage human advisor relationships for complex financial planning and tax optimization, while discount platforms focus on execution efficiency and cost minimization. The convergence of these models through technology integration suggests future market structure will emphasize hybrid approaches that combine automated portfolio management with human oversight for complex situations.
By Operation: Cross-Border Trading Accelerates
Domestic operations maintain 67.62% market share in 2025, yet foreign operations grow faster at 12.88% CAGR, driven by regulatory harmonization and investor demand for international diversification. Interactive Brokers' global platform architecture enables seamless cross-border trading, while regional specialists like Saxo Bank expand beyond European home markets to capture international investment flows. The growth in foreign operations reflects both platform expansion into new geographic markets and existing customers seeking international exposure through ADRs, global ETFs, and direct foreign equity access. Regulatory complexity remains a barrier, as platforms must navigate multiple jurisdictions' compliance requirements while managing currency risk and settlement procedures.
Technology infrastructure investments enable platforms to offer international trading capabilities without establishing physical presence in each market, reducing expansion costs while maintaining regulatory compliance through partnerships with local custodians and clearing firms. The European Union's T+1 settlement timeline by 2027 harmonizes cross-border trading efficiency, while Asia-Pacific markets increasingly adopt similar standards to attract international capital. Domestic-focused platforms face competitive pressure as customers demand international investment options, forcing expansion of product offerings or partnership arrangements with global platforms to retain client assets.
Geography Analysis
North America commands 40.88% market share in 2025 while growing at a significant CAGR through 2031, reflecting market maturity as zero-commission trading becomes standard across major platforms. The region's growth stems from robo-advisory adoption and fractional share investing, with Charles Schwab's post-TD Ameritrade integration creating scale advantages in technology infrastructure and customer service. Robinhood's transformation into a full-stack fintech platform through the TradePMR acquisition for USD 300 million demonstrates the evolution beyond simple trading toward comprehensive financial services. The Securities and Exchange Commission's enhanced oversight of payment-for-order-flow arrangements creates regulatory uncertainty that could reshape revenue models, while the Commodity Futures Trading Commission's pathway for offshore crypto exchanges expands trading opportunities.
Asia-Pacific achieves the fastest regional growth at 14.35% CAGR, led by India's discount brokerage revolution and Japan's robo-advisory adoption. Zerodha's USD 1 billion (₹8,320 crore) revenue and USD 566 million (INR 4,700 crore) profit in FY24 validate the zero-brokerage model's profitability at scale, while Groww's IPO filing reflects the segment's institutional maturation. Japan's wealth management transformation accelerates through MUFG's WealthNavi acquisition and SBI Holdings' tokenized stock initiatives with Startale, demonstrating institutional commitment to digital investment platforms. China's 1-hour cybersecurity incident reporting mandate reflects regulatory emphasis on platform security, while Southeast Asian markets benefit from smartphone penetration and regulatory digitization efforts.
Europe maintains steady growth despite facing payment-for-order-flow prohibition by 2026, with platforms adapting through alternative revenue models and geographic expansion. Trade Republic's achievement of 8 million customers and USD 107 billion (EUR 100 billion) assets under management validates the mobile-first approach, while expansion across European markets demonstrates the scalability of app-centric trading platforms. eToro's virtual reality trading application launch and German crypto approval showcase innovation in user experience and regulatory navigation. The European Securities and Markets Authority's T+1 settlement timeline harmonizes cross-border trading efficiency while reducing operational risk, benefiting platforms with pan-European operations over domestic-focused competitors.

Competitive Landscape
The e-brokerage market displays a moderate level of concentration, with a handful of dominant players alongside a broad mix of regional firms and emerging platforms. The industry is shaped by trends like mobile-first user acquisition, zero-commission pricing models, and AI-driven personalization. Platforms distinguish themselves through features such as social trading, fractional share investing, and embedded financial tools. Charles Schwab uses its expanded scale from recent acquisitions to grow its physical presence and enhance digital offerings, including crypto services. Meanwhile, Robinhood is evolving from a low-cost brokerage into a full-service fintech platform through targeted acquisitions and broader product offerings.
As competition intensifies, traditional lines between discount brokers, robo-advisors, and full-service wealth managers are becoming increasingly blurred. This has driven a race for innovation, particularly in user experience and platform integration. White-space opportunities are emerging in areas like embedded finance through super-apps and tokenized trading platforms. Companies such as SBI Holdings and MercadoLibre demonstrate how strategic use of blockchain and fintech ecosystems can redefine market leadership. These developments create space for both newcomers and incumbents to explore fresh growth avenues.
New disruptors are targeting underserved market segments using tools like micro-investing and community-driven social trading. In response, established firms are adopting acquisition strategies and forming partnerships to stay competitive. Regulatory filings show a growing focus on technology investment, especially in cybersecurity and artificial intelligence. These capabilities are becoming key differentiators in platform performance and client trust. Strong compliance infrastructures are also proving essential, particularly for firms aiming to expand internationally or attract institutional investors.
E-Brokerage Industry Leaders
Charles Schwab
Robinhood Markets
Fidelity Investments
Interactive Brokers
TD Ameritrade (Morgan Stanley)
- *Disclaimer: Major Players sorted in no particular order


Recent Industry Developments
- May 2025: LPL Financial acquired Commonwealth Financial Network for USD 2.7 billion, consolidating the registered investment advisor market and creating an enhanced technology infrastructure for independent financial advisors. This transaction reflects ongoing consolidation among wealth management platforms seeking scale advantages.
- September 2024: – Robinhood Markets acquired TradePMR for USD 300 million, expanding into registered investment advisor services and targeting high-net-worth clients through comprehensive wealth management capabilities. This acquisition represents Robinhood's strategic evolution from a discount broker to a full-stack financial services platform.
- August 2024: MUFG completed its acquisition of WealthNavi for over USD 660 million, marking Japan's largest robo-advisory transaction and demonstrating institutional commitment to automated investment management. The deal validates the robo-advisory business model's scalability and profitability potential in developed markets.
- May 2024: StoneX Group acquired R.J. O'Brien & Associates for USD 900 million, expanding futures and commodities trading capabilities while strengthening institutional client services. This acquisition enhances multi-asset trading platform offerings for sophisticated investors.


Global E-Brokerage Market Report Scope
An online broker, on the other hand, is a broker that interacts with clients over the Internet, rather than in person. An online brokerage is a brokerage that clients go to, rather than a physical brokerage office. Because the overhead costs associated with a physical brokerage office are higher than those associated with an online brokerage, online brokers charge lower fees. The E-brokerage Market is segmented by Client (Retailers, Institutional), by Services Provided (Full Time Brokers, Discounted Brokers), by Ownership (Privately Held, Publicly Held), and by Geography (North America, Europe, Asia-Pacific, South America, Middle East and Africa). The report offers market size and forecast values for the E-Brokerages Market in USD million for the above segments.
By Investor Type
| Retail |
| Institutional |
By Services Offered
| Full-Service Brokers |
| Discount Brokers |
By Operation
| Domestic |
| Foreign |
By Geography
| North America | Canada |
| United States | |
| Mexico | |
| South America | Brazil |
| Peru | |
| Chile | |
| Argentina | |
| Rest of South America | |
| Europe | United Kingdom |
| Germany | |
| France | |
| Spain | |
| Italy | |
| BENELUX (Belgium, Netherlands, Luxembourg) | |
| NORDICS (Denmark, Finland, Iceland, Norway, Sweden) | |
| Rest of Europe | |
| Asia-Pacific | India |
| China | |
| Japan | |
| Australia | |
| South Korea | |
| South East Asia (Singapore, Malaysia, Thailand, Indonesia, Vietnam, and Philippines) | |
| Rest of Asia-Pacific | |
| Middle East & Africa | United Arab Emirates |
| Saudi Arabia | |
| South Africa | |
| Nigeria | |
| Rest of Middle East & Africa |
| By Investor Type | Retail | |
| Institutional | ||
| By Services Offered | Full-Service Brokers | |
| Discount Brokers | ||
| By Operation | Domestic | |
| Foreign | ||
| By Geography | North America | Canada |
| United States | ||
| Mexico | ||
| South America | Brazil | |
| Peru | ||
| Chile | ||
| Argentina | ||
| Rest of South America | ||
| Europe | United Kingdom | |
| Germany | ||
| France | ||
| Spain | ||
| Italy | ||
| BENELUX (Belgium, Netherlands, Luxembourg) | ||
| NORDICS (Denmark, Finland, Iceland, Norway, Sweden) | ||
| Rest of Europe | ||
| Asia-Pacific | India | |
| China | ||
| Japan | ||
| Australia | ||
| South Korea | ||
| South East Asia (Singapore, Malaysia, Thailand, Indonesia, Vietnam, and Philippines) | ||
| Rest of Asia-Pacific | ||
| Middle East & Africa | United Arab Emirates | |
| Saudi Arabia | ||
| South Africa | ||
| Nigeria | ||
| Rest of Middle East & Africa | ||


Key Questions Answered in the Report
How large is the e-brokerage market in 2026?
The e-brokerage market size is USD 6.46 billion in 2026.
What is the projected CAGR for global e-brokerage between 2026 and 2031?
The market is forecast to grow at a 6.78% CAGR through 2031.
Which region expands the fastest over the forecast period?
Asia-Pacific leads with a 14.35% CAGR driven by discount brokerage adoption.
How will the EU PFOF ban affect brokers?
Brokers must pivot toward subscription fees and value-added services to replace lost PFOF income from 2026 onward.
What technology trend most influences platform strategy?
AI-based robo-advisory tools and personalized analytics increasingly shape user engagement and revenue diversification.
Page last updated on:


