Enterprise Routers Market Size and Share
Market Overview
| Study Period | 2020 - 2031 |
|---|---|
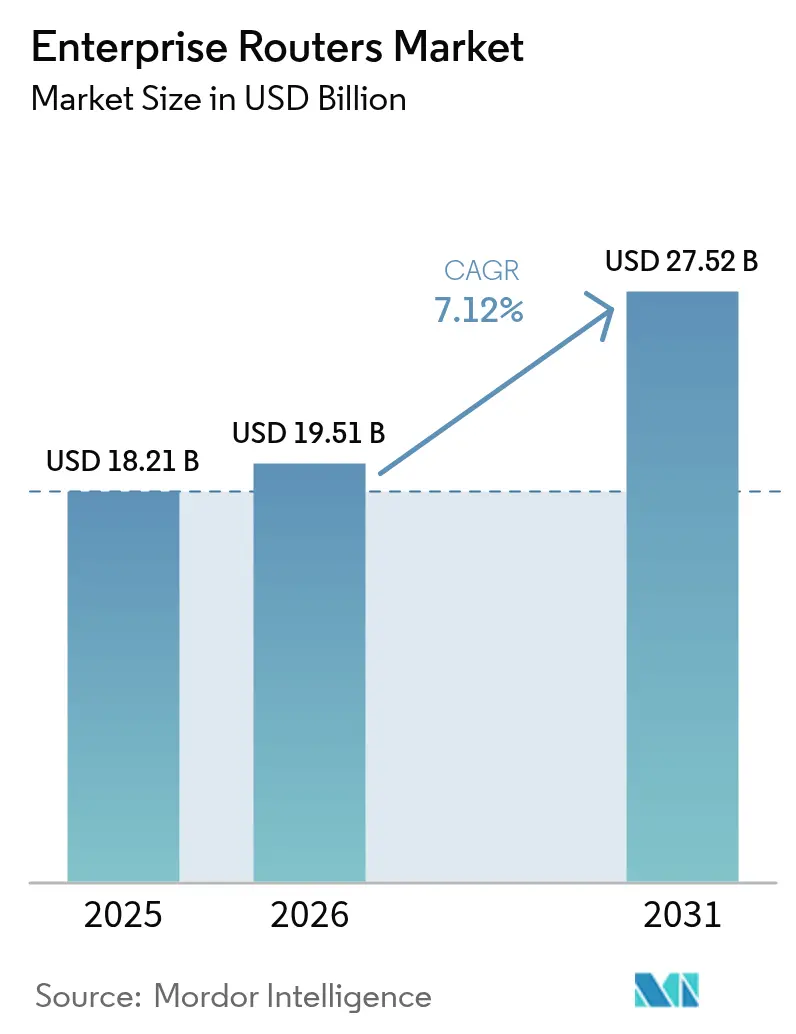
| Market Size (2026) | USD 19.51 Billion |
| Market Size (2031) | USD 27.52 Billion |
| Growth Rate (2026 - 2031) | 7.12% CAGR |
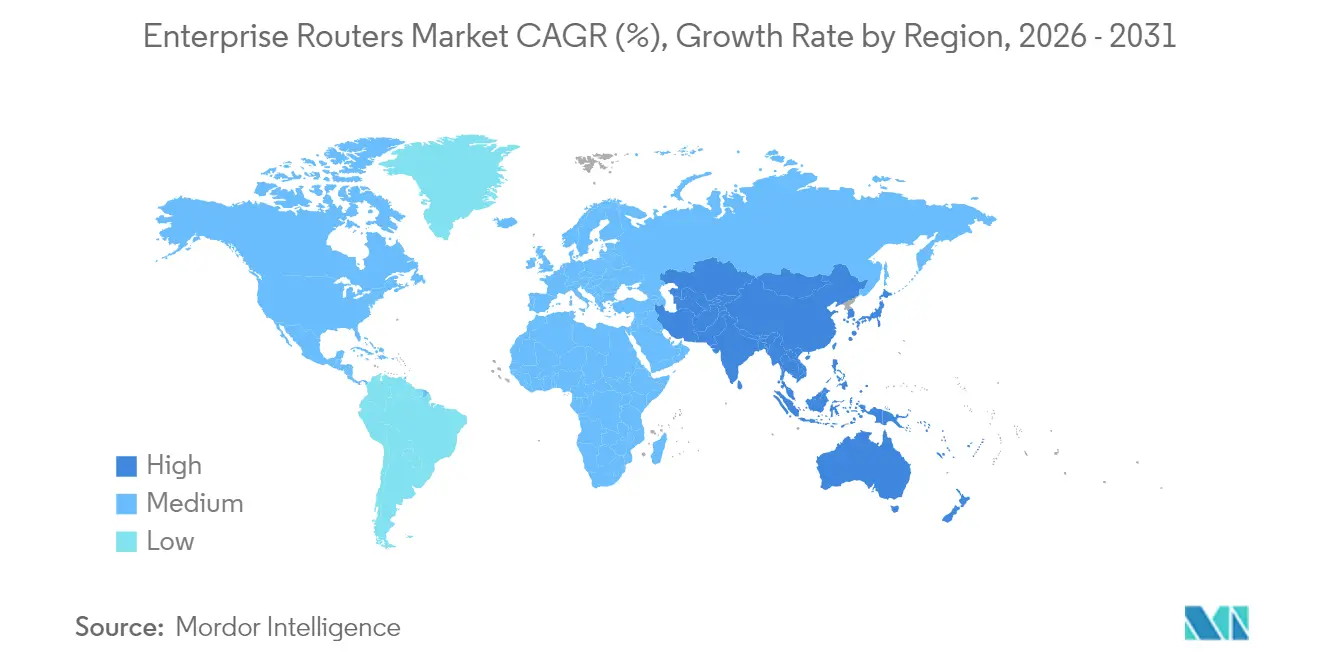
| Fastest Growing Market | Asia Pacific |
| Largest Market | North America |
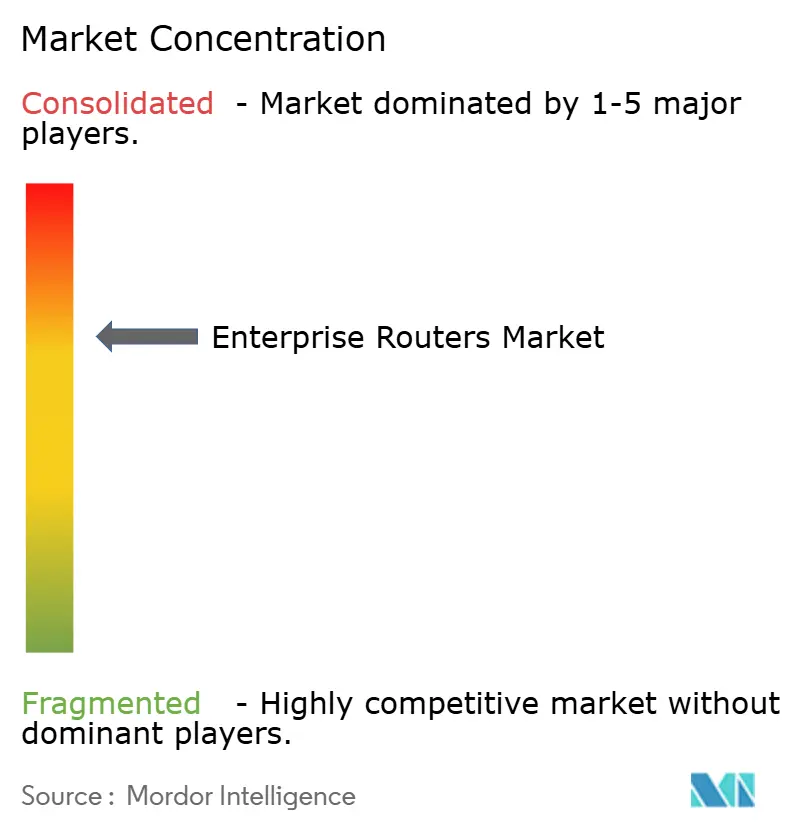
| Market Concentration | Medium |
Major Players *Disclaimer: Major Players sorted in no particular order Image © Mordor Intelligence. Reuse requires attribution under CC BY 4.0. | |
Enterprise Routers Market Analysis by Mordor Intelligence
The enterprise routers market size was valued at USD 18.21 billion in 2025 and estimated to grow from USD 19.51 billion in 2026 to reach USD 27.52 billion by 2031, at a CAGR of 7.12% during the forecast period (2026-2031). Growth reflects enterprises’ shift from legacy WANs to software-defined architectures that support hybrid work, multi-cloud connectivity, and edge intelligence. Wired connectivity continues to anchor critical backbones yet wireless upgrades are accelerating as organizations deploy IoT devices and mobile-first workflows. Consolidation among leading vendors coincides with rising demand for AI-driven automation, energy efficiency, and embedded security, all of which are now viewed as baseline purchase criteria rather than premium features. Regionally, North America retains scale advantages, but Asia Pacific’s manufacturing digitization and 5G rollouts are generating the fastest incremental revenue. Midsize enterprises are emerging as influential buyers because SD-WAN and intent-based networking lower both capital and operating costs.
Key Report Takeaways
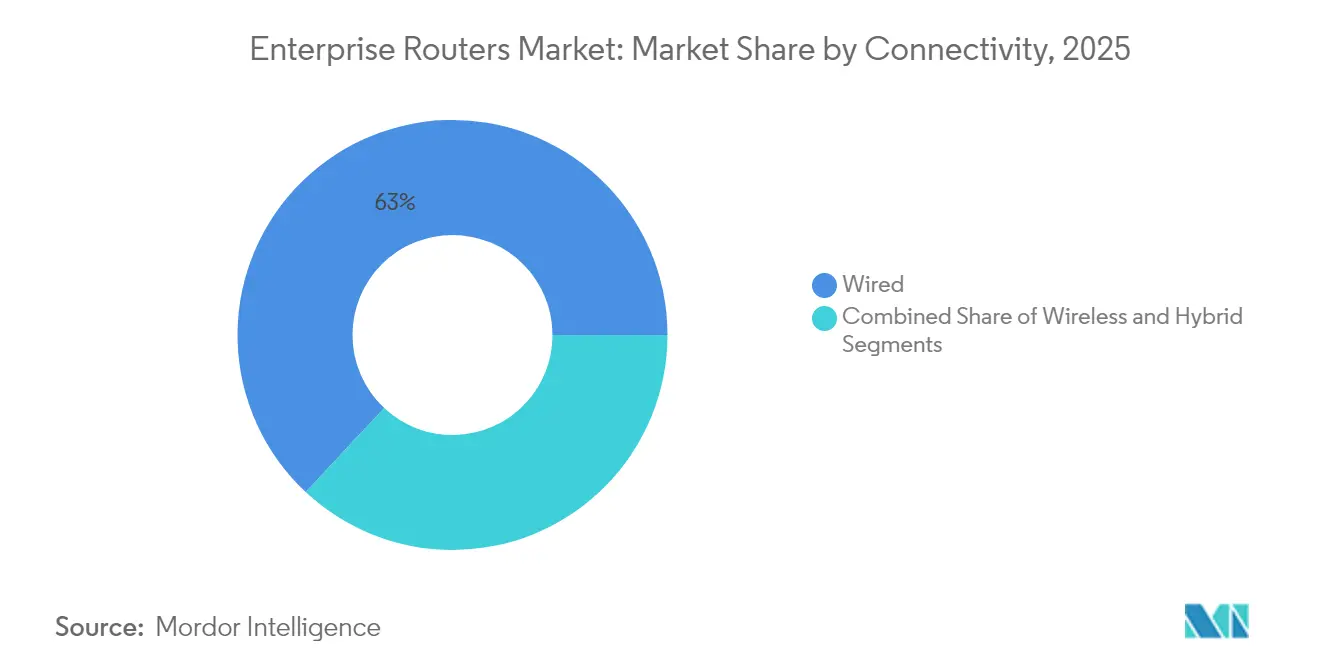
- By connectivity, wired solutions controlled 63.04% of 2025 revenue in the enterprise routers market, while wireless installations are advancing at an 8.53% CAGR through 2031.
- By port density, 9-24-port systems accounted for a 48.10% enterprise routers market share in 2025, whereas configurations above 24 ports are expanding at 8.01% CAGR.
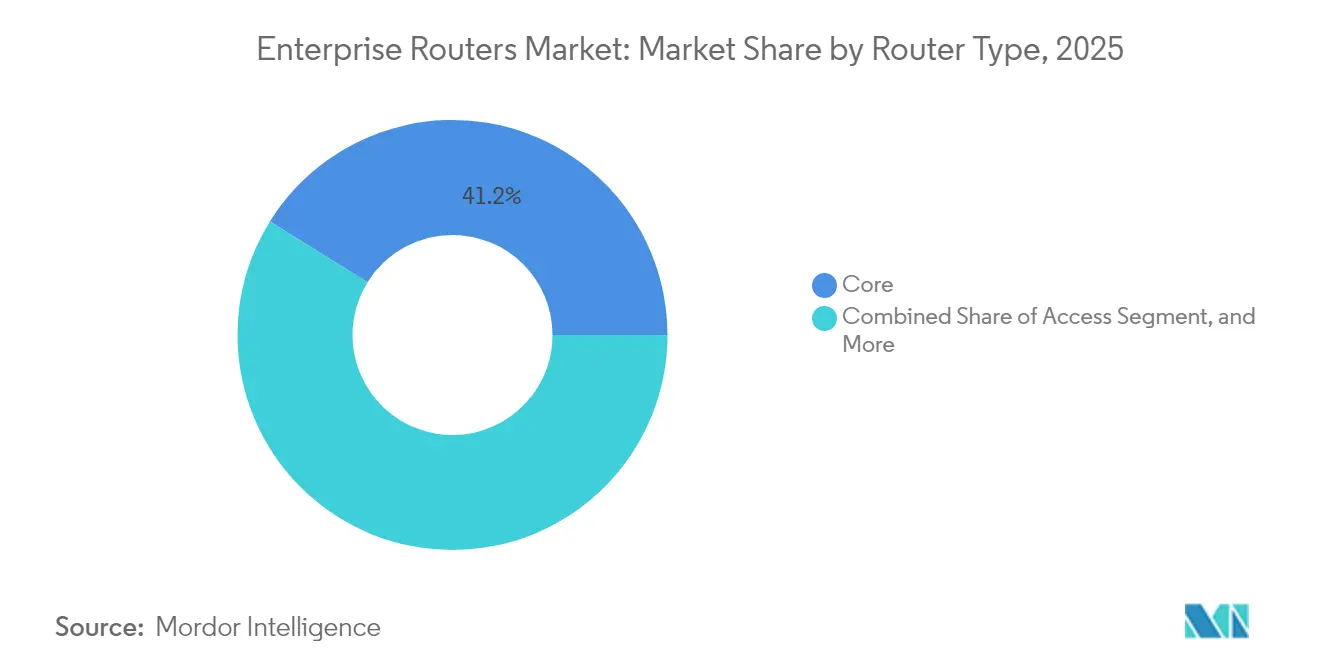
- By router type, core platforms held 41.15% revenue in 2025 in the enterprise routers market; SD-WAN appliances offer the quickest growth at 7.58% CAGR through 2031.
- By end-user industry, IT and Telecom led with 29.25% of 2025 spending in the enterprise routers market, while Retail and E-commerce are set to climb at a 7.55% CAGR to 2031.
- By geography, North America represented 38.40% of global sales in 2025 in the enterprise routers market, yet Asia Pacific is pacing the field with a 7.61% CAGR through 2031.
Note: Market size and forecast figures in this report are generated using Mordor Intelligence’s proprietary estimation framework, updated with the latest available data and insights as of 2026.
Global Enterprise Routers Market Trends and Insights
Drivers Impact Analysis*
| Driver | (~) % Impact on CAGR Forecast | Geographic Relevance | Impact Timeline |
|---|---|---|---|
| Growing SD-WAN adoption | +1.2% | Global, with North America leading adoption | Medium term (2-4 years) |
| Surge in enterprise cloud migration | +0.8% | Global, concentrated in developed markets | Short term (≤ 2 years) |
| Edge-compute traffic explosion | +1.1% | APAC core, spill-over to North America | Long term (≥ 4 years) |
| Sustainability-driven router refresh | +0.9% | Europe and North America regulatory focus | Medium term (2-4 years) |
| AI-driven intent-based networking | +1.0% | Global, early adoption in tech-forward enterprises | Long term (≥ 4 years) |
| Government secure-routing mandates | +0.7% | National security focus, global implementation | Short term (≤ 2 years) |
| Source: Mordor Intelligence | |||
Growing SD-WAN Adoption
Software-defined WAN has altered the economics of wide-area connectivity by minimizing MPLS spend and simplifying policy control. Cisco processed a 15% year-over-year increase in SD-WAN product orders during Q2 2025, bringing its Catalyst SD-WAN customer base above 50,000 enterprises.[1]Cisco Systems, “Cisco Reports Second Quarter Earnings,” cisco.com Mid-market organizations that once deemed enterprise-grade WAN unaffordable can now trim network operating expenses by 30–50% while improving application response through dynamic path selection. Security remains integral as zero-trust principles steer procurement, making integrated firewalls and segmentation table-stakes for router vendors. The momentum is likely to sustain medium-term market expansion because SD-WAN refresh cycles average three to five years, creating repeat demand within the forecast horizon.
Surge in Enterprise Cloud Migration
Enterprises consolidating on-premises data centers by 40% while elevating cloud workload density are re-architecting networks around direct internet access and multi-cloud links.[2]Dell Technologies, “Dell Technologies Reports Third Quarter Fiscal 2025 Financial Results,” dell.com Routers must manage dynamic bandwidth, granular QoS, and automated route policies that honor data-sovereignty rules. Latency-sensitive apps such as real-time analytics are encouraging edge routers that decide traffic flows in milliseconds rather than backhauling packets to centralized gateways. Vendor roadmaps therefore emphasize cloud gateways and API-level orchestration that align route decisions with compute location and compliance tags.
Edge-Compute Traffic Explosion
Industry 4.0 rollouts in manufacturing generate terabytes of sensor data demanding local processing; Siemens has demonstrated selective cloud synchronization models that cut WAN traffic while upholding sub-millisecond control-loop latency.[3]Siemens, “Fiscal 2024 Results,” siemens.com Enterprise routers situated at micro data centers now bundle switching and compute to execute AI inference, handle protocol translation, and enforce zero-trust segmentation. Retail, automotive, and logistics sectors mimic this architecture to power real-time inventory analytics, autonomous vehicle telemetry, and augmented-reality workflows. The need to ingest and analyze data at the edge is converting traditional access routers into converged appliances that add CPUs and accelerators alongside packet-forwarding ASICs.
Sustainability-Driven Router Refresh
Energy efficiency mandates and carbon pricing in Europe and North America have elevated power draw as a decisive buying factor. Cisco’s latest Catalyst 9000 platforms deliver 40% lower consumption yet triple performance density, enabling large enterprises to retire thousands of legacy devices and shrink data-center footprints. Power accounts for 15–20% of IT operating costs for such firms, so the ROI on green networking is immediate. Vendors additionally roll out take-back and refurbishment programs; Juniper’s circular-economy initiative keeps equipment in productive use and diverts e-waste from landfills. Sustainability metrics are now embedded in RFP scorecards, forcing suppliers to publish life-cycle assessments and material traceability records.
Restraints Impact Analysis*
| Restraint | (~) % Impact on CAGR Forecast | Geographic Relevance | Impact Timeline |
|---|---|---|---|
| Persistent supply-chain chip shortages | +0.6% | Global, acute in APAC manufacturing hubs | Short term (≤ 2 years) |
| Skill-gap in programmable networking | +0.3% | Global, concentrated in emerging markets | Medium term (2-4 years) |
| Rising SASE cannibalisation | +0.4% | Global, concentrated in cloud-forward enterprises | Medium term (2-4 years) |
| Open-source white-box disruption | +0.2% | North America and Europe early adoption markets | Long term (≥ 4 years) |
| Source: Mordor Intelligence | |||
Persistent Supply-Chain Chip Shortages
Specialized ASICs powering high-end routing platforms remain in tight supply, stretching lead times to 20-26 weeks and inflating component costs. Enterprises respond by adopting multi-vendor frameworks and committing to longer procurement contracts, yet mission-critical projects still face deferrals. Basic access routers see smaller impact because they can swap in more common merchant silicon, but data-center cores experience acute shortages due to cutting-edge process node dependence.
Rising SASE Cannibalization
Secure Access Service Edge bundles networking and security functions into cloud-delivered subscriptions, reducing the need for branch routers. The SASE segment reached USD 4.2 billion in 2024 and is growing at 24.7% CAGR, siphoning mid-market accounts toward providers like Palo Alto Networks and Zscaler. Large enterprises with regulatory obligations still prefer on-premises routing, tempering cannibalization, yet OEMs are hedging by embedding SASE agents directly into new router lines.
*Our forecasts treat driver/restraint impacts as directional, not additive. The impact forecasts reflect baseline growth, mix effects, and variable interactions.
Segment Analysis
By Connectivity: Wireless Momentum Challenges Wired Dominance
Wired links captured 63.04% of 2025 revenue, underpinning workloads that demand deterministic throughput and strong electromagnetic shielding. Simultaneously, wireless deployments are gaining an 8.53% CAGR as companies pursue flexible floorplans, IoT sensor grids, and campus mobility. Hybrid designs that marry fiber backbones with Wi-Fi 6E access deliver the reliability of cable and the agility of radio, shrinking deployment timelines by up to 60%. Private 5G networks now achieve sub-millisecond latency once reserved for copper links, unleashing industrial robots and autonomous guided vehicles across factory floors.
Enterprises also weigh spectrum governance, interference, and battery life in deciding between Ethernet and wireless endpoints. Wi-Fi 6E’s 6 GHz channels supply 1.2 GHz of fresh spectrum, reducing contention and enabling 160 MHz-wide channels that approximate cabled performance. For disaster recovery, LTE and 5G routers furnish immediate connectivity when terrestrial lines fail, a feature prized by retail chains that cannot tolerate point-of-sale downtime. The enterprise routers market continues to bifurcate: mission-critical segments stay on fiber while edge and branch environments adopt radio first, sustaining parallel demand paths across the forecast horizon.


By Port Density: High-Density Solutions Accelerate Infrastructure Consolidation
Routers with 9–24 ports held a 48.10% enterprise routers market share in 2025, reflecting their role as workhorse aggregation nodes in medium server closets. Yet platforms exceeding 24 ports are expanding at 8.01% CAGR as data-center operators consolidate racks and strive for two-tier leaf-spine topologies that minimize cabling and latency. High-density chassis reduce per-port costs by up to 35% and free valuable floor space, allowing operators to defer expensive building expansions.
Virtualization and containerization have magnified east-west traffic, driving 400GbE interface adoption on routers that can fan out numerous virtual connections. Conversely, edge micro-data centers advocate compact eight-port designs with PoE profiles tailored for cameras and sensors. Regulatory demands for network segmentation in healthcare and finance require port-level policy control, encouraging modular line-cards that let administrators allocate physical interfaces by trust zone. The enterprise routers market therefore supports simultaneous demand for dense cores and compact edges, depending on workload placement strategies.
By Router Type: SD-WAN Appliances Disrupt Traditional Hierarchies
Core routers retained 41.15% revenue in 2025 on the strength of hyperscale and telecom orders, but SD-WAN appliances are expanding at 7.58% CAGR by collapsing routing, optimization, and security into software-defined overlays. Edge and aggregation tiers still matter for fail-safe redundancy in manufacturing and banking, where downtime carries heavy penalties.
Artificial-intelligence telemetry increasingly steers router selection, with platforms embedding inference engines that predict faults and automate ticket escalation. Access routers face substitution from Wi-Fi and 5G gateways that natively handle routing functions, cutting hardware SKUs at branch sites. Regulatory frameworks such as NIST SP 800-53 prompt buyers to prioritize routers offering integrated threat prevention and encrypted telemetry, nudging OEM roadmaps toward converged network-security appliances.
By End-User Industry: Retail Digitization Accelerates Infrastructure Demands
IT and Telecom contributed 29.25% of 2025 spending, given their constant need for backbone upgrades and service delivery platforms. Retail and e-commerce however are poised for 7.55% CAGR growth as omnichannel strategies hinge on real-time inventory and personalized promotions. A 100-millisecond latency cut can lift conversion rates by up to 2%, translating networking investments directly into revenue.
Manufacturers adopting deterministic Ethernet and time-sensitive networking demand routers with microburst buffering and precise clock synchronization. Healthcare facilities integrate medical IoT while obeying HIPAA and GDPR, mandating segmented networks with zero-trust policy enforcement. Financial institutions prioritize sub-microsecond latency for high-frequency trading while meeting strict compliance audits, sustaining premium pricing for performance-optimized routing platforms. Government and defense contracts specify FIPS-validated encryption and supply-chain provenance, enlarging the addressable pool for secure routing equipment.
Geography Analysis
North America commanded a 38.40% enterprise routers market share in 2025 on the back of established fiber backbones, early SD-WAN adoption, and stringent federal cybersecurity directives. Demand persists as agencies migrate toward zero-trust architectures and enterprises refresh for energy efficiency, though unit growth slows relative to emerging regions. Canadian enterprises in oil, gas, and mining adopt ruggedized routers rated for temperature swings and airborne particulates.
Asia Pacific is the fastest-growing territory at a 7.61% CAGR through 2031, buoyed by 5G buildouts and state-sponsored manufacturing digitization. China’s policy of indigenous technology preference nurtures domestic router OEMs while compelling multinationals to localize production and firmware audits. India’s Digital India program fosters broadband to rural districts and data-center corridors, catalyzing edge-router installations across fintech, healthcare, and BPO verticals. Japan’s Society 5.0 roadmap spurs investments in automation and smart infrastructure, sustaining premium demand for deterministic and low-latency routing gear.
Europe exhibits steady revenue progression anchored in sustainability regulations and GDPR-driven data-sovereignty rules, prompting on-premises router deployments that pair green design with compliance guarantees. Circular-economy incentives encourage take-back schemes and refurbished hardware. Latin America upgrades telco backbones and mining operations, favoring high-temperature tolerant hardware. Middle Eastern smart-city programs in the UAE and Saudi Arabia require AI-enabled routers to direct video analytics and IoT telemetry, while African nations begin leapfrogging to 5G fixed-wireless access, sparking demand for integrated cellular routers in enterprise branches.
Mordor Intelligence provides coverage of the enterprise routers market across other key regional markets, including Asia, each with their regulatory frameworks and demand patterns.

Competitive Landscape
The enterprise routers market sits in a mid-consolidated state as leading players chase scale and software prowess. HPE’s USD 14 billion acquisition of Juniper Networks in July 2025 positions the combined entity as an end-to-end rival to Cisco by unifying compute, storage, and AI-driven networking under one orchestration fabric. Cisco retains volume leadership through a broad catalog and channel depth yet pivots toward subscription-based licenses to lock in recurring revenue.
Arista focuses on hyperscale data-center routers; its 7280R4 line delivers 25.6 Tbps switching at 400 GbE while cutting power by 40%, aligning with cloud operators’ TCO metrics. Fortinet and Palo Alto Networks extend firewall franchises into routing by embedding SD-WAN and SASE, threatening incumbents in the branch segment. Microsoft champions the open-source SONiC network OS, enabling white-box entrants that erode hardware margins.
Competitive parameters now orbit software automation, security convergence, and sustainability credentials rather than raw port counts. Vendors advertise AI telemetry, intent-based orchestration, and zero-touch provisioning to cut operational overhead for skill-constrained IT teams. Buyers also assess life-cycle carbon impact and circular-economy participation. As hardware commoditizes, ecosystems, training, support, app marketplaces, become decisive tiebreakers in multi-million-dollar RFPs.
Enterprise Routers Industry Leaders
Cisco Systems, Inc.
Juniper Networks, Inc.
Hewlett Packard Enterprise Co.
Huawei Technologies Co., Ltd.
Dell Technologies Inc.
- *Disclaimer: Major Players sorted in no particular order

Recent Industry Developments
- July 2025: HPE closed its USD 14 billion purchase of Juniper Networks, forming a combined platform spanning compute and AI-driven networking.
- June 2025: Cisco partnered with NVIDIA to co-design AI-optimized routers featuring integrated GPU connectivity.
- May 2025: Arista rolled out the 7280R4 series with 400 GbE ports and reduced power draw for hyperscale operators.
- April 2025: Fortinet unveiled the FortiGate 4800F integrating SASE functions into a 1 Tbps appliance.


Global Enterprise Routers Market Report Scope
The enterprise router market is growing as IP traffic increased five-fold during the past five years and is increasing exponentially. Hence, to support this massive growth in IP traffic, routers need to be upgraded, thus growing the enterprise routers market in various end-user segments, such as BFSI, IT and telecom, transport, etc. The market study comprises the type of connectivity, type of routers, and type of ports, which are being demanded differently in end-user vertical segments.
The enterprise routers market is segmented by type of connectivity (wired, wireless), type of port (fixed port, modular), type (core routers, multi-services edge, access router), end-user vertical (BFSI, IT & telecom, healthcare, retail, manufacturing), and geography (North America, Europe, Asia Pacific, Latin America, and Middle East & Africa).
The market sizes and forecasts are provided in terms of value (USD) for all the above segments.
| Wired |
| Wireless |
| Hybrid |
| less than or equal to 8 Ports |
| 9 – 24 Ports |
| above 24 Ports |
| Core |
| Edge / Aggregation |
| Access |
| SD-WAN Appliance |
| BFSI |
| IT and Telecom |
| Healthcare |
| Retail and E-commerce |
| Manufacturing |
| Government and Defense |
| Education |
| North America | United States | |
| Canada | ||
| Europe | Germany | |
| United Kingdom | ||
| France | ||
| Russia | ||
| Rest of Europe | ||
| Asia Pacific | China | |
| India | ||
| Japan | ||
| South-East Asia | ||
| Rest of Asia Pacific | ||
| South America | Brazil | |
| Argentina | ||
| Rest of South America | ||
| Middle East and Africa | Middle East | Saudi Arabia |
| United Arab Emirates | ||
| Rest of Middle East | ||
| Africa | South Africa | |
| Nigeria | ||
| Rest of Africa | ||
| By Connectivity | Wired | ||
| Wireless | |||
| Hybrid | |||
| By Port Density | less than or equal to 8 Ports | ||
| 9 – 24 Ports | |||
| above 24 Ports | |||
| By Router Type | Core | ||
| Edge / Aggregation | |||
| Access | |||
| SD-WAN Appliance | |||
| By End-user Industry | BFSI | ||
| IT and Telecom | |||
| Healthcare | |||
| Retail and E-commerce | |||
| Manufacturing | |||
| Government and Defense | |||
| Education | |||
| By Geography | North America | United States | |
| Canada | |||
| Europe | Germany | ||
| United Kingdom | |||
| France | |||
| Russia | |||
| Rest of Europe | |||
| Asia Pacific | China | ||
| India | |||
| Japan | |||
| South-East Asia | |||
| Rest of Asia Pacific | |||
| South America | Brazil | ||
| Argentina | |||
| Rest of South America | |||
| Middle East and Africa | Middle East | Saudi Arabia | |
| United Arab Emirates | |||
| Rest of Middle East | |||
| Africa | South Africa | ||
| Nigeria | |||
| Rest of Africa | |||


Key Questions Answered in the Report
What is the current revenue pool for enterprise routers?
The enterprise routers market size is USD 19.51 billion in 2026 and is forecast to reach USD 27.52 billion by 2031.
How fast is wireless adoption growing relative to wired deployments?
Wireless router revenue is rising at an 8.53% CAGR through 2031, outpacing wired upgrades yet complementing them in hybrid designs.
Which region offers the highest growth potential for vendors?
Asia Pacific is projected to expand at a 7.61% CAGR through 2031 on the back of 5G rollouts and manufacturing digitization initiatives.
What role does SD-WAN play in refresh decisions?
SD-WAN appliances are the fastest-growing router type at 7.58% CAGR because they cut MPLS spend and embed security into software overlays.
How are sustainability goals affecting purchase criteria?
Buyers prioritize models delivering up to 40% lower power consumption and vendors offering take-back programs aligned with circular-economy principles.
Page last updated on:


