Home Networking Device Market Size and Share
Market Overview
| Study Period | 2019 - 2030 |
|---|---|
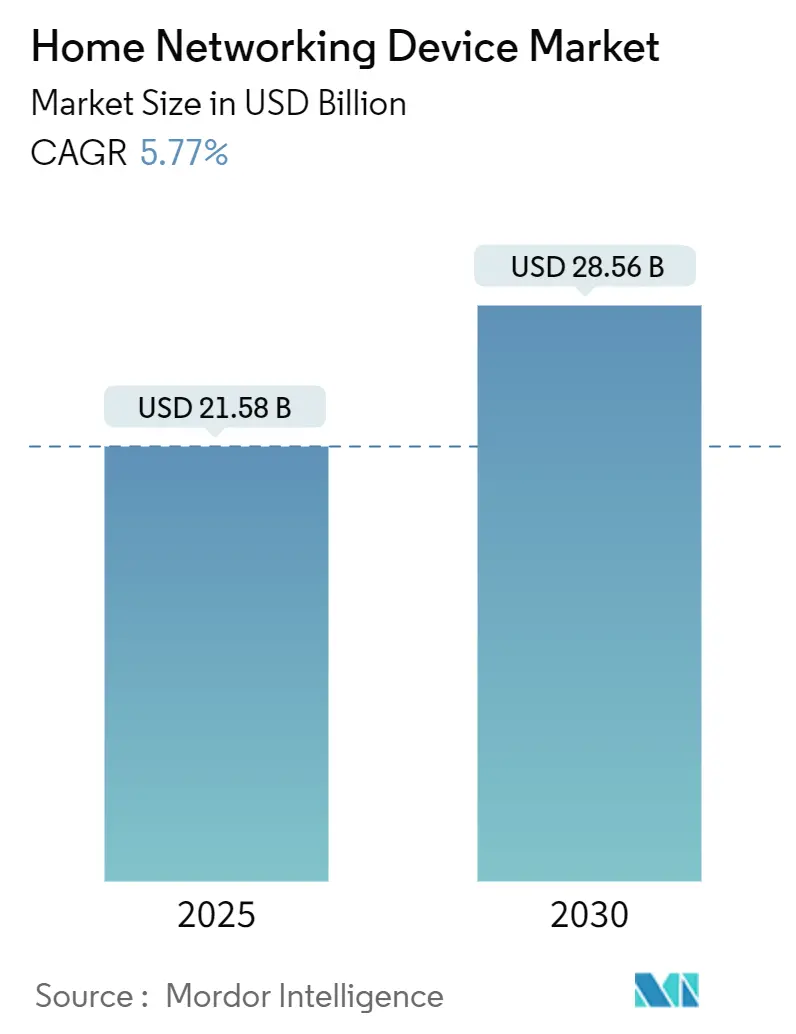
| Market Size (2025) | USD 21.58 Billion |
| Market Size (2030) | USD 28.56 Billion |
| Growth Rate (2025 - 2030) | 5.77% CAGR |
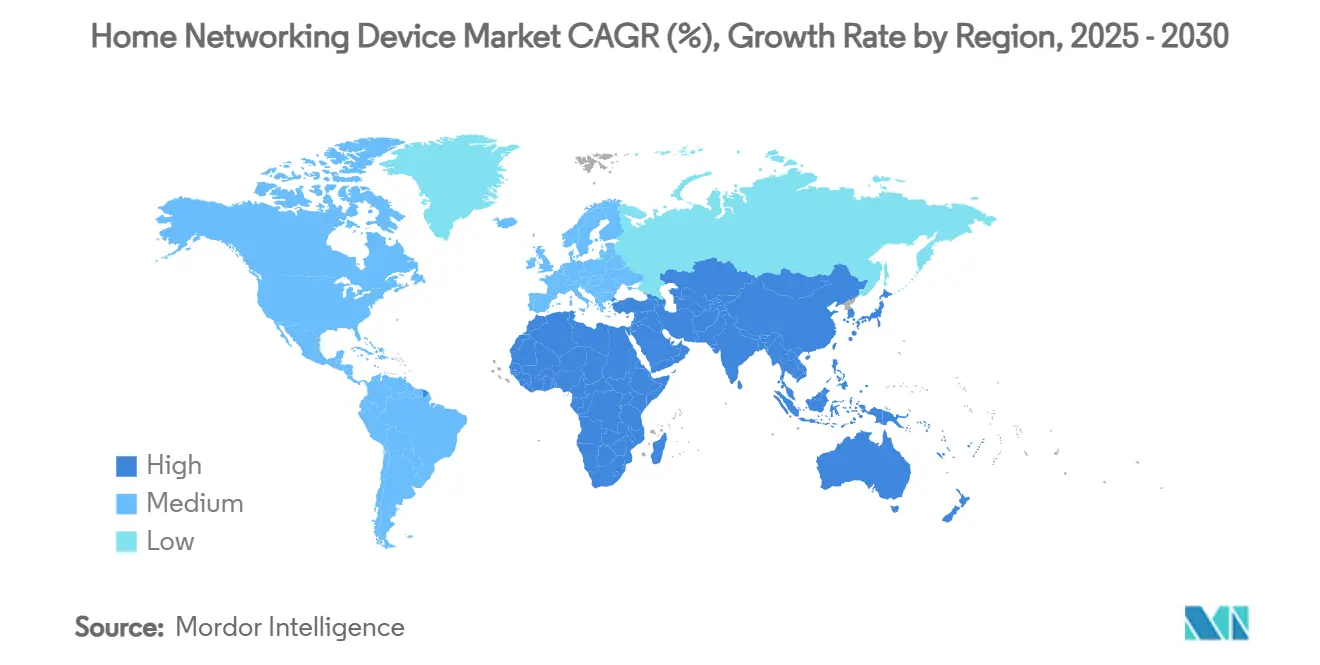
| Fastest Growing Market | Asia Pacific |
| Largest Market | North America |
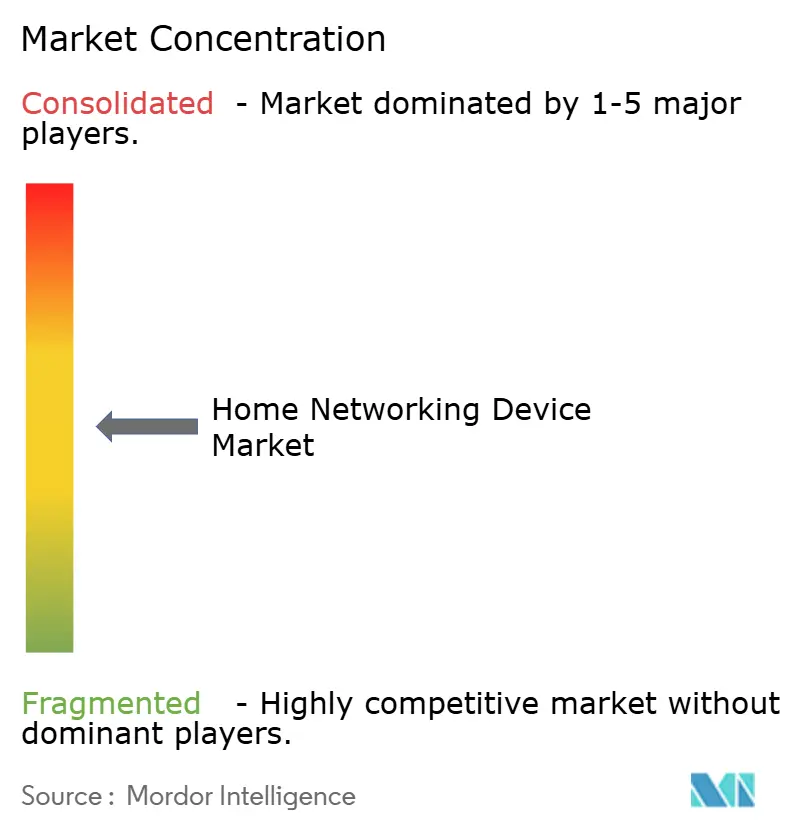
| Market Concentration | Medium |
Major Players *Disclaimer: Major Players sorted in no particular order Image © Mordor Intelligence. Reuse requires attribution under CC BY 4.0. | |
Home Networking Device Market Analysis by Mordor Intelligence
The home networking device market size equals USD 21.58 billion in 2025 and is forecast to reach USD 28.56 billion in 2030, reflecting a 5.77% CAGR over the period. Persistent hybrid-work routines, rapid Wi-Fi 6/6E/7 rollouts, and aggressive ISP-driven customer-premise-equipment (CPE) refresh programs underpin this steady expansion. Device makers benefit from predictable replacement cycles as operators bundle next-generation gateways with fiber or multi-gig cable tiers. In parallel, mesh networking and edge-AI security features transform routers into intelligent guardians capable of dynamic traffic shaping and autonomous threat mitigation, strengthening value propositions at higher price tiers. Semiconductor supply constraints that hampered Wi-Fi 7 adoption during 2024 have eased, enabling broader availability of premium chipsets that support multi-link operation and 6 GHz backhaul. Regional momentum varies: North America remains the largest revenue contributor, yet Asia-Pacific registers the quickest unit growth due to mass fiber-to-the-room (FTTR) deployments that demand specialized CPE capable of sustaining symmetrical multi-gig speeds.
Key Report Takeaways
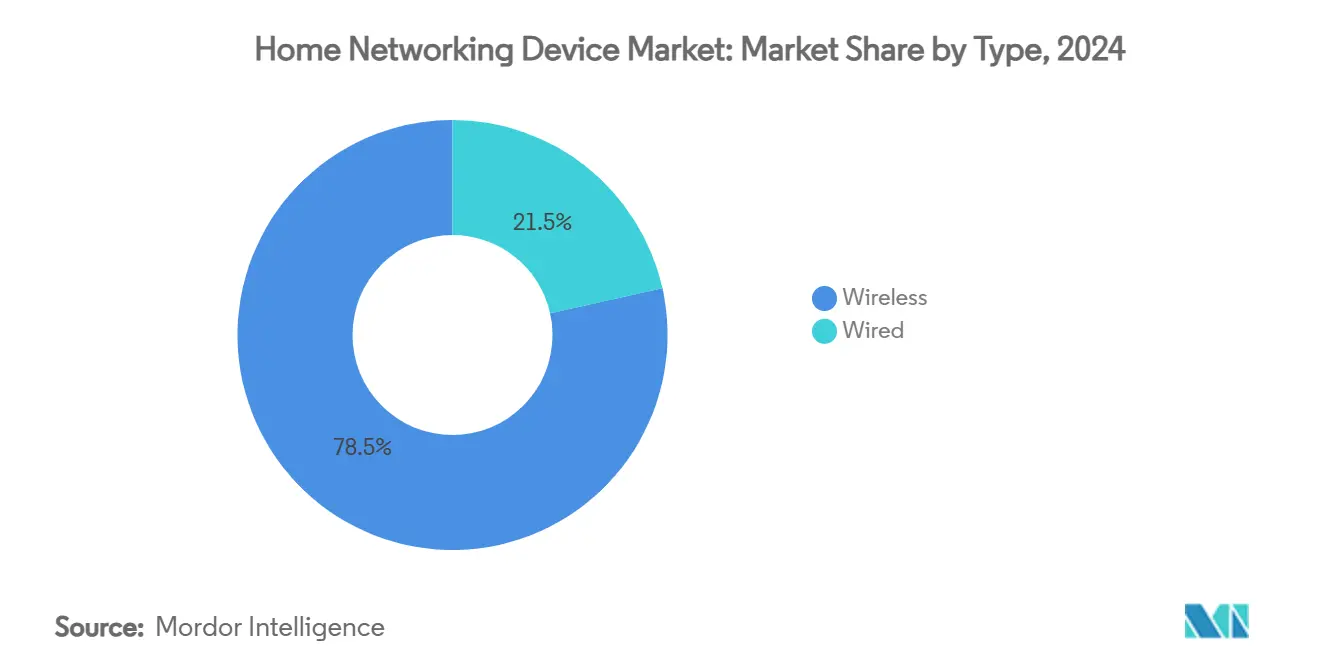
- By type, wireless devices commanded 78.48% of the home networking device market share in 2024, while wired devices are projected to expand at a 5.87% CAGR through 2030 as fiber backbones drive demand for high-throughput Ethernet backhaul.
- By component, routers held 64.74% of the home networking device market size in 2024; smart hubs exhibit the fastest trajectory with a 5.96% CAGR to 2030 thanks to their convergence of networking, voice, and home-automation functions.
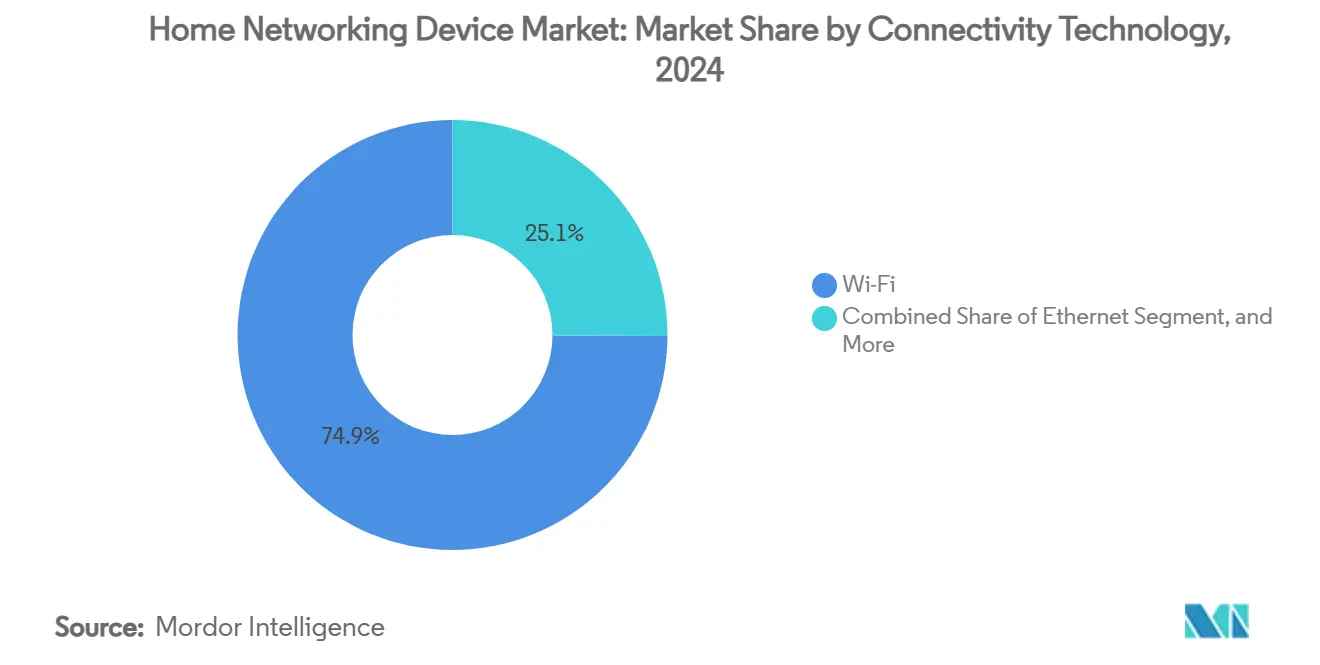
- By connectivity technology, Wi-Fi accounted for 74.92% of total value in 2024, and Wi-Fi 7 installations are set to advance at a 5.81% CAGR to 2030 as chipset shortages dissipate.
- By industry vertical, the smart-home segment captured 41.39% share in 2024; telecommunications deployments, driven by DOCSIS 4.0 gateways and managed Wi-Fi, are poised for the strongest 6.13% CAGR through 2030.
- By geography, North America led with 34.66% revenue in 2024; Asia-Pacific is forecast to expand at a 6.23% CAGR through 2030 on the back of FTTR and early Wi-Fi 7 uptake.
Global Home Networking Device Market Trends and Insights
Drivers Impact Analysis*
| Driver | (~) % Impact on CAGR Forecast | Geographic Relevance | Impact Timeline |
|---|---|---|---|
| Surge in Wi-Fi 6/6E/7 device shipments | 1.8% | Global, with concentration in North America and Asia-Pacific | Medium term (2-4 years) |
| Hybrid-work demand for robust residential connectivity | 1.5% | Global, particularly North America and Europe | Short term (≤ 2 years) |
| ISP-bundled CPE upgrades accelerating replacement cycles | 1.2% | North America and Europe core, expanding to Asia-Pacific | Medium term (2-4 years) |
| Growing adoption of mesh networking for whole-home coverage | 1.0% | Global, with early adoption in developed markets | Medium term (2-4 years) |
| Fiber-to-the-room (FTTR) roll-outs in Asia-Pacific homes | 0.9% | Asia-Pacific core, particularly China, Japan, South Korea | Long term (≥ 4 years) |
| Edge-AI security features becoming a buying criterion | 0.7% | North America and Europe initially, global expansion | Long term (≥ 4 years) |
| Source: Mordor Intelligence | |||
Surge in Wi-Fi 6/6E/7 Device Shipments Drive Premium Segment Growth
Multi-gig broadband penetration compels households to adopt Wi-Fi 7 routers capable of delivering 5.8 Gbps peak throughput, with Qualcomm’s FastConnect 7800 platform enabling tri-band aggregation and AI-driven channel allocation. [1]Scott Raynovich, “Cisco and NVIDIA Partnership Boosts AI Ethernet,” Futuriom, futuriom.com Mesh-system suppliers translate these advances into tangible user benefits: field tests reported 40% higher 4K streaming stability and 60% lower gaming latency when upgrading from Wi-Fi 6. The premium tier shields vendors from commodity pricing pressure in legacy Wi-Fi 5 lines while fostering upsell opportunities across smart-home devices. Retailers note attach-rates of security cameras and doorbells rising 12% when Wi-Fi 7 bundles are promoted alongside gigabit broadband packages. These dynamics support sustained ASPs even as component costs normalize, reinforcing top-line resilience for market leaders.
Hybrid-Work Infrastructure Demands Reshape Residential Connectivity Requirements
Remote-friendly employment patterns elevate the home network to mission-critical status, prompting consumers to prioritize Quality-of-Service controls, client isolation, and on-device VPNs historically reserved for enterprise equipment. Charter and Comcast’s alliance with T-Mobile to launch 5G-backed business mobile services in 2026 underscores operator recognition of the residential-to-business convergence. [2]Comcast Corporation, “Charter and Comcast Announce Agreement to Leverage T-Mobile 5G,” comcast.com Equipment vendors respond by embedding AI that automatically allocates upstream bandwidth to videoconferencing applications and mitigates interference during peak hours. These capabilities improve work-from-home productivity and reduce help-desk tickets for ISPs, translating into higher customer-satisfaction scores that justify premium monthly rates.
ISP-Bundled CPE Upgrades Create Predictable Revenue Streams
Operators leverage next-generation gateways as competitive differentiators as raw bandwidth commoditizes. AT&T’s Wi-Fi 6E gateway rollout and Cox’s DOCSIS 4.0 programs illustrate how bundling advanced hardware lowers churn and locks in multi-year service contracts. Volume-purchase agreements guarantee factory loading and stable production runs for OEMs, allowing efficient component sourcing and inventory planning. The strategy shields vendors from retail demand swings and supports accelerated payback on new chipset investments. Smaller brands without direct operator channels face entry barriers as procurement decisions consolidate among a handful of carriers.
Growing Adoption of Mesh Networking Addresses Whole-Home Coverage Challenges
Large multi-story homes and densely populated apartments suffer from dead zones that single-router setups cannot overcome. Mesh systems featuring dedicated 6 GHz backhaul ensure each node communicates on interference-free channels, delivering consistent gigabit speeds across 15,000 square feet as demonstrated by Eero Outdoor 7 field trials. Plug-and-play interfaces, smartphone-guided placement, and self-optimizing topologies have reduced install times to under 15 minutes, broadening adoption among non-technical users. Retail unit sales of mesh kits rose 32% year-on-year in 2024, outpacing traditional extenders by a factor of four. The trend compels legacy router vendors to introduce mesh-capable firmware or risk share dilution.
Restraints Impact Analysis*
| Restraint | (~) % Impact on CAGR Forecast | Geographic Relevance | Impact Timeline |
|---|---|---|---|
| Supply-chain volatility for Wi-Fi chipsets | -1.1% | Global, particularly affecting Asian manufacturers | Short term (≤ 2 years) |
| Heightened cyber-security / privacy regulations | -0.8% | Europe and North America primarily, expanding globally | Medium term (2-4 years) |
| Geo-political export controls on Chinese CPE | -0.6% | Global, with concentrated impact on Chinese vendors | Medium term (2-4 years) |
| Power-consumption limits in EU and Japan | -0.4% | Europe and Japan initially, potential global adoption | Long term (≥ 4 years) |
| Source: Mordor Intelligence | |||
Supply-Chain Volatility Constrains Premium Product Availability
Although wafer-capacity additions at TSMC and Samsung have eased shortages, lead times for advanced Wi-Fi 7 chipsets remain 18-20 weeks, forcing OEMs to prioritize flagship models. MaxLinear’s fan-less 20-watt Puma 8 DOCSIS 4.0 silicon highlights progress, yet smaller brands struggle to secure allocations, delaying mid-tier product launches and slowing the trickle-down of new standards. Channel inventories thus fluctuate, complicating revenue forecasting and prompting inventory-carrying-cost spikes.
Regulatory Compliance Costs Pressure Margins Across Market Segments
The European Union’s Cyber Resilience Act mandates vulnerability-management processes and multi-year firmware-support commitments, adding an estimated USD 1.2 million in engineering expense per product family for certification, testing, and ongoing patching. [3]3GC Group Analysts, “Cisco vs HPE: The Battle for AI Network Dominance,” 3gcgroup.com Simultaneously, new eco-design rules cap standby power at 2 watts for gateways from 2027 in the EU and 2028 in Japan. Redesigning power supplies and adding low-leakage components raise bill-of-materials costs by 4-6%, squeezing margins for vendors lacking scale leverage. Compliance challenges favor incumbents able to amortize costs across broad portfolios and deter start-ups from entering hardware-centric segments of the home networking device industry.
*Our forecasts treat driver/restraint impacts as directional, not additive. The impact forecasts reflect baseline growth, mix effects, and variable interactions.
Segment Analysis
By Type: Wireless Dominance Accelerates Through Mesh Innovation
The wireless sub-segment accounted for 78.48% of 2024 revenue, underscoring its entrenched leadership in the home networking device market. Wired alternatives persist in specialist scenarios such as esports competitions, yet consumer preference for cable-free installation propels wireless kits into mainstream big-box retail channels. The sub-segment’s 5.87% forecast CAGR reflects latent upgrade demand from households moving directly from Wi-Fi 5 to Wi-Fi 7, bypassing interim generations. Growth is magnified by ISP initiatives that standardize mesh-ready gateways with tri-band radios, replacing discrete range extenders and legacy coax backhaul. Academic trials measuring whole-home latency show wireless mesh setups achieving 4.3 milliseconds median round-trip time, rivaling Cat-6 deployments when multi-link operation is activated. Smaller form factors, fully integrated antennas, and 40% reductions in chipset power draw further erode the legacy advantages of wired drops.
In contrast, the wired category addresses professional studios and power users demanding deterministic throughput. Innovations such as 2.5 Gbps Power-over-Ethernet (PoE++) inject fresh relevance by supporting multi-gig speeds while delivering 60-watt power budgets for desktop switches. Yet even in premium dwellings, homeowners increasingly deploy hybrid models in which Ethernet interconnects mesh nodes, blending wired backbone stability with wireless endpoint flexibility. Consequently, the home networking device market sees wired unit volumes declining 2% annually yet ASPs rising 5% on average as buyers gravitate to higher-speed gear. Vendors that bundle 10-GbE LAN ports on Wi-Fi 7 routers capture added share by serving both segments without separate SKUs.


By Component: Smart Hubs Emerge as Convergence Platform
Routers represented 64.74% of 2024 value, reaffirming their role as the principal gateway within the home networking device market. However, smart hubs show the strongest momentum, advancing at a 5.96% CAGR through 2030 on the back of integrated Zigbee, Thread, and Matter controllers that unify IoT management. Consumers gravitate toward single-SKU products that aggregate Wi-Fi routing, voice assistant capabilities, and smart-home automation, cutting device clutter and simplifying troubleshooting. Hardware convergence reduces average home device counts by one unit per household, saving USD 40 in annual energy costs under European efficiency metrics. For vendors, consolidated designs create cross-selling opportunities for subscription-based cloud management and security services, lifting recurring ARPU.
Range extenders experience a gradual volume decline as mesh kits cannibalize the value proposition of spot coverage improvement. Network adapters receive a modest uplift from Wi-Fi 7 latency-sensitive gamers who demand PCIe cards and USB dongles capable of multi-link operation; ASPs have climbed 18% year-on-year as vendors add heat sinks and beamforming antennas. Modems maintain stable shipments but face disruption from DOCSIS 4.0 gateways that embed routing and Wi-Fi into operator-supplied all-in-one enclosures. Amazon’s Eero Pro 7 illustrates the trajectory: a tri-band mesh node with on-board Alexa voice assistant and threat-scanning subscription hooks priced at USD 299.99 commands premium shelf space in big-box retailers. Such examples highlight the blurring boundaries between networking, smart-home, and consumer-electronics device categories.
By Connectivity Technology: Wi-Fi 7 Drives Premium Segment Transformation
Wi-Fi technologies contributed 74.92% of 2024 revenue and are forecast to expand faster than legacy Ethernet within the home networking device market. Wi-Fi 7’s multi-link operation yields measured throughput of 4.8 Gbps in field tests, effectively matching 5 GbE-wired benchmarks. The additional 6 GHz spectrum reduces cross-talk with Bluetooth and Zigbee, enabling simultaneous video streaming, cloud gaming, and VR sessions on separate frequency lanes. As a result, ISP support teams report 22% fewer congestion-related trouble-tickets where Wi-Fi 7 gateways replaced Wi-Fi 5 gear. Consumer willingness to pay premiums is evident: average selling prices for Wi-Fi 7 routers hit USD 339 in Q1 2025, 42% above Wi-Fi 6E equivalents.
Ethernet retains indispensability for backhaul and NAS connectivity, with shipments of multi-gig switches climbing 9% in 2024. Powerline networking occupies a niche for heritage buildings with thick masonry walls; silicon vendors have pushed raw PHY rates to 2.5 Gbps, but real-world throughput still trails Wi-Fi 7 by 35%. Nonetheless, hybrid adapters combining Powerline and Wi-Fi act as bridging products for Europe’s 1970s housing stock, where drilling new conduits remains expensive. Looking ahead, spectrum-sharing regulations could support 7 GHz Wi-Fi 8 deployments, yet analysts anticipate Ethernet continuing to anchor core home infrastructure even as wireless endpoints proliferate.

By Industry Vertical: Smart-Home Integration Drives Connectivity Requirements
Smart-home deployments held 41.39% of 2024 revenue, validating their centrality to expansion strategies in the home networking device market. Households average 20 connected devices, and Matter adoption promises to double that count by 2027. Mesh gateways integrating Thread border routers streamline commissioning workflows, reducing setup time by 50% relative to standalone hubs. Edge-AI analytics embedded in premium routers detect anomalous traffic from IoT endpoints and quarantine compromised devices, features that drive 14-point NPS increases for ISP-supplied gear. The category’s 6.13% CAGR outlook reflects both unit growth and attach-rate acceleration for security subscriptions bundled with hardware.
Telecommunications vertical revenue grows steadily thanks to operators’ shift toward managed Wi-Fi and small business bundles. DOCSIS 4.0 gateway ASPs are 28% higher than DOCSIS 3.1 units, enabling MSOs to monetize speed tier upgrades. IT-focused residential workers also spur demand for VLAN tagging, WPA3-Enterprise authentication, and SD-WAN capabilities within consumer-priced devices. Healthcare and education leverage private 5G plus Wi-Fi 7 hybrids for tele-consultation and remote learning, respectively, introducing incremental opportunities for specialized CPE that supports network slicing. Research prototypes such as DHNet’s distributed architecture achieve 0.7 millisecond latency by off-loading DHCP and ARP functions to edge clusters, illustrating how academic work informs future commercial roadmaps.
Geography Analysis
North America accounted for 34.66% of 2024 revenue, bolstered by gigabit cable and fiber penetration that exceeded 78% of households last year. Operators bundle Wi-Fi 6E and Wi-Fi 7 gateways to differentiate service tiers, nudging equipment refresh cycles to three-year intervals. The FCC’s approval of Bell Canada’s USD 5.1 billion Ziply Fiber acquisition expands the combined entity’s footprint to 12 million locations by 2028, unlocking additional volume for gateway suppliers. Market participants also benefit from consolidation, as Charter’s USD 34.5 billion Cox buy enhances DOCSIS 4.0 rollouts that require new modems and tri-band Wi-Fi routers. Regulatory focus centers on data-privacy disclosures rather than technical standards, enabling rapid commercialization of edge-AI features-an advantage over stricter European regimes.
Asia-Pacific exhibits the highest growth at a 6.23% CAGR through 2030, underpinned by China’s FTTR push that shipped 6 million optical network terminals in 2024 alone. Government policy targets 5,000 private 5G networks by 2025, further stimulating demand for dual-mode gateways blending Wi-Fi 7 and 5G backhaul. Japan and South Korea act as innovation testbeds, with ISPs offering Wi-Fi 7 mesh kits bundled into triple-play packages at no extra upfront cost. This model accelerates penetration, driving chipset manufacturers to establish regional buffer inventories to hedge geopolitical risk. Meanwhile, India’s fiber build-outs catalyze low-cost Wi-Fi 6 routers, expanding the addressable base for entry-level vendors that repurpose 2019 silicon into cost-optimized designs.
Europe sustains mid-single-digit expansion despite stringent cybersecurity and eco-design directives that raise go-to-market barriers. The Cyber Resilience Act enforces security-by-default and lifecycle patching, pushing device makers to certify through EN 303 645 compliance labs at costs averaging USD 150,000 per SKU. Power budgets will tighten again in 2027, when standby caps fall to 2 watts for gateways and 1 watt for extenders, prompting chipset roadmaps to prioritize advanced sleep states. Despite these hurdles, fiber penetration surged 11 percentage points in 2024, and subsidies under the EU’s Recovery and Resilience Facility unlock USD 2.7 billion for rural broadband, ensuring steady equipment demand. Brexit-related customs friction has subsided as vendors relocate final assembly to Rotterdam and Gdańsk, shortening lead times for continental deliveries.

Competitive Landscape
The home networking device market remains moderately fragmented, with the top five players controlling roughly 47% of global revenue. TP-Link, NETGEAR, ASUS, Eero (Amazon), and Ubiquiti leverage brand recognition, extensive channel coverage, and firmware ecosystems to defend positions. Patent strategies revolve around antenna design, adaptive beamforming, and AI-assisted congestion management, with more than 6,100 global applications filed in 2024 alone. Vendor differentiation increasingly hinges on software features and subscription services rather than raw hardware specifications: Eero Secure, NETGEAR Armor, and TP-Link HomeShield each command monthly ARPUs between USD 3 and USD 10.
Strategic partnerships illustrate the pivot toward vertical integration. Cisco collaborates with NVIDIA to embed Silicon One ASICs into Spectrum-X Ethernet fabrics, advancing AI-native networking for edge inference workloads. Amazon integrates Matter controllers and Alexa voice services directly into Wi-Fi 7 nodes, capturing cross-sell opportunities across its device ecosystem. MaxLinear’s launch of the Puma 8 chipset disrupts Broadcom’s incumbency in DOCSIS 4.0 silicon by halving typical power draw and enabling fan-less gateway designs, attracting OEMs such as Askey and CommScope.
New entrants pursue service-based models that circumvent hardware commoditization. Cloud-managed mesh platforms offer subscription licenses for remote diagnostics, firmware orchestration, and parental controls, generating recurring revenue even when hardware ASPs compress. Supply-chain volatility has triggered selective reshoring: NETGEAR expanded manufacturing in Mexico to mitigate tariff exposure, while Taiwanese EMS providers invest in Malaysia and Vietnam to diversify risk. Regulatory compliance capabilities emerge as competitive moats; larger vendors maintain dedicated security-response teams and achieve faster patch-turnaround times, creating trust advantages with European operators subject to stringent disclosure regimes.
Home Networking Device Industry Leaders
TP-Link Technologies Co., Ltd.
NETGEAR, Inc.
ASUSTeK Computer Inc.
D-Link Corporation
Cisco Systems, Inc.
- *Disclaimer: Major Players sorted in no particular order

Recent Industry Developments
- July 2025: Charter Communications and Comcast signed a multi-year pact with T-Mobile to leverage its 5G network for business mobile services launching in 2026.
- July 2025: MaxLinear introduced the fan-less Puma 8 DOCSIS 4.0 chipset, with OEM support from Askey and CommScope.
- July 2025: The FCC approved Bell Canada’s USD 5.1 billion acquisition of Ziply Fiber, clearing foreign-ownership restrictions.


Global Home Networking Device Market Report Scope
| Wired |
| Wireless |
| Routers |
| Range Extenders |
| Network Adapters |
| Modems |
| Smart Hubs |
| Other Components |
| Wi-Fi |
| Ethernet |
| Powerline |
| Telecommunication |
| Smart Home |
| IT |
| Other Industry Verticals |
| North America | United States | |
| Canada | ||
| Mexico | ||
| South America | Brazil | |
| Argentina | ||
| Rest of South America | ||
| Europe | Germany | |
| United Kingdom | ||
| France | ||
| Russia | ||
| Rest of Europe | ||
| Asia-Pacific | China | |
| Japan | ||
| India | ||
| South Korea | ||
| Australia | ||
| Rest of Asia-Pacific | ||
| Middle East and Africa | Middle East | Saudi Arabia |
| United Arab Emirates | ||
| Rest of Middle East | ||
| Africa | South Africa | |
| Egypt | ||
| Rest of Africa | ||
| By Type | Wired | ||
| Wireless | |||
| By Component | Routers | ||
| Range Extenders | |||
| Network Adapters | |||
| Modems | |||
| Smart Hubs | |||
| Other Components | |||
| By Connectivity Technology | Wi-Fi | ||
| Ethernet | |||
| Powerline | |||
| By Industry Vertical | Telecommunication | ||
| Smart Home | |||
| IT | |||
| Other Industry Verticals | |||
| By Geography | North America | United States | |
| Canada | |||
| Mexico | |||
| South America | Brazil | ||
| Argentina | |||
| Rest of South America | |||
| Europe | Germany | ||
| United Kingdom | |||
| France | |||
| Russia | |||
| Rest of Europe | |||
| Asia-Pacific | China | ||
| Japan | |||
| India | |||
| South Korea | |||
| Australia | |||
| Rest of Asia-Pacific | |||
| Middle East and Africa | Middle East | Saudi Arabia | |
| United Arab Emirates | |||
| Rest of Middle East | |||
| Africa | South Africa | ||
| Egypt | |||
| Rest of Africa | |||


Key Questions Answered in the Report
How large is the home networking device market in 2025?
The home networking device market size equals USD 21.58 billion in 2025 and is projected to grow steadily at a 5.77% CAGR to 2030.
Which device type generates most revenue today?
Wireless products lead with 78.48% of 2024 value as mesh-ready Wi-Fi 6/6E/7 systems become the default choice for whole-home coverage.
What is driving demand for Wi-Fi 7 equipment?
Multi-gig fiber services, hybrid-work traffic loads, and the 6 GHz spectrum’s lower interference are pushing households to adopt Wi-Fi 7 routers and mesh kits.
Why are smart hubs growing faster than traditional routers?
Smart hubs merge routing, voice control, and Matter-compliant IoT coordination into one device, simplifying management and reducing total hardware count per home.
Which region is expanding the fastest?
Asia-Pacific records a 6.23% CAGR to 2030 because FTTR projects in China, Japan, and South Korea require advanced CPE capable of handling symmetrical multi-gig broadband.
How will new EU regulations affect vendors?
The Cyber Resilience Act and eco-design power caps increase engineering and certification costs, favoring larger brands that can amortize compliance spending across multiple product lines.
Page last updated on:


