Market Overview
| Study Period | 2021 - 2031 |
|---|---|
| Forecast Data Period | 2026 - 2031 |
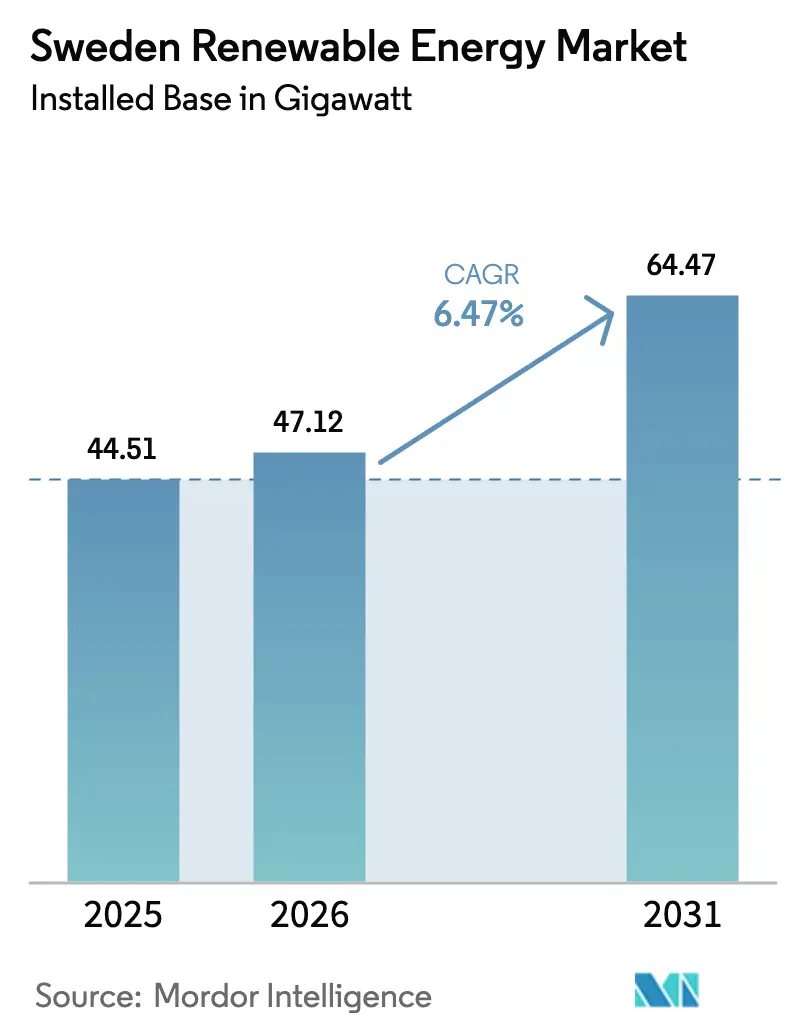
| Base Year Market Size (2025) | 44.51 gigawatt |
| Market Volume (2026) | 47.12 gigawatt |
| Market Volume (2031) | 64.47 gigawatt |
| Growth Rate (2026 - 2031) | 6.47% CAGR |
| Market Concentration | Medium |
Major Players *Disclaimer: Major Players sorted in no particular order Image © Mordor Intelligence. Reuse requires attribution under CC BY 4.0. | |
Sweden Renewable Energy Market Analysis by Mordor Intelligence
The Sweden Renewable Energy Market size in terms of installed base is expected to increase from 44.51 gigawatt in 2025 to 47.12 gigawatt in 2026 and reach 64.47 gigawatt by 2031, growing at a CAGR of 6.47% over 2026-2031.
Solar capacity is accelerating at 10.3%, almost twice the overall pace, while onshore wind additions are slowing as permitting hurdles deepen. Corporate power-purchase agreements signed by datacenters and green-steel producers now anchor multi-gigawatt pipelines, creating stable revenue streams that cut exposure to wholesale volatility. A SEK 36 billion (USD 3.4 billion) bioenergy carbon-capture subsidy has introduced a negative-emissions income line that materially lowers project capital payback. Grid-connection scarcity has become a decisive value driver because projects with firm access command premium valuations and attract cheaper debt.[1]Svenska kraftnät, “System Development Plan 2026,” svk.se
Key Report Takeaways
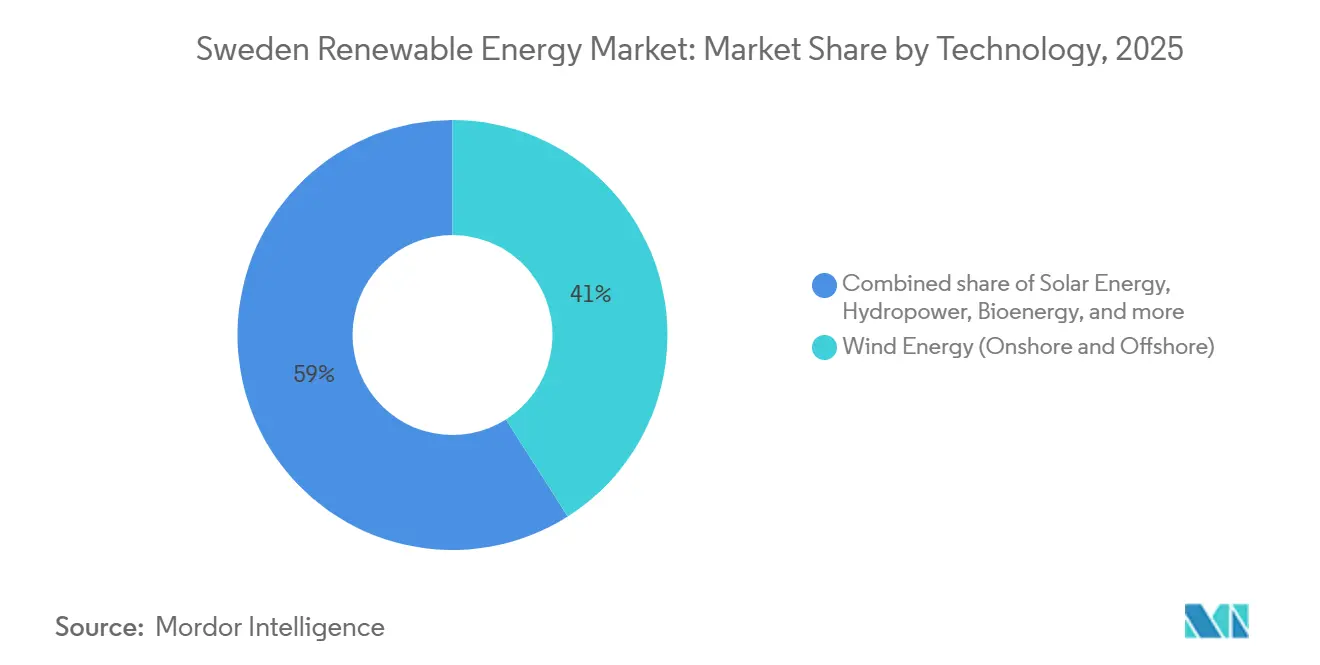
- By technology, wind energy led with 41.0% of Sweden's renewable energy market share in 2025, while solar energy is projected to advance at a 10.3% CAGR through 2031.
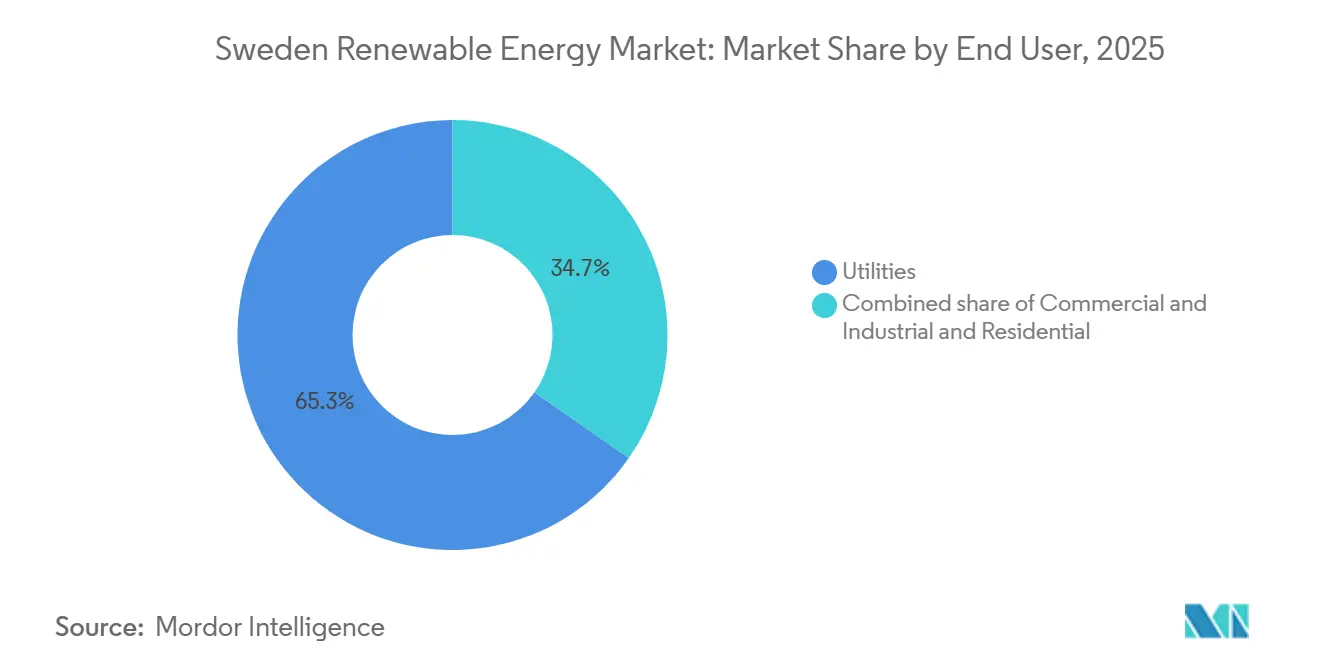
- By end user, utilities controlled 65.3% of the Sweden renewable energy market in 2025, but the commercial and industrial segment is forecast to post the fastest 12.8% CAGR to 2031.
- Vattenfall, Fortum, and Uniper together held 57% of installed capacity in 2025, underscoring a gradually declining yet still influential incumbency position.
Note: Market size and forecast figures in this report are generated using Mordor Intelligence’s proprietary estimation framework, updated with the latest available data and insights as of January 2026.
Sweden Renewable Energy Market Trends and Insights
Drivers Impact Analysis*
| Driver | (~) % Impact on CAGR Forecast | Geographic Relevance | Impact Timeline |
|---|---|---|---|
| Grid-connected wind pipeline exceeding 20 GW awaits access | +1.2% | National, concentrated in SE1, SE2, and offshore zones SE3, SE4 | Medium term (2-4 years) |
| Rapidly falling PV module prices driving distributed solar | +0.9% | National, early gains in SE3, SE4 | Short term (≤ 2 years) |
| Corporate-PPA boom from datacenter and green-steel off-takers | +1.5% | National, focused on Elområde 3 and northern clusters | Medium term (2-4 years) |
| BECCS subsidy creating negative-emission revenues | +0.7% | National, district-heating CHP plants | Long term (≥ 4 years) |
| EU RED III fast-track permitting rules | +0.8% | National | Short term (≤ 2 years) |
| Smart-meter roll-out enabling dynamic-pricing demand response | +0.6% | National, urban and peri-urban | Medium term (2-4 years) |
| Source: Mordor Intelligence | |||
Grid-Connected Wind Pipeline Exceeding 20 GW Awaits Access
More than 35 GW of offshore wind remains stuck in Sweden’s regulatory queue as of early 2024, with sixteen projects awaiting central approval.[2]Bernd Radowitz, “Sweden rejects 13 of 14 Baltic Sea offshore wind projects,” Recharge News, rechargenews.com Developers that already secured grid slots lock in premium PPAs, whereas later entrants face indefinite delays that erode project net present value by up to 30%. Svenska kraftnät prioritizes export links such as Aurora Line and Hansa PowerBridge so that domestic bottlenecks will persist until the late 2030s. Projects that pair firm grid access with 24/7 corporate offtake, illustrated by Vattenfall’s supply contract for Digital Realty’s Stockholm campuses, demonstrate a route to financing that sidesteps merchant exposure. Consequently, grid access rather than technology cost now dictates competitive positioning in the Sweden renewable energy market.
Rapidly Falling PV Module Prices Driving Distributed Solar
Sweden installed 430 MW of solar in the first half of 2025, a 24% year-on-year dip, yet module cost deflation kept the annual total on track for roughly 800 MW.[3]Alastair Jowett, “Swedish residential batteries surge as solar subsidies fade,” pv magazine, pv-magazine.com Households increasingly buy batteries first and panels later because tax deductions for storage rose 26% during early 2025, reversing the traditional purchase order. Arbitrage value from dynamic tariffs now outweighs self-consumption savings in several grid zones, especially where peak demand charges bite. Utility-scale projects like Alight’s 64 MW Hallstavik park show how larger sites secure direct connections and bypass the residential permitting maze. For investors, the strategy tilts toward solar-plus-storage hybrids that capture energy and ancillary-service revenues, while pure rooftop plays struggle under shrinking tax incentives.
Corporate-PPA Boom from Datacenter and Green-Steel Off-Takers
Electricity demand from datacenters in Elområde 3 increased fivefold in 2025, generating 5 GW of new connection requests, equal to five nuclear reactors. Svenska kraftnät now considers forcing applicants to secure on-site generation or firm PPAs before granting grid access, effectively making datacenters renewable backers by design. Stegra’s dual 2025 contracts with Microsoft combine near-zero-emission steel delivery with environmental certificate sales, creating a cross-commodity hedge that de-risks both parties. Vattenfall’s hourly matching service lets Digital Realty align consumption with specific wind or hydro assets, driving Scope 2 emissions toward zero. The Sweden renewable energy market, therefore, treats corporate PPAs as the primary pathway to financial close rather than an optional overlay.
BECCS Subsidy Creating Negative-Emission Revenues
The SEK 36 billion (USD 3.4 billion) subsidy for bioenergy carbon capture allows operators such as Stockholm Exergi to monetize captured CO₂, offsetting 15%–20% of capital costs.[4]International Energy Agency, “Bioenergy with Carbon Capture and Storage,” ieabioenergy.com District-heating CHP plants can integrate capture units with minimal downtime because flue gas streams are steady and accessible. Negative-emission revenue provides a price floor during periods of low power prices, reducing earnings volatility relative to wind or solar. Investor appetite has strengthened for projects combining heat supply with BECCS since these assets enjoy dual cash flows. Long-term viability, however, rests on continued state support and international acceptance of biogenic capture in carbon accounting schemes.
Restraints Impact Analysis*
| Restraint | (~) % Impact on CAGR Forecast | Geographic Relevance | Impact Timeline |
|---|---|---|---|
| Municipal vetoes blocking onshore-wind permits since 2021 | -1.8% | National, strongest in SE3, SE4 | Short term (≤ 2 years) |
| North–south grid bottlenecks curtailing northern surplus power | -1.1% | National, SE1/SE2 to SE3/SE4 boundary | Long term (≥ 4 years) |
| Offshore-wind conflicts with military and shipping corridors | -0.9% | Baltic Sea zones SE3, SE4 | Medium term (2-4 years) |
| Solar net-metering cap reductions hitting small-roof economics | -0.5% | National, residential-dense south | Short term (≤ 2 years) |
| Source: Mordor Intelligence | |||
Municipal Vetoes Blocking Onshore-Wind Permits
Local councils rejected 143 turbines across twelve projects during the first half of 2024, stalling capacity where demand is highest. An estimated 16.7 TWh of potential annual generation has been lost, equal to 11% of current wind output. Developers now favor municipalities offering financial participation or revenue sharing, even at the cost of lower wind speeds. The constraint shifts new builds toward offshore or northern inland sites, each carrying higher capital intensity or transmission risk. Until legislative reform curtails local veto powers, onshore wind growth in the Sweden renewable energy market will remain capped.
North–South Grid Bottlenecks Curtailing Surplus Power
Transmission limits between price areas 2 and 3 cause negative prices in the north when winds are strong, while the south pays scarcity premiums above EUR 50 per MWh. NordSyd reinforcements will not be complete until the 2040s, so curtailment is a long-term drag on project economics. Northern projects can mitigate risk by securing export contracts to Finland or by co-locating with energy-intensive industries. Storage assets near the bottleneck earn congestion-arbitrage margins by shifting power across time rather than distance. The Sweden renewable energy market, therefore, rewards capacity that either sits close to demand or avoids the transmission grid altogether.
*Our forecasts treat driver/restraint impacts as directional, not additive. The impact forecasts reflect baseline growth, mix effects, and variable interactions.
Segment Analysis
By Technology: Wind Dominance Faces Solar Acceleration
Wind provided 41.0% of installed capacity, making it the largest slice of the Sweden renewable energy market share in 2025. Solar, however, is growing faster at 10.3% CAGR, narrowing the gap each year. Municipal vetoes and military radar conflicts have pushed developers toward sites with longer lead times, whereas solar farms can secure land and permits in under eighteen months. Hydropower remains the flexibility backbone, with 16.2 GW and 34 TWh of storage that balance variable renewables. Vattenfall’s 380 MW Juktan pumped-storage plan underscores incumbent focus on dispatchable upgrades.
Utility-scale solar projects in SE3 and SE4 leverage existing transformer capacity, while rooftop adoption cools under reduced net-metering credits. Bioenergy delivers 543 PJ annually, bolstered by BECCS subsidies that open an extra cash stream. Geothermal and ocean technologies remain nascent given Sweden’s modest high-temperature gradients and Baltic Sea tides. The Sweden renewable energy market, therefore, tilts toward technologies that secure quick permits and exploit ancillary-service income.


By End User: Utilities Lead but C&I Surges
Utilities controlled 65.3% of renewable assets in 2025, reflecting historic dominance by Vattenfall, Fortum, and Uniper. The commercial and industrial cohort is forecast to log a 12.8% CAGR through 2031, driven by datacenter and green-steel demand that bundles PPAs with on-site generation. Corporate deals now anchor the bulk of new project financings in the Sweden renewable energy market.
Residential uptake is softening as tax incentives fade, yet battery adoption rises for price-arbitrage play. C&I buyers increasingly demand 24/7 matching, prompting utilities to customize hourly supply products. For equipment vendors, integrated solar-plus-storage kits now outsell panel-only offerings in the housing sector.
Geography Analysis
Northern zones SE1 and SE2 host most wind and hydro assets, benefiting from favorable resources and lower population density, but frequent negative spot prices curb revenue when curtailments hit. Southern and central zones SE3 and SE4 concentrate demand from industry and consumers, yet face tighter permitting, causing pronounced price spreads that support storage economics. The Sweden renewable energy market size for battery assets in SE3 is projected to rise sharply once datacenter mandates are finalized in 2026.
Cross-border links such as the Aurora Line to Finland and Hansa PowerBridge to Germany will raise export capacity, but these cables prioritize cross-border trade over domestic congestion relief. Northern producers may still face curtailment, while southern buyers pay premiums. Projects co-located with green-steel plants or datacenters in the north can monetize surplus power internally, bypassing grid limits.
Elområde 3 datacenter clusters filed for 5 GW of new connections in 2025, prompting draft rules that tie approval to renewable PPAs or on-site generation. The regulatory shift effectively bundles digital-infrastructure growth with local renewable build-out. Developers now pursue hybrid parks that integrate wind, solar, batteries, and heat-recovery schemes to meet both electricity and district-heating requirements.
Competitive Landscape
The three largest owners, Vattenfall at 33.1%, Fortum at 12.9%, and Uniper at 11.7%, controlled a combined 57% of installed capacity in 2025. While concentration has declined from 90% in the mid-1990s, incumbents still command the bulk of hydropower, a flexibility moat that intermittent developers cannot match. OX2’s EUR 1.5 billion sale to EQT in 2024 reflects private-equity appetite for platforms with secured grid access and growth pipelines.
Battery capacity increased from 80 MW to 610 MW during 2024, validating the hybrid strategy pursued by new entrants. Fortum and Mine Storage target 500–1,000 MW of pumped hydro to complement reservoir plants, while Statkraft seeks licensing for a new Aura hydro unit to boost Nordic flexibility.
Competitive advantage is migrating toward control of grid-connection queues and long-term corporate offtake. Vattenfall earmarked SEK 170 billion (USD 16 billion) for grid upgrades, hydro expansions, and small modular reactors for the 2025-2029 period. Statkraft leverages its 25% share of European reservoir capacity to arbitrage power across Nordic and German markets. Datacenter operators emerge as disruptive buyers that bypass utilities through direct procurement, redefining bargaining power in the Sweden renewable energy market.
Sweden Renewable Energy Industry Leaders
Vattenfall AB
Uniper SE (Sydkraft)
Fortum Oyj (incl. Stockholm Exergi JV)
Statkraft AS
OX2 AB
- *Disclaimer: Major Players sorted in no particular order


Recent Industry Developments
- January 2026: Orrön Energy, a renewables firm based in Sweden, has clinched grid connections for three solar PV projects boasting a combined generation capacity of approximately 1.8GW. In addition to these solar initiatives, the company has also obtained grid connections for three data centre projects, totaling a cumulative capacity of 1.1GW.
- December 2025: BayWa's Nordic renewable energy division has obtained an environmental permit for the 250MW Ryamon Solar Park in Alvesta municipality. Situated adjacent to the Lyngsåsa wind farm, the park will be further developed by BayWa r.e. into a hybrid site with the addition of solar power.
- September 2025: Alight, a Nordic independent power producer, and Neoen commissioned and fully operationalized the Hultsfred Solar Farm, Sweden's largest utility-scale solar installation. Located at Hultsfred Airport in Småland, the solar farm features 174,000 low-carbon photovoltaic panels around the runway, with an installed capacity of 100 MWp.


Sweden Renewable Energy Market Report Scope
Renewable energy harnesses natural sources such as the sun, wind, water, and biomass, which are virtually limitless and naturally replenish. This energy source provides a cleaner alternative to fossil fuels, significantly curbing pollution and carbon emissions.
The Sweden renewable energy market is segmented by technology, end-user, and geography (Sweden). By technology, the market is segmented into solar energy, wind energy, hydropower, bioenergy, geothermal, and ocean energy. By end-user, the market is segmented into utilities, commercial and industrial, and residential. Market forecasts are provided in terms of volume (GW).
By Technology
| Solar Energy (PV and CSP) |
| Wind Energy (Onshore and Offshore) |
| Hydropower (Small, Large, PSH) |
| Bioenergy |
| Geothermal |
| Ocean Energy (Tidal and Wave) |
By End-User
| Utilities |
| Commercial and Industrial |
| Residential |
| By Technology | Solar Energy (PV and CSP) |
| Wind Energy (Onshore and Offshore) | |
| Hydropower (Small, Large, PSH) | |
| Bioenergy | |
| Geothermal | |
| Ocean Energy (Tidal and Wave) | |
| By End-User | Utilities |
| Commercial and Industrial | |
| Residential |


Key Questions Answered in the Report
How large is the Sweden renewable energy market in capacity terms for 2026?
The installed capacity stood at 47.12 GW in 2026.
Which technology is growing fastest in Sweden's renewables mix?
Solar photovoltaic capacity is expanding at 10.3% CAGR, nearly double the overall market pace, due to falling module prices and hybrid project uptake.
Why are corporate PPAs important in Sweden?
Datacenters and green-steel producers rely on long-term PPAs to secure grid access and hedge power costs, making these contracts the main route to financing new renewable projects.
What limits further onshore wind expansion?
Municipal veto rights have blocked about 80% of applications since 2021, especially in southern and central zones where electricity demand is highest.
How does the BECCS subsidy influence bioenergy projects?
The SEK 36 billion program lets operators monetize captured CO2, offsetting up to 20% of project capital costs and adding a stable revenue stream to biomass plants.
Which regions in Sweden face the biggest grid bottlenecks?
The boundary between price areas 2 and 3 suffers the most congestion, causing negative prices in the north and scarcity premiums in the south.
Page last updated on:


