Market Overview
| Study Period | 2021 - 2031 |
|---|---|
| Forecast Data Period | 2026 - 2031 |
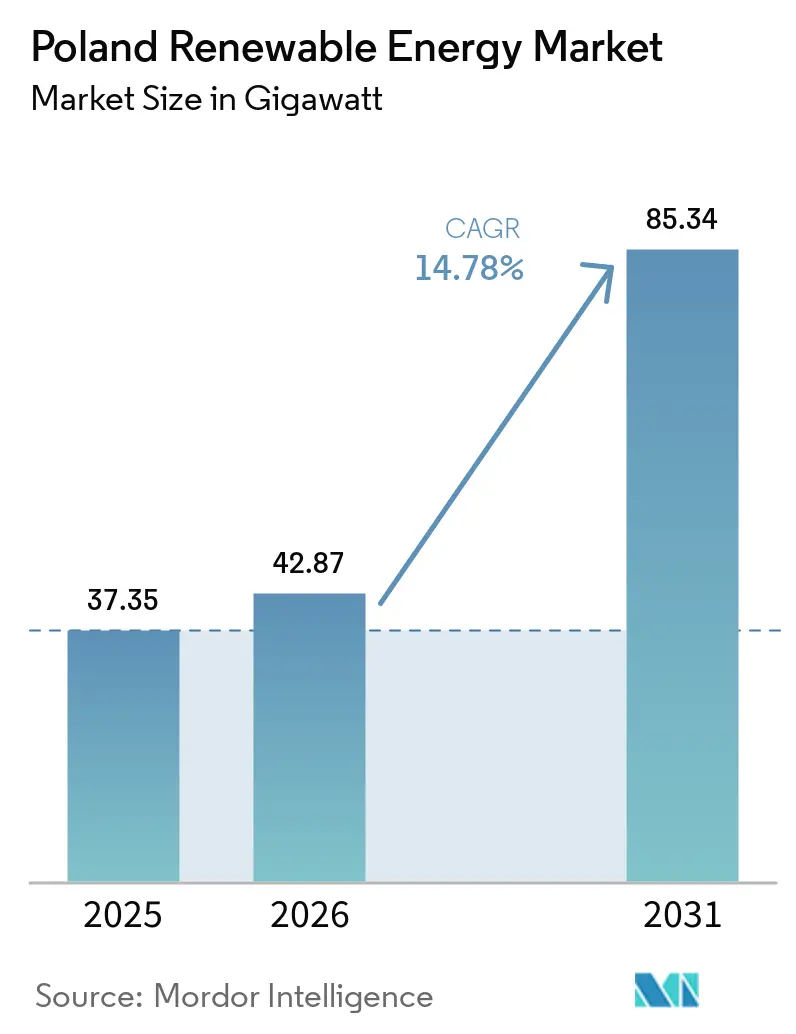
| Base Year Market Size (2025) | 37.35 gigawatt |
| Market Volume (2026) | 42.87 gigawatt |
| Market Volume (2031) | 85.34 gigawatt |
| Growth Rate (2026 - 2031) | 14.78% CAGR |
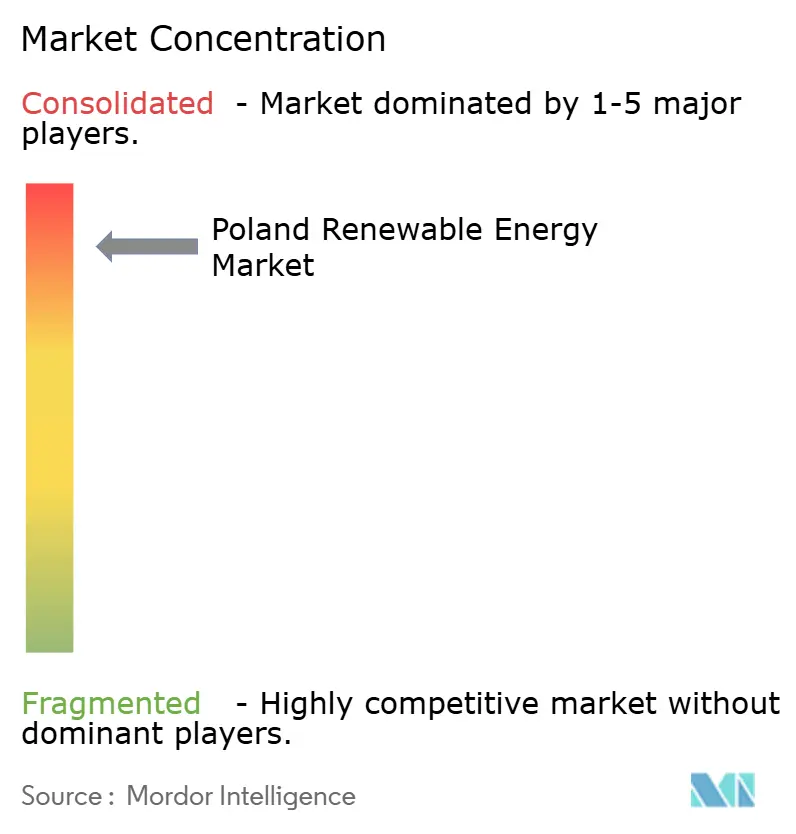
| Market Concentration | High |
Major Players*Disclaimer: Major Players sorted in no particular order Image © Mordor Intelligence. Reuse requires attribution under CC BY 4.0. | |
Poland Renewable Energy Market Analysis by Mordor Intelligence
Poland Renewable Energy Market size in 2026 is estimated at 42.87 gigawatt, growing from 2025 value of 37.35 gigawatt with 2031 projections showing 85.34 gigawatt, growing at 14.78% CAGR over 2026-2031.
This sustained growth is anchored in EU-mandated targets under the Fit-for-55 initiative, reinforced by Poland’s updated National Energy and Climate Plan (NECP), which legally obligates a 56% renewable share in electricity generation by 2030. Solar photovoltaic (PV) technology dominates with 60.4% of installed capacity in 2024, buoyed by grid-parity economics and rapidly declining module prices. Offshore wind represents the next growth engine, leveraging streamlined maritime permitting and 50% local-content rules that are drawing global turbine manufacturers to the Baltic coast. Corporate power-purchase agreements (PPAs) in the heavy industry sector are expanding rapidly, signaling a strategic shift from compliance-driven procurement to proactive decarbonization of energy-intensive operations. Grid bottlenecks and elongated permitting cycles, however, temper the upside, as curtailment is already eroding project returns and offsetting some of the policy-led tailwinds.
Key Report Takeaways
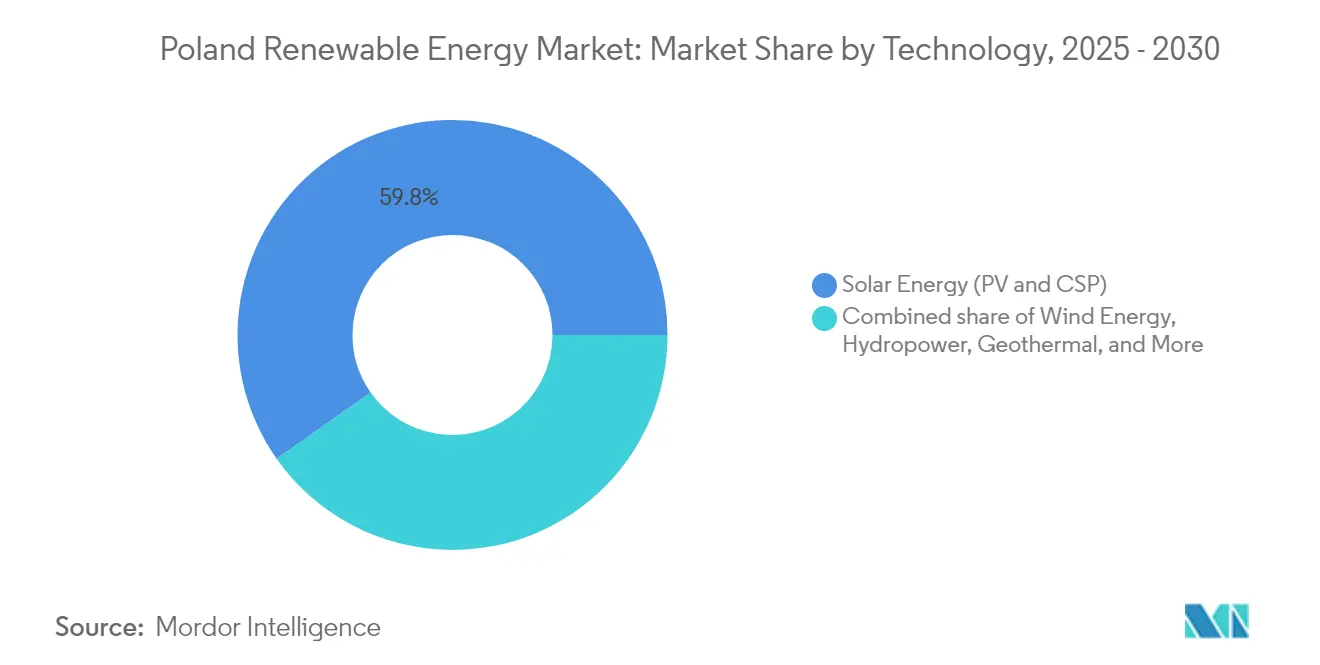
- By technology, solar energy held 59.75% of the Poland renewable energy market share in 2025, while geothermal energy is projected to advance at a 41.38% CAGR through 2031.
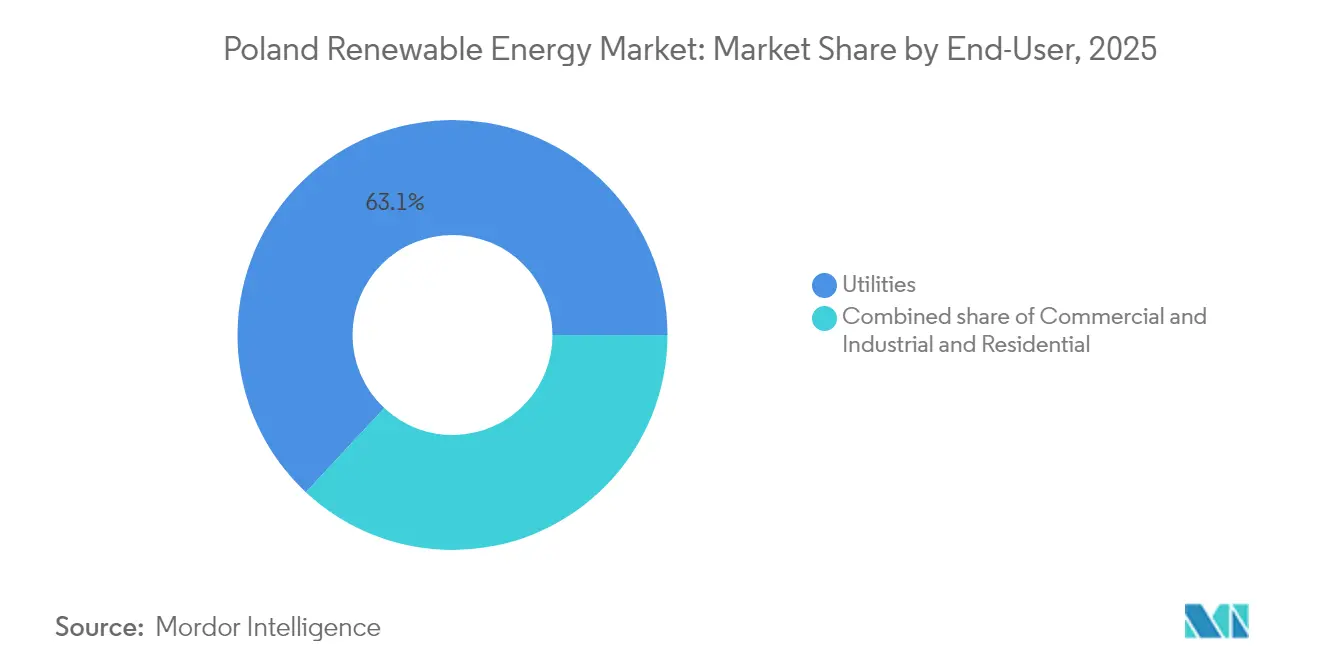
- By end-user, utilities controlled 63.05% of the Poland renewable energy market size in 2025, whereas the commercial and industrial segment is poised for a 17.28% CAGR to 2031.
Note: Market size and forecast figures in this report are generated using Mordor Intelligence’s proprietary estimation framework, updated with the latest available data and insights as of 2026.
Poland Renewable Energy Market Trends and Insights
Drivers Impact Analysis*
| Driver | (~) % Impact on CAGR Forecast | Geographic Relevance | Impact Timeline |
|---|---|---|---|
| EU 2030 & Fit-for-55 binding targets | +3.2% | National, with cross-border links to Germany and Lithuania | Long term (≥ 4 years) |
| Expansion of Contracts-for-Difference (CfD) auctions | +2.8% | Pomerania, Mazovia, Greater Poland | Medium term (2-4 years) |
| Rapid solar PV cost decline reaching grid parity | +2.5% | Nationwide, strongest impact in southern and central regions | Short term (≤ 2 years) |
| Offshore-wind local-content incentives | +1.9% | Baltic Sea coastal zones | Long term (≥ 4 years) |
| Surge in heavy-industry corporate PPAs | +1.4% | Silesia, Lower Silesia | Medium term (2-4 years) |
| Source: Mordor Intelligence | |||
EU 2030 & Fit-for-55 Binding Targets Drive Structural Transformation
Binding EU rules require Poland to source 56% of its electricity from renewable sources by 2030 and to increase the renewable share in final energy consumption to 29.8%. Utilities therefore prioritize the roll-out of renewable capacity over the extension of coal assets, despite profitability considerations, realigning investment budgets and board-level strategies around compliance imperatives. The forward-loaded build schedule compresses project timelines, increasing execution risk and highlighting grid reinforcement needs. Coal-plant retirements squeeze reserve margins, so system planners increasingly look to hybrid renewable-plus-storage assets for dispatchable capacity.(1)Ministry of Climate and Environment, “Energy Policy of Poland Until 2040,” gov.pl
Contracts-for-Difference Auctions Reshape Market Dynamics
Poland’s CfD regime now segments tenders by technology to reflect distinctive cost curves. The December 2024 session cleared only one-third of the volume offered because developers deemed strike prices too low, signaling a maturing market in which state support must track commodity price shifts. Although undersubscribed, the tender still awarded 1.6 GW of solar projects, preserving investor confidence in photovoltaic economics. Future offshore CfD rounds, including a 4 GW auction scheduled for December 2025, provide the revenue certainty necessary for multibillion-dollar Baltic Sea arrays. Unsuccessful bidders increasingly pivot to merchant sales or corporate PPAs, broadening revenue-model diversity.(2)Energy Global Staff, “European Energy Signs Agreements to Divest Wind Portfolio in Poland,” energyglobal.com
Rapid Solar PV Cost Decline Reaches Grid-Parity Threshold
System costs for 5-10 kWp rooftop arrays fell to PLN 40,000-60,000 (approximately USD 10,000-15,000), encouraging businesses to self-generate power at a levelized cost that matches wholesale prices. Poland installed 4 GW of solar in 2024, lifting cumulative photovoltaic capacity above 15 GW. More than 11,700 prosumers in Mazowieckie already feed excess generation into local networks, and similar uptake patterns emerge in other voivodeships. Curtailment risk during summer peaks underscores the need for battery storage and demand-side flexibility solutions, stimulating new service niches that monetise balancing value.(3)Clean Energy Wire, “Dispatch from Poland | July ’25,” cleanenergywire.org
Offshore-Wind Local-Content Incentives Create Supply-Chain Momentum
Government regulations require high domestic content in Baltic Sea projects, anchoring nacelle, blade, and tower factories close to port infrastructure. The 1.14 GW Baltic Power array broke ground in February 2025, and turbine manufacturer Vestas is constructing a second offshore plant to serve the pipeline. Local content rules channel investment into port upgrades, steel fabrication, and cable manufacturing, while offering export opportunities into neighboring markets that are pursuing similar seabed concessions. Cumulative offshore commitments already exceed PLN 30 billion (USD 7.5 billion).
Restraints Impact Analysis*
| Restraint | (~) % Impact on CAGR Forecast | Geographic Relevance | Impact Timeline |
|---|---|---|---|
| Transmission-grid congestion & curtailment risk | -2.1% | Pomerania, Mazovia, Greater Poland | Short term (≤ 2 years) |
| Permitting delays & regulatory uncertainty | -1.6% | National, acute in densely populated regions | Medium term (2-4 years) |
| ‘10H’ onshore wind setback rule social opposition | -0.9% | Central and southern voivodeships | Medium term (2-4 years) |
| Source: Mordor Intelligence | |||
Transmission Grid Congestion Creates Curtailment Risk
Rapid capacity additions outpace line-reinforcement schedules, forcing the transmission system operator to curtail gigawatts of solar and wind when north-to-south power flows exceed corridor ratings. The EIB has lent PLN 1.8 billion (approximately USD 450 million) to upgrade substations and integrate new renewables, but lead times for 400 kV builds extend beyond 2027. Generators, therefore, model curtailment probabilities into financial projections, pressuring debt-service coverage ratios. Rising congestion simultaneously accelerates the battery-storage market as developers co-locate four-hour lithium-ion packs to clip peaks and shift energy into evening demand.
Permitting Delays and Regulatory Uncertainty Constrain Development
The 2024 repeal of the 10H setback unlocked new onshore wind sites, yet the replacement 750 m buffer still restricts turbine siting near residential zones. Environmental impact studies and grid-connection agreements can take 24-30 months, elongating the development cycle and escalating financing costs. Smaller independent power producers often lack the necessary legal resources to navigate the complex process of obtaining overlapping municipal, provincial, and national approvals, thereby tilting the competitive field in favor of larger utilities. Administrative reforms under discussion aim to harmonize digital application portals and standardize inspection timelines, but implementation remains uneven.
*Our forecasts treat driver/restraint impacts as directional, not additive. The impact forecasts reflect baseline growth, mix effects, and variable interactions.
Segment Analysis
By Technology: Solar Dominance Meets Geothermal Disruption
Solar retained 59.75% of the Polish renewable energy market share in 2025, with large-scale PV projects exceeding 50 MW accounting for 72% of new capacity. Bifacial panels and optimized tracker systems increased yields, enabling project breakeven points to be achieved below wholesale prices. Onshore wind growth lagged at 4% due to legacy setback rules, whereas offshore wind is set to add 3 GW by 2027, anchored by Baltica 2 and Baltic Power. Hydropower remains capped at 2.5 GW due to ecological constraints, and biomass co-firing is tapering as coal capacity declines.
Geothermal capacity, which was negligible in 2025, is expected to expand at a forecasted 41.38% CAGR to 2031, the fastest growth rate among all technologies. Feed-in premiums of EUR 45 /MWh for district-heating applications and low-temperature resources in Podhale and Szczecin underpin investor appetite. Photon Energy’s 12 MW pilot, launched in late 2024, showcases the potential for decarbonizing municipal heating.


By End-User: Utilities Lead, C&I Accelerates
Utilities held 63.05% of the Polish renewable energy market size in 2025, as state-owned PGE, Tauron, and Energa leveraged their balance-sheet strength to win CfD auctions. Their combined pipeline exceeds 6.5 GW through 2030. The commercial and industrial segment, however, is growing at a 17.28% CAGR, driven by PPAs aligned with CBAM and ESG targets. Heavy manufacturers in Silesia and Lower Silesia are locking in decade-long contracts, while mid-sized enterprises accelerate rooftop solar deployment.
Residential prosumers installed 180,000 rooftop systems in 2024, despite the shift to net billing. Yet growth moderated to 6% as payback periods stretched. Energy-security concerns following the 2022 crisis continue to support baseline demand, although remuneration schemes remain less attractive than for utility-scale assets.
Geography Analysis
Renewable capacity is concentrated along the Baltic coast, with Pomerania and West Pomerania accounting for 37.40% of the total in 2025. Shallow waters and wind speeds of 8-9 m/s favor offshore deployment; 8.6 GW is in advanced stages. Mazovia and Greater Poland account for 28.65%, driven by high irradiance and proximity to Warsaw load centers. Silesia, aided by EUR 800 million from the EU Just Transition Fund, is pivoting from coal to host 1.2 GW of renewables under construction.
Transmission reinforcements worth EUR 15 billion prioritize 1,200 km of 400 kV lines to shuttle coastal surpluses southward. Interconnectors with Germany and Lithuania are being upgraded to enable 1.5 GW of export capacity, thereby reducing curtailment during periods of high wind. Nonetheless, coastal concentration raises line losses of 6-8% on long-distance transfers.
Regional policy fragmentation persists. Pomerania offers property-tax exemptions, trimming operating costs by up to 6%. Conversely, landscape-protection statutes in Lesser Poland ban wind development across 22% of its territory. Developers consequently tailor portfolios to local rules, which inflates transaction costs and prolongs project timelines.
Competitive Landscape
Poland Renewable Energy Market is highly concentrated. PGE alone targets 6.5 GW of offshore wind by 2030, financed by EUR 5 billion secured for Baltica 2 in 2024 PGE.PL. Orlen Synthos Green Energy’s joint venture with Equinor plans to develop 2 GW of floating wind, combining local market access with technological prowess. RWE expanded its pipeline by acquiring 500 MW of onshore wind assets in 2024, positioning itself for the opportunities presented by the revised 10H framework.
Independent power producers focus on distributed commercial and industrial (C&I) solutions and geothermal heating. Photon Energy’s turnkey solar-plus-storage packages shave 12-15% off utility green tariffs. Technology differentiation is intensifying: RWE filed a patent for an offshore wind-hydrogen platform aimed at green ammonia exports, while Polish suppliers scale up monopile and nacelle production to meet local-content quotas.
Grid-access scarcity remains the biggest competitive hurdle. PSE’s 40 GW queue forces a 24-36-month wait for connection studies, diluting first-mover advantages and compressing returns. Developers able to secure early nodes, often through partnerships with state utilities, retain a distinct edge.
Poland Renewable Energy Industry Leaders
PGE Polska Grupa Energetyczna SA
Akuo Energy SAS
Engie SA
SGS SA
Dalkia Polska
- *Disclaimer: Major Players sorted in no particular order

Recent Industry Developments
- May 2025: European Energy completed the sale of its Polish wind portfolio to Enea Group, reinforcing the consolidation wave among state-backed utilities.
- April 2025: Greenvolt Group finalized the sale of a Polish wind farm, illustrating international developers’ monetization strategies.
- March 2025: European Energy agreed to divest its remaining wind assets in Poland, enabling local players to accelerate capacity additions.
- February 2025: Construction began on the 1.14 GW Baltic Power offshore wind farm, slated for commissioning in 2026.


Poland Renewable Energy Market Report Scope
Renewable energy is the energy collected from renewable resources, such as sunlight, wind, water movement, and geothermal heat, which are naturally replenished.
The Polish Renewable Energy Market is segmented by Technology (Solar Energy (PV and CSP), Wind Energy (Onshore and Offshore), Hydropower (Small, Large, PSH), Bioenergy, Geothermal, Ocean Energy (Tidal and Wave)), By End-User (Utilities, Commercial and Industrial, Residential). The Market Forecasts are Provided in Terms of Capacity (GW).
By Technology
| Solar Energy (PV and CSP) |
| Wind Energy (Onshore and Offshore) |
| Hydropower (Small, Large, PSH) |
| Bioenergy |
| Geothermal |
| Ocean Energy (Tidal and Wave) |
By End-User
| Utilities |
| Commercial and Industrial |
| Residential |
| By Technology | Solar Energy (PV and CSP) |
| Wind Energy (Onshore and Offshore) | |
| Hydropower (Small, Large, PSH) | |
| Bioenergy | |
| Geothermal | |
| Ocean Energy (Tidal and Wave) | |
| By End-User | Utilities |
| Commercial and Industrial | |
| Residential |


Key Questions Answered in the Report
What is the current size of the Poland renewable energy market?
Poland renewable energy market size reached 42.87 GW in 2026 and is forecast to hit 85.34 GW by 2031.
Which technology leads installed capacity?
Solar PV dominates with 59.75% of installed capacity in 2025, benefiting from grid-parity economics and CfD support.
How fast is offshore wind expected to grow?
Offshore wind will add roughly 3 GW by 2027, driven by projects such as Baltica 2 and Baltic Power under favorable maritime permitting.
Why are corporate PPAs gaining momentum?
Carbon Border Adjustment Mechanism compliance pressures heavy industry to lock in low-carbon electricity, spurring a 140% surge in PPA volumes in 2024.
What are the main barriers to faster renewable roll-out?
Transmission congestion, multi-layered permitting that can take up to 36 months, and lingering social opposition to onshore wind are key bottlenecks.
How concentrated is market competition?
The top five players control 52% of capacity, leaving meaningful room for independent developers, resulting in a moderate concentration score of 6.
Page last updated on:


