
Market Overview
| Study Period | 2021 - 2031 |
|---|---|
| Forecast Data Period | 2026 - 2031 |
| Base Year Market Size (2025) | 10.90 gigawatt |
| Market Volume (2026) | 15.06 gigawatt |
| Market Volume (2031) | 75.68 gigawatt |
| Growth Rate (2026 - 2031) | 38.12 % |
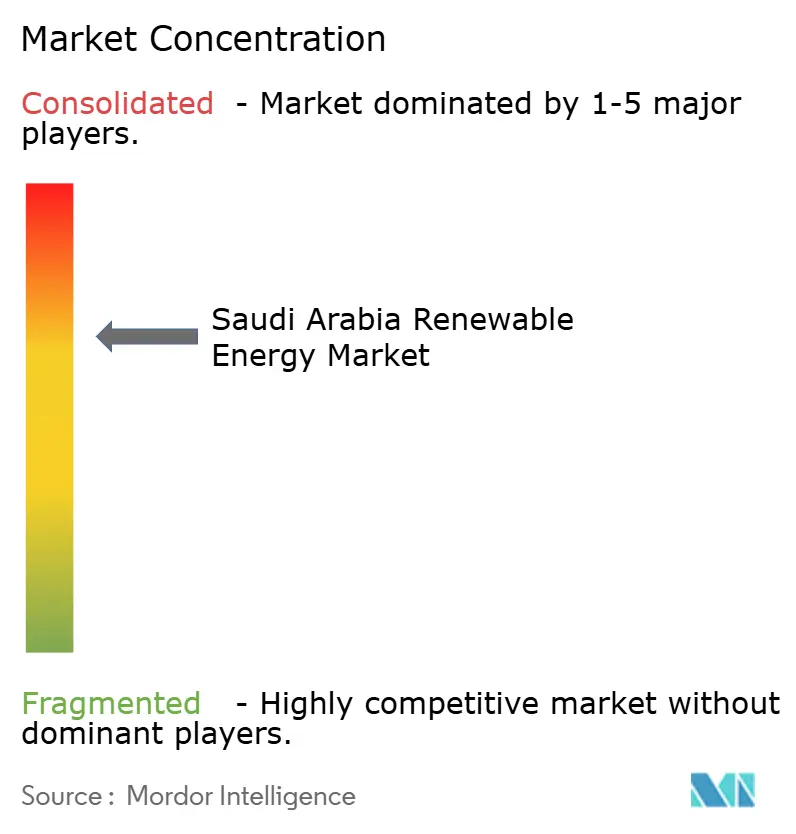
| Market Concentration | Medium |
Major Players *Disclaimer: Major Players sorted in no particular order Image © Mordor Intelligence. Reuse requires attribution under CC BY 4.0. | |
Saudi Arabia Renewable Energy Market Analysis by Mordor Intelligence
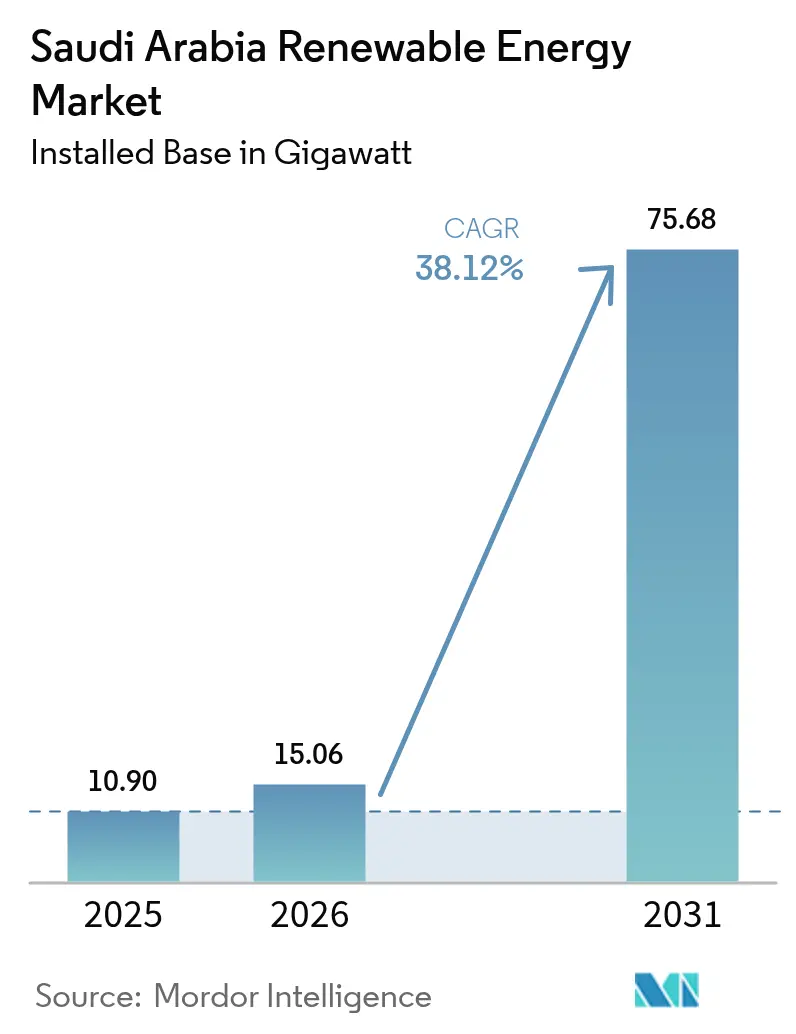
Saudi Arabia Renewable Energy market size in 2026 is estimated at 15.06 gigawatt, growing from 2025 value of 10.90 gigawatt with 2031 projections showing 75.68 gigawatt, growing at 38.12% CAGR over 2026-2031.
This highlights the Kingdom’s fastest-growing power segment and underscores its Vision 2030 decarbonization goals. Cost-competitive solar tariffs averaging USD 0.018/kWh, giga-project electricity needs, and rapidly growing green-hydrogen demand collectively reinforce long-term growth prospects. The National Renewable Energy Program’s 130 GW procurement pipeline, coupled with ambitious local-content mandates, anchors supply-chain investments and accelerates the localization of manufacturing.[1]Renewable Energy Project Development Office, “National Renewable Energy Program Update,” repdo.gov.sa Rising industrial and commercial power purchases, regulatory support for corporate PPAs, and inland wind resource diversification further broaden the Saudi Arabian renewable energy market opportunity. Meanwhile, operational challenges such as dust-driven PV efficiency losses of 15-20% annually, grid congestion in high-solar regions, and abundant USD 1.25/MMBtu natural-gas supply temper near-term adoption.
Key Report Takeaways
- By technology, solar energy leads the Saudi Arabian renewable energy market with a 93.15% share in 2025, while wind energy is projected to advance at an 81.7% CAGR through 2031.
- By end user, utilities held a 59.85% share of the Saudi Arabian renewable energy market size in 2025; commercial and industrial users are expected to expand at a 43.2% CAGR through 2031.
- By company, ACWA Power and Masdar jointly controlled 45% of the awarded capacity in 2024 within the Saudi Arabian renewable energy market.
Note: Market size and forecast figures in this report are generated using Mordor Intelligence’s proprietary estimation framework, updated with the latest available data and insights as of 2026.
Saudi Arabia Renewable Energy Market Trends and Insights
Drivers Impact Analysis*
| Driver | % Impact on CAGR Forecast | Geographic Relevance | Impact Timeline |
|---|---|---|---|
| National Renewable Energy Program (NREP) 130 GW target by 2030 | 12.50% | National, with concentration in Northern Borders and Tabuk | Long term (≥ 4 years) |
| Declining LCOE for solar PV in KSA | 8.20% | National, strongest in central and northern regions | Medium term (2-4 years) |
| Power demand from giga-projects (NEOM, Red Sea) | 6.80% | Northwestern regions, NEOM and Red Sea Project areas | Medium term (2-4 years) |
| Green-hydrogen export ambitions | 5.40% | Coastal regions with port access, NEOM corridor | Long term (≥ 4 years) |
| Desalination shift to renewables | 3.10% | Eastern and western coastal provinces | Medium term (2-4 years) |
| Corporate PPAs driven by Vision 2030 ESG pledges | 2.70% | Industrial clusters in Riyadh, Eastern Province, Jubail | Short term (≤ 2 years) |
| Source: Mordor Intelligence | |||


National Renewable Energy Program Drives Unprecedented Capacity Expansion
Round-based auctions under the National Renewable Energy Program issue predictable tenders that underpin the Saudi Arabian renewable energy market, with cumulative allocations expected to reach 17.1 GW by late 2025. Record-low tariffs below USD 0.018/kWh incentivize aggressive bidding and stimulate financing innovation. Local-content thresholds now exceed 35%, catalyzing the production of modules, inverters, and wind turbines inside the Kingdom. Project clustering in the Northern Borders and Tabuk regions exploits superior solar irradiance of 2,400 kWh/m² and 7.5 m/s hub-height winds, mitigating curtailment through geographic diversification. International IEC equipment standards ensure bankability, while streamlined permitting compresses development timelines to 24 months. The resulting visibility fortifies the Saudi Arabia renewable energy market outlook for equipment suppliers and investors alike.
Solar LCOE Competitiveness Reshapes Power-Generation Economics
Utility-scale PV costs breached the USD 0.018/kWh threshold in 2024, achieving parity with gas-fired generation even at subsidized feedstock prices. Scale economies from 1 GW-class projects, sub-4% interest-rate financing, and bifacial modules boost yields by 25-30%. Single-axis tracking maximizes daily output, mitigating dusk-period price cannibalization. Competitive LCOEs spur project oversubscription, with bids overshooting tendered capacity by threefold in Round 6. Nevertheless, USD 0.008-0.012/kWh in grid integration costs partially erode the savings. Integration spending stimulates storage adoption, opening new revenue channels within the Saudi Arabian renewable energy market for battery integrators and EPCs.
Giga-Projects Create Concentrated Renewable Demand Centers
NEOM’s USD 8.4 billion hydrogen project alone requires 4 GW of dedicated solar-wind hybrid capacity, equating to 7% of the 2030 renewables target. The Red Sea tourism development adds 650 MW of demand under a 25-year offtake contract. Their long-dated PPAs de-risk cash flows, enabling non-recourse debt with tenors beyond 20 years. Grid corridors valued at USD 2 billion enhance system resilience and advance inter-regional energy trade. Shared substations, roads, and maintenance bases lower the per-megawatt capital expenditure (capex), underscoring the cluster effect on the Saudi Arabian renewable energy market.
Green-Hydrogen Export Strategy Anchors Long-Term Renewable Demand
Plans to deliver 11 million tpa of green hydrogen by 2030 translate into 120 GW of incremental renewables, dwarfing current installed capacity.[2]Hydrogen Council, “Global Hydrogen Flows,” hydrogencouncil.com A landmark 200,000 tonnes per annum offtake agreement with Germany validates cross-border trade economics. Shipping costs range from USD 1.2 to 1.8/kg, favoring the siting of coastal electrolyzers. Domestic steel and ammonia industries absorb early volumes, smoothing ramp-up risk. Port, storage, and pipeline infrastructure needs USD 15-20 billion, unlocking EPC prospects across the Saudi Arabian renewable energy market.
Restraints Impact Analysis*
| Restraint | (~) % Impact on CAGR Forecast | Geographic Relevance | Impact Timeline |
|---|---|---|---|
| Abundant low-cost natural gas for power generation | -4.80% | National, strongest in gas-rich Eastern Province | Medium term (2-4 years) |
| Grid congestion & solar curtailment risk | -3.20% | Central and northern high-solar regions | Short term (≤ 2 years) |
| Limited local wind-component supply chain | -2.10% | National, affecting wind project economics | Long term (≥ 4 years) |
| Desert climate-driven O&M degradation | -1.90% | Desert regions, central and northern provinces | Long term (≥ 4 years) |
| Source: Mordor Intelligence | |||
Natural Gas Price Advantage Creates Adoption Headwinds
Sub-USD 0.03/kWh gas generation costs preserve economic headroom over renewables, particularly during evening peaks. Dispatchable CCGT plants stabilize frequency as renewable penetration climbs, reinforcing gas’s strategic role. Vast 300 TCF proven reserves plus Jafurah basin additions sustain low tariffs until export economics improve. Carbon-neutrality pledges and prospective LNG revenues, however, weaken long-term price caps, gradually tipping the balance in favor of the Saudi Arabian renewable energy market.
Grid Infrastructure Constraints Limit Renewable Integration
Curtailment exceeded 12% in Northern Borders during spring 2025 mid-day peaks, eroding project revenue.[3]International Energy Agency, “Saudi Arabia Energy Policy Review 2025,” iea.org Legacy transmission designed for centralized oil plants lacks dynamic-reactive support as inverter-based resources reach or exceed 30% penetration. Planned USD 8-12 billion in grid upgrades plus 1.1 GW of mandated storage in Round 7 will partially relieve constraints but extend over a 3-5-year rollout. Digital substations and demand-response programs complement hardware solutions.
*Our forecasts treat driver/restraint impacts as directional, not additive. The impact forecasts reflect baseline growth, mix effects, and variable interactions.
Segment Analysis
By Technology: Solar Dominance Faces Wind Energy Disruption
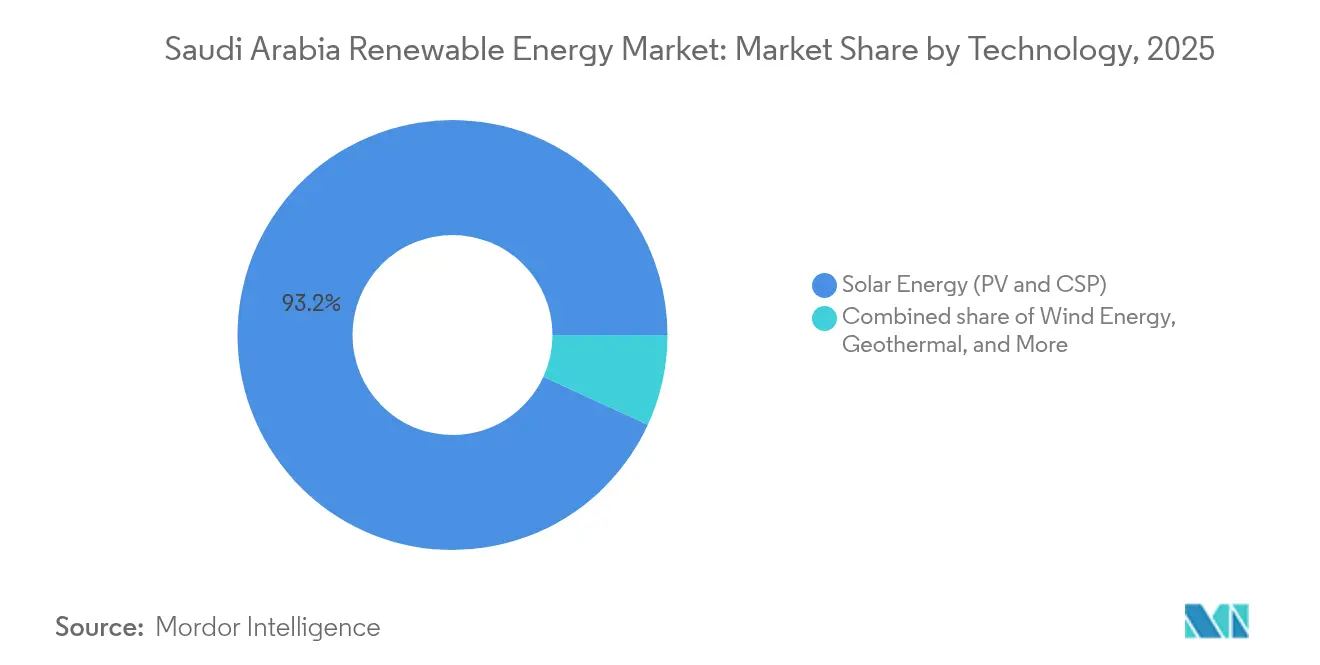
Solar held 93.15% of the 2025 Saudi Arabia renewable energy market size, benefiting from unmatched irradiance and economies of scale. Massive 1 GW-plus PV blocks near Tabuk drive single-digit USD-cent tariffs while bifacial modules and trackers lift yields across desert terrains. Nonetheless, wind’s 81.7% CAGR projects a swift ascent as Vestas and Siemens Gamesa commission high-capacity turbines optimized for 45% capacity factors. The Dumat Al-Jandal plant validated wind viability at USD 0.0199/kWh, signaling price convergence with PV. Transmission-linked hybrid layouts enhance grid stability, smooth variable output, and reduce curtailment penalties in the Saudi Arabian renewable energy market. Hydropower’s 2.4 GW pumped-storage plans will provide peak shaving, while bioenergy and geothermal remain niche plays.
Solar’s rapid scale-up faces O&M headwinds in sand-laden provinces; wind encounters supply-chain bottlenecks until local nacelle and blade manufacturing matures. Emerging floating PV on desalination reservoirs and agrivoltaic arrays in irrigation districts diversify applications beyond utility-scale deserts. Grid-code updates enable hybrid solar-wind plants to share interconnection points, reducing capital expenditures and expediting permitting. Together, these trends reinforce a balanced generation mix underpinning long-term grid resilience within the Saudi Arabian renewable energy market.


By End User: Commercial Sector Accelerates Corporate Renewable Adoption
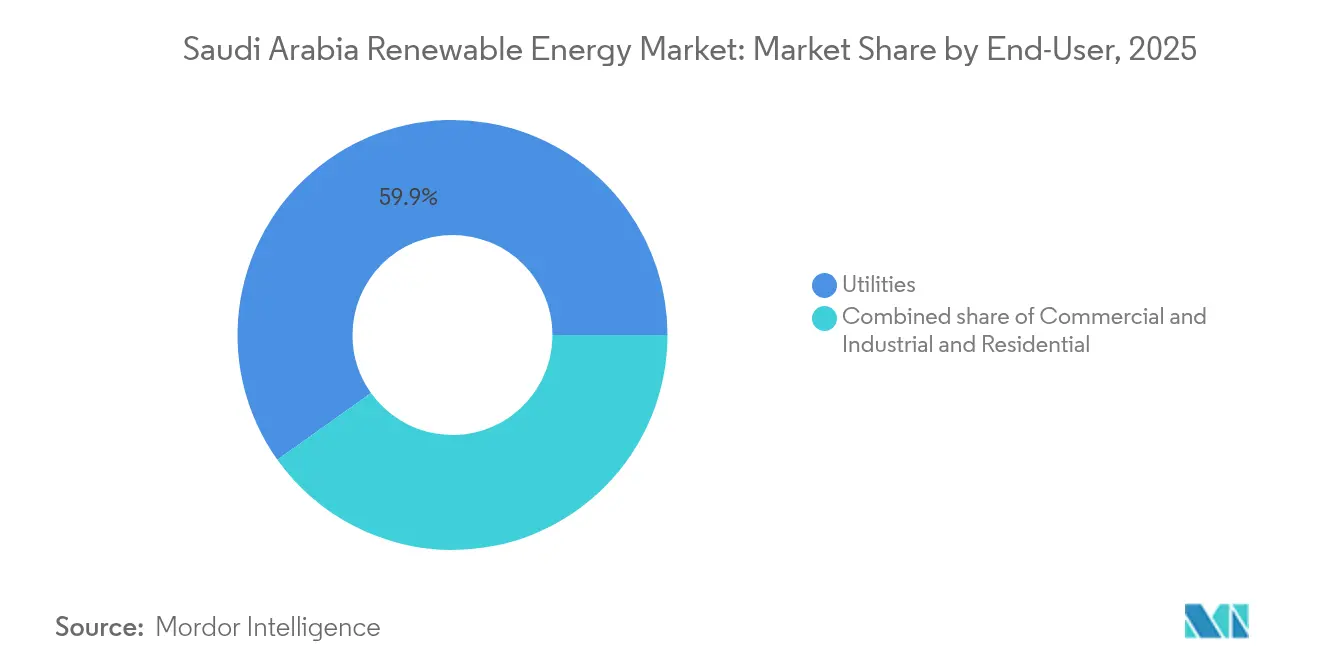
Utilities commanded 59.85% of the 2025 Saudi Arabia renewable energy market share, anchored by gigawatt procurements and vertically integrated state off-takers. They retain first-mover advantages in financing, land access, and grid interconnection. Yet commercial and industrial users collectively post a 43.2% CAGR, spurred by net-zero pledges and direct procurement rules that unlock long-tenor PPAs. Ma’aden’s 1.2 GW PPA and SABIC’s multi-site rooftop program illustrate early traction. Distributed PV offsets transmission losses and shields corporates from tariff reforms, while demand-side management and behind-the-meter batteries improve power quality.
Residential uptake stays muted under USD 0.048/kWh subsidized tariffs, although 180% annual growth in rooftop solar applications since 2024 signals rising awareness. The emergent prosumer model will reshape distribution networks, necessitating the use of smart meters, bidirectional transformers, and dynamic pricing. Energy-service companies capitalize on OPEX-driven models that bundle PV, storage, and efficiency retrofits, broadening addressable demand across the Saudi Arabian renewable energy market.
Geography Analysis
Tabuk and Northern Borders provinces dominate the capacity pipelines due to their high solar irradiance, exceeding 2,400 kWh/m², and consistent 7 m/s winds, which host 40% of the planned wind builds and multiple gigawatt PV parks. Land availability and low population density expedite permitting, while proximity to NEOM anchors offtake certainty. Eastern Province industrial hubs generate baseload demand from petrochemical and steel complexes, catalyzing the development of hybrid solar-gas arrangements and future hydrogen consumption. Riyadh’s mature grid and dense commercial load foster distributed generation; rooftop installations surged 180% year over year after net-metering rules took effect, placing the capital at the forefront of prosumer growth within the Saudi Arabian renewable energy market.
Coastal provinces are leveraging renewables to power energy-intensive desalination plants, aligning high solar output with daytime water production peaks and reducing diesel reliance. Western Red Sea sites integrate floating PV with tourism developments, minimizing land conflict. Central agricultural regions such as Qassim explore agrivoltaics to co-optimize water usage, crop yield, and electricity generation. Spatial diversification mitigates weather-related volatility and reduces single-region curtailment risks, thereby reinforcing the national grid’s stability as the Saudi Arabian renewable energy market expands.
Regulatory Landscape
Saudi Arabia regulates renewable power mainly through the Ministry of Energy, which oversees the National Renewable Energy Program (NREP), and the Saudi Electricity Regulatory Authority (SERA), which regulates electricity generation and sets frameworks for renewable systems. Utility-scale renewables are procured through SPPC (the Principal Buyer) via competitive tenders and long-term PPAs, with grid interconnection governed by Saudi Electricity Company (SEC) and National Grid SA connection processes and grid codes, including SEC wind connection guidelines.
For distributed and self-consumption projects, SERA's Regulatory Framework for Renewable Energy Generation (REG) for Self-Consumption provides the compliance pathway, including system sizing thresholds (up to 30 MW per premises) and required connection approvals with SEC/National Grid SA. On the equipment side, SASO maintains mandatory technical and safety requirements for solar PV systems (including conformity expectations), supporting compliance for imported and locally manufactured components. In July 2026, SPPC announced qualified developers for Round 7 of the NREP (5,300 MW of solar and wind), reflecting the ongoing cadence of centralized procurement under the current regulatory model.
Value Chain Analysis
The Saudi Arabia renewable energy value chain is anchored by a centralized offtake and procurement structure, where SPPC executes predevelopment studies, tenders, and long-term PPAs (and, for storage, Storage Services Agreements) that support project finance and large-scale buildout. Developers form project companies, secure land and permits, and contract EPC and O&M providers, while grid connection is handled under SEC/National Grid SA processes and technical requirements. This is reinforced by repeated NREP rounds, including Round 6 awards and Round 7 prequalification activity announced in 2026.
Upstream and midstream supply is shaped by localization programs and local-content thresholds embedded in procurement, gradually pulling manufacturing and assembly of key components (PV modules, inverters, trackers, wind components, and balance-of-plant) into the Kingdom. State-linked and in-country platforms play a significant role across the chain, including PIF-backed Badeel, Aramco-linked SAPCO, and developers such as ACWA Power, alongside international developers and OEMs that participate through consortia. Logistics and delivery draw on established import routes and industrial ecosystems, while grid integration, including large-scale storage procurement, adds demand for system suppliers, integrators, and controls providers tied to transmission and dispatch requirements (for example, prequalification of 33 firms for an initial 8 GWh BESS grouping announced in 2025).
Competitive Landscape
Market concentration remains moderate, with ACWA Power and Masdar collectively controlling approximately 45% of the awarded capacity in 2024, leveraging their extensive project finance expertise and in-country networks. New entrants, TotalEnergies, EDF Renewables, and Marubeni, gain ground via joint ventures, bidding aggressively with technology-heavy proposals such as co-located storage and hydrogen-ready designs. Patents for desert-tolerant solar trackers and extended-length wind blades increased to 127 in 2024, reflecting a shift toward localized R&D. EPC contractors bundle predictive-maintenance software and unmanned inspections to reduce OPEX by 15%, enhancing bankability across the Saudi Arabian renewable energy market.
Distributed-generation and storage niches attract specialized developers targeting commercial clients wary of curtailment risk. Equipment manufacturers respond with modular containerized batteries and turnkey microgrids aligned to Vision 2030 localization quotas. Public-sector investment vehicles launch manufacturing funds to secure upstream component supply, aiming for 50% local content by 2028. Collectively, these dynamics suggest a balanced competitive arena in which scale, technological innovation, and local partnerships dictate success trajectories.[5]World Intellectual Property Organization, “Saudi Arabia 2024 Patent Filings,” wipo.int
Saudi Arabia Renewable Energy Industry Leaders
ACWA POWER
Masdar
EDF Renewables
Engie SA
Alfanar Energy
- *Disclaimer: Major Players sorted in no particular order

Market Opportunities and Future Outlook
Opportunities in Saudi Arabia center on execution within the Ministry of Energy-led NREP pipeline and the broader Vision 2030 electricity-mix objective of 50% renewables and 50% gas by 2030. Government statistics show 6,551 MW of renewables operational by end-2024, and the market has moved into large, bankable contracting, with total signed renewable capacity reaching 43.2 GW by end-2025 and 12.3 GW connected to the grid. With SPPC's Principal Buyer model and standardized PPAs, there is room for EPC capacity, project services, and equipment supply that can meet local-content requirements.
Grid integration and hybridization form a second opportunity cluster. Storage has a formal role in procurement and planning, with targets for storage capacity and SPPC's 2025 prequalification for an initial 8 GWh BESS grouping referenced in the market context, which expands demand for battery integrators, EMS providers, and grid-services capabilities alongside solar and wind. Corporate and industrial procurement also adds pathways beyond utility IPPs, supported by SERA's self-consumption framework and rising corporate PPAs described in the market context. At the project level, hydrogen-linked demand centers increase pull for renewable build, illustrated by NEOM's multi-gigawatt renewable requirement for its hydrogen complex and progress milestones reported in 2025, alongside transmission corridors and port-adjacent infrastructure needed for export-oriented molecules.
Recent Industry Developments
- July 2026: Saudi Power Procurement Company (SPPC) published the list of qualified developers for the seventh round of the National Renewable Energy Program (NREP), covering 5,300 MW of solar and wind IPP capacity. The step supports the competitive tender pipeline and keeps procurement cadence visible for developers, OEMs, and EPCs planning capacity and localization. It also reinforces SPPC's role as the principal buyer and the standard route to bankable offtake for utility-scale renewables.
- November 2025: EDF Power Solutions, SPIC HHDC, and SAPCO achieved financial close for the 1,000 MW Al Masa'a and 400 MW Al Henakiyah-2 solar projects in Saudi Arabia. Closing financing for 1.4 GW of PV underlines lender comfort with SPPC-backed structures and moves capacity from awards into construction execution. The consortium format also highlights how local platforms and international developers combine to meet delivery and in-kingdom participation requirements.
- October 2024: Saudi Arabia reported 6,551 MW of renewable energy capacity operational by end-2024 in official renewable energy statistics. This documented operating base provides a reference point for grid integration needs, O&M scaling, and performance management in desert conditions as new capacity is added through NREP rounds. It also indicates the market has moved beyond pilots into multi-gigawatt operation, strengthening the case for local service networks and spare-parts ecosystems.


Research Methodology Framework and Report Scope
Market Definition and Coverage
This market is defined as renewable power generation capacity installed in Saudi Arabia, measured in gigawatts (GW), across grid connected and behind the meter systems that generate electricity from renewable sources.
Scope exclusions: We exclude conventional power generation, standalone grid transmission and distribution investments, and energy efficiency programs unless they directly add renewable generation capacity.
Segmentation Overview
- By Technology
- Solar Energy (PV and CSP)
- Wind Energy (Onshore and Offshore)
- Hydropower (Small, Large, PSH)
- Bioenergy
- Geothermal
- Ocean Energy (Tidal and Wave)
- By End-User
- Utilities
- Commercial and Industrial
- Residential
Data Sources, Market Sizing, and Validation
Desk Research
We started by mapping the country level renewable capacity story using public statistics and policy releases, since these help set clear guardrails on what is operating, under construction, and planned. For Saudi Arabia, sources such as the General Authority for Statistics, IRENA, IEA, and grid and energy ministry publications were used to track installed capacity, auction outcomes, and major project milestones.
To turn those signals into a market model, we also reviewed utility and developer announcements, project tender documentation, and reputable press coverage for commissioning dates and technology splits. A paid subscription focused on company financials, and a separate paid patent database were used selectively to sanity check developer pipelines, ownership structures, and technology momentum, which then gets checked again in interviews. These desk research sources are illustrative only, and many other public documents and data points were also used for collection, validation, and clarification.
Primary Interviews and Surveys
Primary work was done through expert interviews and structured surveys with project developers, EPC and O&M service providers, equipment supply chain participants, financiers, and large power buyers. We used these conversations to confirm COD timing, typical capacity factors, the share of delayed projects, and realistic build rates by technology, then to test assumptions on how policy and grid readiness could shift the outlook.
Distribution of primary research fieldwork respondents
| Company type | Respondent position |
|---|---|
| Top tier: 25% | CXOs: 16% |
| Mid tier: 57% | Functional/Unit leaders: 25% |
| Smaller Players: 18% | Managers: 59% |
Market-Sizing & Forecasting
Our sizing model is built mainly from a top-down reconstruction of installed renewable capacity in Saudi Arabia, where national statistics and project pipeline trackers are converted into annual additions and end year totals. To keep the totals realistic, the output was corroborated using selective bottom-up checks, such as sampling announced project sizes, applying typical commissioning slippage, and comparing implied annual build rates against what suppliers and contractors said can be executed.
Key inputs used in the model include installed capacity by technology (solar, wind, and others), annual new capacity awarded and commissioned, expected COD timelines for large projects, curtailment and grid connection readiness indicators, and policy targets and procurement cadence that influence the demand pool. For forecasting, scenario analysis was used so delays, faster tendering, or grid constraints could be reflected as separate paths, and then one central path was selected based on what interviewees considered the most likely execution case. When project level data was incomplete, we filled gaps using averages from comparable awarded rounds and then stress tested those assumptions through follow-up calls.
Data Validation & Update Cycle
Validation was handled through triangulation across capacity totals, annual additions, and the implied project pipeline needed to hit the forecast path, followed by targeted variance checks when a datapoint sat outside normal ranges. If the model suggested a step change in additions without a matching signal in tenders, grid connection readiness, or financing activity, the assumption was reopened and experts were re-contacted.
Before sign-off, the workbook goes through multi step analyst review so unit handling, calendar year alignment, and technology splits are consistent. Reports are refreshed annually, and interim updates are made when material awards, commissioning announcements, or policy changes shift the near term build outlook. Right before delivery, a final pass is completed so clients receive the most current view available.
Mordor Intelligence's Saudi Arabia Renewable Energy Market Estimate Compared With Other Published Estimates
Published market sizes for Saudi Arabia renewable energy often do not match, because the unit of measurement and what is being counted can change from one publisher to another. Some estimates talk about revenue and investment value, while others focus on installed capacity, and even then the timing of what is considered operational versus planned can differ.
In this market, the biggest gap drivers are usually whether the number is in USD versus gigawatts, whether it includes only grid connected utility projects or also behind the meter systems, and how aggressively future tender awards are assumed to convert into commissioned capacity. The spread also grows when forecasts assume different commissioning slippage rates, use different currency conversion timing for CAPEX style estimates, or are updated less frequently than the project award calendar.
Benchmark comparison
| Source | Market Size | Gaps in Research Methodology |
|---|---|---|
| Mordor Intelligence | USD 15.06 B (2026) | |
| Global Publisher A | USD 30.48 B (2024) | This figure is presented as a USD revenue style market value, which can fold in CAPEX, services, or broader power sector economics rather than sizing installed renewable capacity additions. |
| Industry Publisher B | USD 2.84 B (2025) | This estimate is capacity led but uses a smaller installed base snapshot and a different forecast window, and it can diverge if project commissioning timing and inclusion of smaller behind the meter builds are treated differently. |
The table shows that the comparison is not like for like in many cases, because some numbers are value based and others are capacity based, and the timing assumptions can swing the totals. By keeping the unit tied to installed capacity, and counting additions only once they are supported by project award and commissioning evidence, the estimate stays more traceable to execution reality, which is the approach used here, including by Mordor Intelligence.


Key Questions Answered in the Report
How large is the Saudi Arabia renewable energy market today?
Installed capacity reached 10.90 GW in 2025 and is set to hit 15.06 GW in 2026 on its way to 75.68 GW by 2031.
What is the expected growth rate for renewables in Saudi Arabia?
The sector is forecast to expand at a 38.12% CAGR between 2026 and 2031, driven by Vision 2030 procurement targets.
Which technology dominates new capacity additions?
Solar currently holds 93.15% share, but wind is the fastest-growing segment with an 81.7% CAGR through 2031.
Why are corporates signing power-purchase agreements?
Vision 2030 ESG mandates and cost-competitive solar tariffs encourage industrial and commercial firms to secure fixed-price renewable power.
What challenges could slow renewable deployment?
Low-cost natural gas, grid congestion, supply-chain gaps for wind components, and desert-related O&M issues can dampen near-term adoption.
How will green hydrogen influence future demand?
Plans for 11 million tpa of green hydrogen by 2030 require roughly 120 GW of renewables, ensuring long-term demand for new projects.
Page last updated on:


 Your data is secure and never sold or shared.


