
Market Overview
| Study Period | 2021 - 2031 |
|---|---|
| Forecast Data Period | 2026 - 2031 |
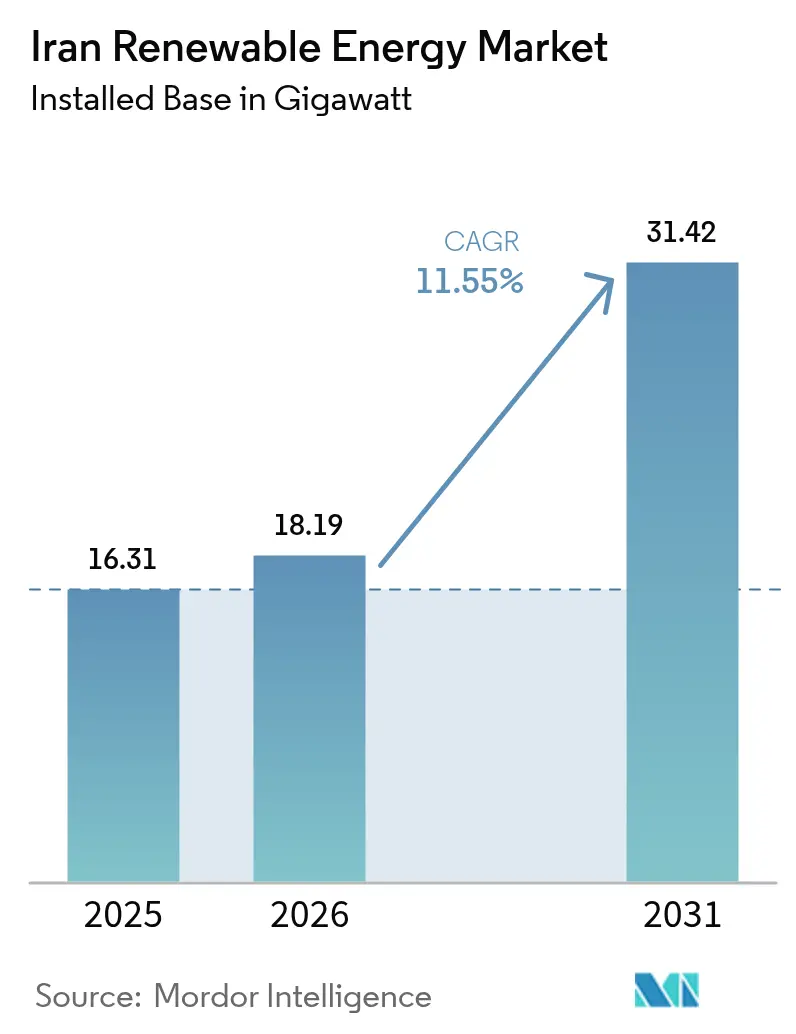
| Base Year Market Size (2025) | 16.31 gigawatt |
| Market Volume (2026) | 18.19 gigawatt |
| Market Volume (2031) | 31.42 gigawatt |
| Growth Rate (2026 - 2031) | 11.55 % |
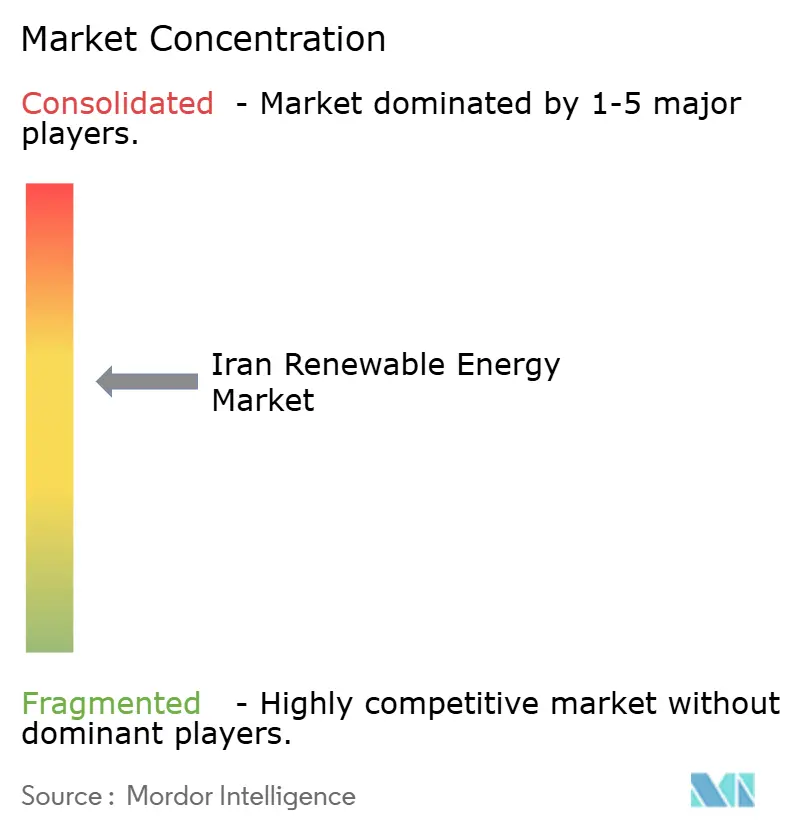
| Market Concentration | Medium |
Major Players *Disclaimer: Major Players sorted in no particular order Image © Mordor Intelligence. Reuse requires attribution under CC BY 4.0. | |
Iran Renewable Energy Market Analysis by Mordor Intelligence
The Iran Renewable Energy market size is expected to grow from 16.31 gigawatt in 2025 to 18.19 gigawatt in 2026 and is forecast to reach 31.42 gigawatt by 2031 at 11.55% CAGR over 2026-2031.
The upswing reflects an urgent policy push to erase a 14,000 MW summer supply gap while hedging sanctions risk through domestic resource mobilization. Hydropower remains the anchor asset class, yet the government’s March 2025 approval of 29,000 MW in new solar projects marks a strategic pivot toward diversified technologies that can deploy faster than conventional capacity. Streamlined permitting, widening private-sector access to offtake contracts, and the roll-out of a real-denominated electricity trading platform combine to improve bankability across project classes. Currency volatility, fossil-fuel subsidies, and congested transmission corridors continue to temper headline growth but have also catalyzed localization programs that protect developers from imported-equipment price spikes. In parallel, record-setting wind performance and early-stage geothermal exploration underscore the technical depth now forming beneath the headline expansion, positioning the Iranian renewable energy market as a central pillar of the country’s broader economic diversification agenda.
Key Report Takeaways
- By technology, hydropower held an 88.65% share of the Iranian renewable energy market in 2025, while geothermal is projected to compound at a 55.9% CAGR through 2031.
- By end-user, utilities captured 58.85% of the Iranian renewable energy market share in 2025, whereas commercial and industrial buyers are advancing at a 14.85% CAGR to 2031.
Note: Market size and forecast figures in this report are generated using Mordor Intelligence’s proprietary estimation framework, updated with the latest available data and insights as of 2026.
Iran Renewable Energy Market Trends and Insights
Drivers Impact Analysis*
| Driver | (~) % Impact on CAGR Forecast | Geographic Relevance | Impact Timeline |
|---|---|---|---|
| Government 10-GW target to 2025 | +3.2% | National, with early gains in Tehran, Isfahan, Fars | Short term (≤ 2 years) |
| High solar & wind resource availability | +2.8% | National, concentrated in Sistan-Baluchistan, Yazd, Kerman | Long term (≥ 4 years) |
| Rising electricity demand & supply-gap risk | +2.4% | National, acute in industrial centers | Medium term (2-4 years) |
| Climate-diversification & Paris commitments | +1.3% | National, aligned with international frameworks | Long term (≥ 4 years) |
| Localization incentives under sanctions | +1.2% | National, manufacturing hubs in Tehran, Isfahan | Medium term (2-4 years) |
| Off-grid solutions for remote communities | +0.8% | Rural and nomadic regions, border provinces | Long term (≥ 4 years) |
| Source: Mordor Intelligence | |||
Government 10-GW Target Catalyzes Regulatory Transformation
A 10-GW headline target to 2025 rewired Iran’s permitting culture, compressing solar approval cycles from years to months and unlocking 29,000 MW of photovoltaic projects in Q1 2025 alone.[1]Tehran Times, “Iran issues permits for 29 GW of solar,” tehrantimes.com SATBA now operates a single-window platform that issues grid-connection assurances alongside land-use licenses, slashing legal uncertainty and cutting developer transaction costs. Presidential oversight gives the target political weight that transcends ministerial reshuffles, embedding renewables into national energy-security calculations. The policy tailwind raises execution risk on the grid side, as transmission upgrades must keep pace with the project avalanche; failure to do so could strand roughly one-third of the permitted megawatts by 2027. Nonetheless, the Iranian renewable energy market benefits from the clearest forward visibility it has witnessed in two decades, triggering long-cycle procurement and local-manufacturing investments that were previously untenable.
High Solar and Wind Resource Availability Enables Cost-Competitive Generation
More than 300 sunny days a year and wind corridors recording steady 7 m/s speeds supply natural cost advantages that few peer markets can match. The United Nations pegs the country’s exploitable wind potential near 20 GW, while biomass opportunities sit close to 800 MW, offering diversification beyond headline solar growth.[2]United Nations, “Renewable roadmap for Iran,” un.org MAPNA’s Mil Nader Wind Farm verified the theoretical upside, posting an 85.49% capacity factor in June 2024, a world record and a practical demonstration that Iranian wind assets can behave like baseload plants. Solar levelized electricity costs already sit within the subsidized fossil-fuel tariff band in Yazd and Kerman, erasing the historical premium that hobbled bankability. Resource concentration, however, imposes a north-south transmission dilemma; wind-rich Sistan-Baluchistan remains distant from Tehran’s load centers, pressing policymakers to prioritize 400-kV backbone expansion. Geothermal prospects surface in West Azarbaijan, where exploratory drilling has confirmed reservoir temperatures above 120 °C, sufficient for binary-cycle power units according to preliminary SATBA data released in 2024 Tehran Times.
Rising Electricity Demand Transforms Energy-Security Calculus
Peak load breached 72,000 MW in 2023, leaving operators short by 14,000 MW during July heatwaves and forcing emergency mazut burn that choked urban air quality. Demand is climbing by roughly 5,000 MW a year, outstripping the construction tempo of large thermal stations that require multiyear lead times. Consequently, policymakers have recast the Iranian renewable energy market as a reliability instrument rather than an environmental luxury. Hydropower’s reservoir deficits, down to 40% storage on average, further sharpen the urgency. Modular solar and wind plants, deployable in 12-18 months, now function as the first line of defense against regional blackouts, aligning investor interests with grid-stability imperatives.
Climate Diversification Creates Strategic Autonomy Opportunities
Iran’s Paris pledge, to peak emissions before 2030, overlaps with sanctions-driven capital famine in the hydrocarbon sector, elevating renewables from policy choice to strategic necessity. Vision 2031 scales ambition to 30 GW of clean capacity, a 13-fold leap from 2021 installations. Labor-ministry modeling suggests that each gigawatt of solar and wind supports 45,000 job-years across manufacturing and construction, linking decarbonization to employment creation. Bilateral accords with China supply polysilicon, trackers, and balance-of-plant services that Western suppliers cannot export under current sanctions, allowing the Iranian renewable energy industry to hedge technology risk and build local fabrication clusters. Emerging policy drafts propose hydrogen hubs leveraging low-temperature geothermal brine, targeting cost windows of USD 0.59–5.97 per kilogram by 2035 under research scenarios published in the International Journal of Hydrogen Energy.
Restraints Impact Analysis*
| Restraint | (~) % Impact on CAGR Forecast | Geographic Relevance | Impact Timeline |
|---|---|---|---|
| US sanctions restrict finance & tech inflow | -2.8% | National, acute in international partnerships | Medium term (2-4 years) |
| Subsidised fossil-fuel tariffs undercut RE | -1.9% | National, concentrated in industrial and residential sectors | Long term (≥ 4 years) |
| Currency volatility inflates project CAPEX | -1.4% | National, equipment import dependencies | Short term (≤ 2 years) |
| Grid congestion in high-resource provinces | -1.2% | Regional, Sistan-Baluchistan, Kerman, Yazd | Medium term (2-4 years) |
| Source: Mordor Intelligence | |||
Subsidized Fossil-Fuel Tariffs Distort Renewable Economics
Retail electricity averages USD 0.014 per kWh, well below the USD 0.035 cost-recovery point for gas-fired generation, crowding out full-tariff solar PPAs. Treasury models estimate the subsidy drain to be near 11% of fiscal revenue in 2025, yet phased reform remains politically fraught given wage stagnation and inflation above 35%. Industrial power users enjoy deeper discounts, placing utility-scale renewable bids at a structural disadvantage. A draft energy-price reform introduced to parliament in April 2025 proposes tiered tariffs that would lift large-user rates 60% by 2028, a shift that could unlock faster uptake in the Iranian renewable energy market if enacted.[3]JPIA, “Energy-subsidy reform scenarios,” jpia.princeton.edu
Currency Volatility Inflates Project Capital Expenditures
A 28% real slide versus the U.S. dollar between January 2024 and March 2025 inflated imported PV module prices in local terms by 34% despite global cost declines. Developers now race to front-load foreign-currency procurement or negotiate indexed EPC contracts, both tactics that bloat working-capital requirements. SATBA’s move to pay renewable offtake tariffs in hard-currency-linked rials stabilizes future cash flows but does not shield sponsors during construction. Localization eases the pain yet cannot cover all components, leaving the Iranian renewable energy market exposed to periodic currency shocks that thin project pipelines.
*Our forecasts treat driver/restraint impacts as directional, not additive. The impact forecasts reflect baseline growth, mix effects, and variable interactions.
Segment Analysis
By Technology: Geothermal Disrupts a Hydropower-Dominated Landscape
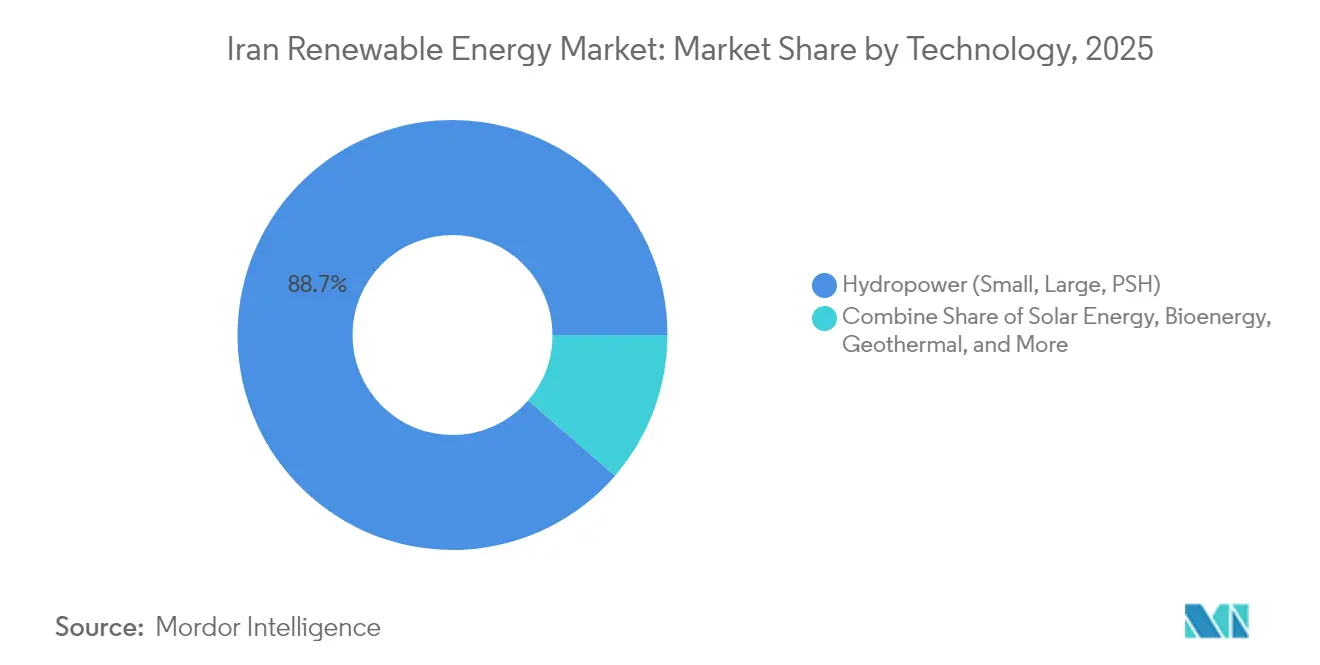
Hydropower supplied 88.65% of Iran's renewable energy market share in 2025, reflecting half a century of dam construction. Yet drought-driven inflow declines and sedimentation now shave annual energy output 12% below nameplate, exposing reliability gaps. In contrast, geothermal is set to grow at a 55.9% CAGR to 2031, leveraging high-enthalpy fields in West Azarbaijan where pilot slim-hole wells logged 120–150 °C gradients. A 5 MW binary-cycle demonstration unit slated for 2026 will test reservoir sustainability under commercial drawdown, and success could unlock a 250 MW provincial build-out by 2030, according to SATBA's feasibility docket. Solar enjoys strong policy momentum: the Iranian renewable energy market size for PV is projected to exceed 7.9 GW by 2031, buoyed by a 600 MW build in 2024 alone and an unprecedented 29 GW permit pipeline. Wind remains the performance standout; Mil Nader's 85.49% capacity factor validates turbine engineering and site selection, positioning onshore fleets as dispatchable complements to midday solar surges. Bioenergy's niche role expanded in April 2024 when a 10 MW waste-to-energy plant entered commercial operation near Tehran, diverting 400 t/day of municipal waste from landfills and advancing circular-economy objectives.
Complementarity emerges as developers co-locate PV arrays at hydropower reservoirs, using daytime solar to conserve water for evening peaking. Aftab-e-Sharq, Iran's largest solar complex, exemplifies scale economics: a 600 MW ultimate build, sponsored by Mobarakeh Steel Company, will feed baseload demand for a captive industrial offtaker, creating a template for vertical integration. Looking ahead, floating PV pilots on hydrodams and hybrid PV-geothermal configurations in Kordestan could diversify resource risk while improving thermal efficiency, accelerating the Iran renewable energy market's migration toward a multi-technology portfolio.



By End-User: Commercial and Industrial Buyers Accelerate Distributed Generation
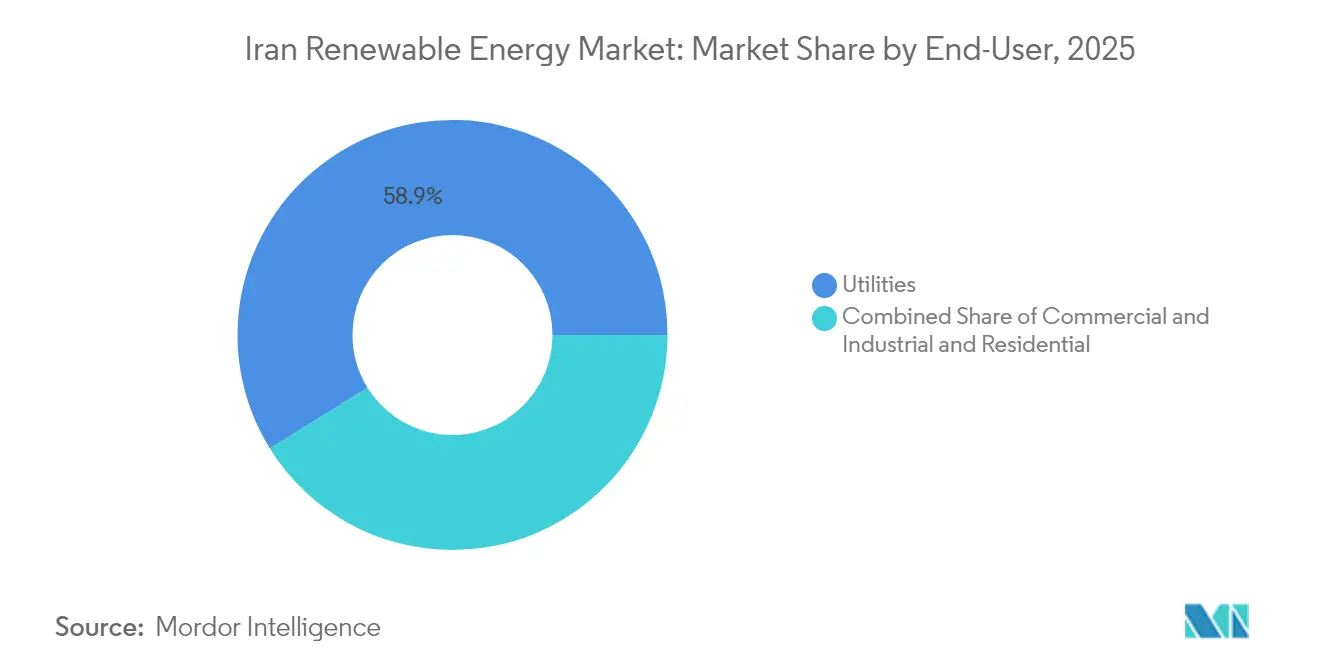
Utilities still dominate the Iranian renewable energy market size with a 58.85% share in 2025, courtesy of exclusive grid-scale project mandates and guaranteed purchase agreements. Their pipeline includes 600 under-construction renewable plants totaling 13.5 GW, reflecting the state utility’s central role in capacity planning. Yet commercial and industrial (C&I) procurement is the fastest riser, expanding at 14.85% CAGR as corporate carbon targets and blackout hedging reshape investment calculus. The Aftab-e-Sharq project’s steel-sector sponsorship illustrates how heavy industry now views self-generation as strategic to maintaining export competitiveness amid looming carbon-border adjustments in destination markets. Smaller C&I buyers leverage rooftop and carport PV financed through five-year lease-to-own contracts, with payback periods compressed below four years in peak-irradiation zones once self-consumption savings are netted. The residential slice lags due to ultra-low retail tariffs, yet off-grid households in Kerman and Hormozgan demonstrate latent appetite when cost parity aligns with diesel avoidance.
Policy shifts may accelerate C&I growth: SATBA’s February 2025 decree allows direct bilateral PPAs between generators and large consumers, bypassing utility intermediation. Early adopters include two cement plants contracting a combined 80 MW of wind to stabilize power feed at kilns. If grid-wheeling penalties remain modest, analysts expect C&I share to climb to 24% of the Iranian renewable energy market by 2031, signaling a structural rebalancing of demand centers.
Geography Analysis
Central provinces, Isfahan, Fars, and Yazd, account for roughly 36% of the active solar pipeline, thanks to irradiation levels above 2,200 kWh/m² and proximity to industrial off-takers. In May 2025, a 297 MW tranche of solar projects launched construction across these three provinces, underwritten by a USD 96 billion multi-year capital envelope approved by the Planning and Budget Organization. Farther south, Hormozgan's coastal belt hosts the country's first utility-scale battery-coupled PV station, a 50 MW array paired with 25 MWh of lithium storage designed to smooth evening ramp-up.
Sistan-Baluchistan stands out for wind: modeled technical potential exceeds 10 GW, yet only 180 MW is operational due to transmission pinch points. The region nevertheless anchors Iran's renewable energy market narratives, given performance records that rival the best onshore sites worldwide. Government allocation of sovereign bonds to fund a 400-kV double-circuit line into Kerman underscores recognition that resource-to-grid misalignment is an economic drag. Northern Gilan and Mazandaran leverage hydro assets but now pilot floating PV on dam reservoirs to fight evaporation loss, adding generation while preserving water levels for irrigation and drinking supply. West Azarbaijan emerges as the geothermal frontier; a cluster of 30 thermal springs near Khoy city positions the province for baseload renewable output once drilling risk is derisked via an upcoming Japan-Iran geophysical survey scheduled for 2026.
Remote border provinces adopt off-grid models. Since 2019, 28,000 nomadic households received subsidized solar kits, and the Ministry of Agriculture now plans to integrate drip-irrigation pumps into a second-phase rollout, linking energy access to food security goals. Collectively, these geography-specific approaches weave a patchwork of assets that together strengthen the overall Iranian renewable energy market against hydrological volatility and seasonal demand spikes.
Regulatory Landscape
Iran’s renewable market is primarily governed by the Renewable Energy and Energy Efficiency Organization (SATBA) under the Ministry of Energy, which issues permits and administers procurement mechanisms such as guaranteed power purchase agreements and the green trading board at the energy exchange. A 2025 amendment to the bylaw on removing barriers to renewable power plant construction strengthened the Ministry of Energy’s mandate to identify project sites and define equipment standards, tightening compliance requirements around technical specifications, environmental review, and grid-connection readiness.
Grid integration requirements also became more explicit with the Ministry of Energy releasing a technical Grid Code framework for connecting inverter-based renewable plants (as of December 2025). On the revenue side, guaranteed purchase rates were updated effective March 21, 2026 (1405), including 58,540 Rials/kWh for solar plants up to 200 kW and 46,386 Rials/kWh for 200 kW to 1 MW. The capacity ceiling for certain branch power plants increased from 200 kW to 400 kW, supporting small and medium project sizing and distributed deployment.
Competitive Landscape
Domestic firms dominate installed capacity, with MAPNA Group alone holding close to 28% of commissioning and EPC contracts across wind, solar, and hydro. Its vertically integrated model, covering turbine manufacture, inverter assembly, and O&M services, helps the company absorb sanction-related supply shocks, reinforcing its lead. The firm’s Aftab-e-Sharq solar complex, currently at 20 MW grid-tied and scaling toward 600 MW, will use in-house trackers and an updated SCADA overlay, consolidating ecosystem control. SUNIR, Tamin Energy, and Iran Water and Power Resources Development Company follow, each focusing on niche technologies or specific provinces to differentiate.
International presence persists through low-visibility equipment partnerships. Vestas and Siemens Gamesa license tower fabrication to local yards, circumventing direct export prohibitions while seeding advanced metallurgy standards. TotalEnergies maintains a knowledge-sharing MOU on hybrid solar-gas microgrids, though no direct equity stakes exist. Chinese module majors, JA Solar, LONGi, Trina, supply panels under deferred-payment structures indexed to future aluminum exports, a barter mechanism that sidesteps foreign-exchange scarcity. Competitive intensity now shifts toward storage integration and predictive-maintenance software; firms capable of bundling digital twins with EPC bids win O&M annuities that raise switching costs for utilities. Analysts expect new entrants in the Iranian renewable energy industry to cluster around value-added niches, energy management systems, green-hydrogen electrolysis, and medium-speed flywheels, rather than commodity generation where MAPNA’s scale is hard to dislodge.
Iran Renewable Energy Industry Leaders
Noursun Energy Aria
Mapna Group Company
Ghadir Investment Company
Farab Company
Taban Energy
- *Disclaimer: Major Players sorted in no particular order

Market Opportunities and Future Outlook
A policy-driven build pipeline is creating near-term whitespace across utility-scale and distributed projects, particularly where permitting and offtake rules have been clarified. As of March 2026, active construction of 2,878 MW across 26 provinces and a broader set of sites under development indicates a sizable addressable EPC and equipment market in the short cycle.
Financing and localization form a second opportunity layer under sanctions constraints. The National Development Fund of Iran has been positioned as a key capital channel for renewables, including referenced approvals tied to multi-gigawatt solar build-outs, while domestic manufacturing and assembly efforts are expanding into enabling technologies such as storage and hybrid inverter packages. This mix supports project activity in solar-plus-storage at industrial sites, grid-supporting inverter-based plants under the updated connection framework, and region-specific deployments that pair high-resource provinces with transmission and flexibility investments.
Recent Industry Developments
- June 2026: SATBA reported USD 900 million in resources attracted for renewable development and outlined a 500 MW solar project fund. It also authorized hybrid inverter packages for residential and commercial use, supporting faster rollouts of distributed solar and solar-plus-storage configurations.
- December 2025: MAPNA Group and SATBA signed an MoU to commission a lithium-ion battery cell manufacturing plant linked to renewable infrastructure needs. The move reinforces localization efforts for storage supply, a key constraint for integrating inverter-based renewables and smoothing peak-demand shortfalls.
- June 2024: MAPNA delivered record wind performance at the Mil Nader Wind Farm, reporting an 85.49% capacity factor for the month. The result strengthened the investment case for high-capacity-factor wind corridors and supported utility interest in wind as a firmness-enhancing complement to solar-heavy build plans.


Research Methodology Framework and Report Scope
Market Definition and Coverage
For this study, the market is defined as Iran's total installed renewable power generation capacity that is grid connected and operational, expressed in gigawatts, across technologies such as solar, wind, hydro, and other renewables.
Scope exclusions: We exclude fossil fuel generation, nuclear generation, and pipeline stage projects that are announced but not yet commissioned into capacity.
Segmentation Overview
- By Technology
- Solar Energy (PV and CSP)
- Wind Energy (Onshore and Offshore)
- Hydropower (Small, Large, PSH)
- Bioenergy
- Geothermal
- Ocean Energy (Tidal and Wave)
- By End-User
- Utilities
- Commercial and Industrial
- Residential
Data Sources, Market Sizing, and Validation
Desk Research
Desk research was used to build the factual base for the capacity model and to set realistic constraints around project timing. We referenced public and official sources such as national energy statistics and planning documents, grid and system operator releases, renewable energy agency updates, and customs or trade statistics that can indicate equipment inflows for new builds.
To cross-check installation pace and commissioning visibility, we also reviewed company annual reports and investor presentations where available, reputable press coverage of project awards, and association websites that publish market notes. In a few cases, subscription databases were used only for structured company financials, patent activity screening, and high level shipment and tender tracking that supports triangulation of additions. These sources are illustrative and not exhaustive, since many other documents were reviewed for data collection, validation, and clarification.
Primary Interviews and Surveys
We interview and survey developers, utilities, equipment providers, engineering firms, financiers, and energy specialists active in Iran. Respondents help clarify commissioning dates, technology mix, procurement conditions, and the distinction between permitted, under-construction, and operating plants. Their input is used to address gaps in public records and revise assumptions when field evidence differs from published data.
Distribution of primary research fieldwork respondents
| Company type | Respondent position |
|---|---|
| Top tier: 28% | CXOs: 20% |
| Mid tier: 47% | Functional/Unit leaders: 30% |
| Smaller Players: 25% | Managers: 50% |
Market-Sizing & Forecasting
The core sizing starts from a top-down capacity build, where the historical installed base is reconstructed and then extended using expected annual additions and retirements that are consistent with policy direction and grid absorption. To keep the totals realistic, we applied checks on how fast projects can move from award to commissioning, and the share of planned capacity that typically slips into later years.
In parallel, selective bottom-up approximations were used to corroborate the totals, such as rolling up visible project pipelines, sampling typical project sizes by technology, and using equipment lead times as a reasonableness check on annual build rates. Where project level detail was incomplete, we handled gaps by using conservative commissioning ratios derived from expert feedback and recent execution patterns.
Key inputs that shaped the model included installed capacity by renewable technology, average capacity factors, grid connection and curtailment signals, commissioning lead times, and the pacing implied by announced tenders and policy targets. For forecasting, we relied on scenario analysis for near-term execution risk and then used smoothing on the long-run build trajectory, with assumptions stress-tested through expert consensus on delays, financing constraints, and equipment availability.
Data Validation & Update Cycle
Validation was done through multiple checks so the capacity path did not rely on one data line. Model outputs were compared against independent signals such as public capacity statements, visible commissioning events, and technology level build patterns, and then variances were reviewed and corrected if they could not be explained.
Before final sign-off, the work goes through step-by-step analyst review, including unit checks, growth-rate sanity checks, and outlier review for years that show unusual jumps. If a major variance appears, we re-contact sources to confirm whether it is a data issue or a real market execution change. The report is refreshed annually, and interim updates are made when material policy, grid, or project execution changes occur, followed by a final pre-delivery pass to ensure the latest view is reflected.
Mordor Intelligence's Iran Renewable Energy Market Size Versus Other Published Estimates
Published market numbers for Iran renewables often do not match because the unit of measurement and the counting logic can be very different across sources. Some studies talk in revenue terms, others talk in installed capacity, and even within capacity, treatment of pipeline projects and distributed systems can shift the total.
A second driver is how assumptions are refreshed, since currency conversion timing and equipment price swings can move revenue-based market values quickly. Some estimates also blend power generation with broader clean energy themes (like efficiency or electrification), which changes what is being counted before the forecast even starts.
Benchmark comparison
| Source | Market Size | Gaps in Research Methodology |
|---|---|---|
| Mordor Intelligence | USD 16.31 B (2025) | |
| Global Consultancy A | USD 1.80 B (2024) | Uses revenue sizing rather than installed capacity, so pricing, currency timing, and what counts as market value can compress or inflate totals versus a capacity-based view. |
| Industry Publisher B | USD 18.19 B (2026) | Appears to publish a forward-year capacity figure and may include planned builds as if they are commissioned, which can pull forecast capacity into the stated market year. |
The table shows that most of the spread comes from mixing value-based reporting with capacity-based reporting and from how strictly commissioning is treated in the stated year. Some publications fold pipeline capacity into the total to present a faster ramp. In Mordor Intelligence, capacity is counted only after it is operational and grid connected, which keeps the number tied to what can actually generate power in that year.


Key Questions Answered in the Report
How large is the Iran renewable energy market today?
Installed capacity reaches 18.19 GW in 2026 and is projected to hit 31.42 GW by 2031, a 11.55% CAGR.
Which technology dominates current installations?
Hydropower provides 88.65% of installed capacity, reflecting historic dam investments.
What segment is expanding fastest?
Geothermal leads growth with a projected 55.9% CAGR through 2031 as drilling begins in West Azarbaijan.
How do sanctions affect renewable projects?
Sanctions lift financing costs by up to 300 bps and limit access to high-efficiency equipment, pressing developers to localize supply chains.
Why are commercial and industrial buyers important?
C&I offtakers are growing at 14.85% CAGR, leveraging behind-the-meter solar and wind to cut costs and hedge blackout risk.
What grid challenges threaten future growth?
Transmission congestion in wind-rich provinces and limited storage deployment could curtail up to one-third of new capacity without timely upgrades.
Page last updated on:


 Your data is secure and never sold or shared.


