Energy & Power
30th JulyUnlocking Market Potential for Solid-State Transformers
3 Min Read
The India Renewable Energy Market Report is Segmented by Technology (Solar Energy, Wind Energy, Hydropower, Bioenergy, Geothermal, and Ocean Energy) and End-User (Utilities, Commercial and Industrial, and Residential). The Market Sizes and Forecasts are Provided in Terms of Installed Capacity (GW).
Market Overview
| Study Period | 2020 - 2030 |
|---|---|
| Base Year For Estimation | 2024 |
| Forecast Data Period | 2025 - 2030 |
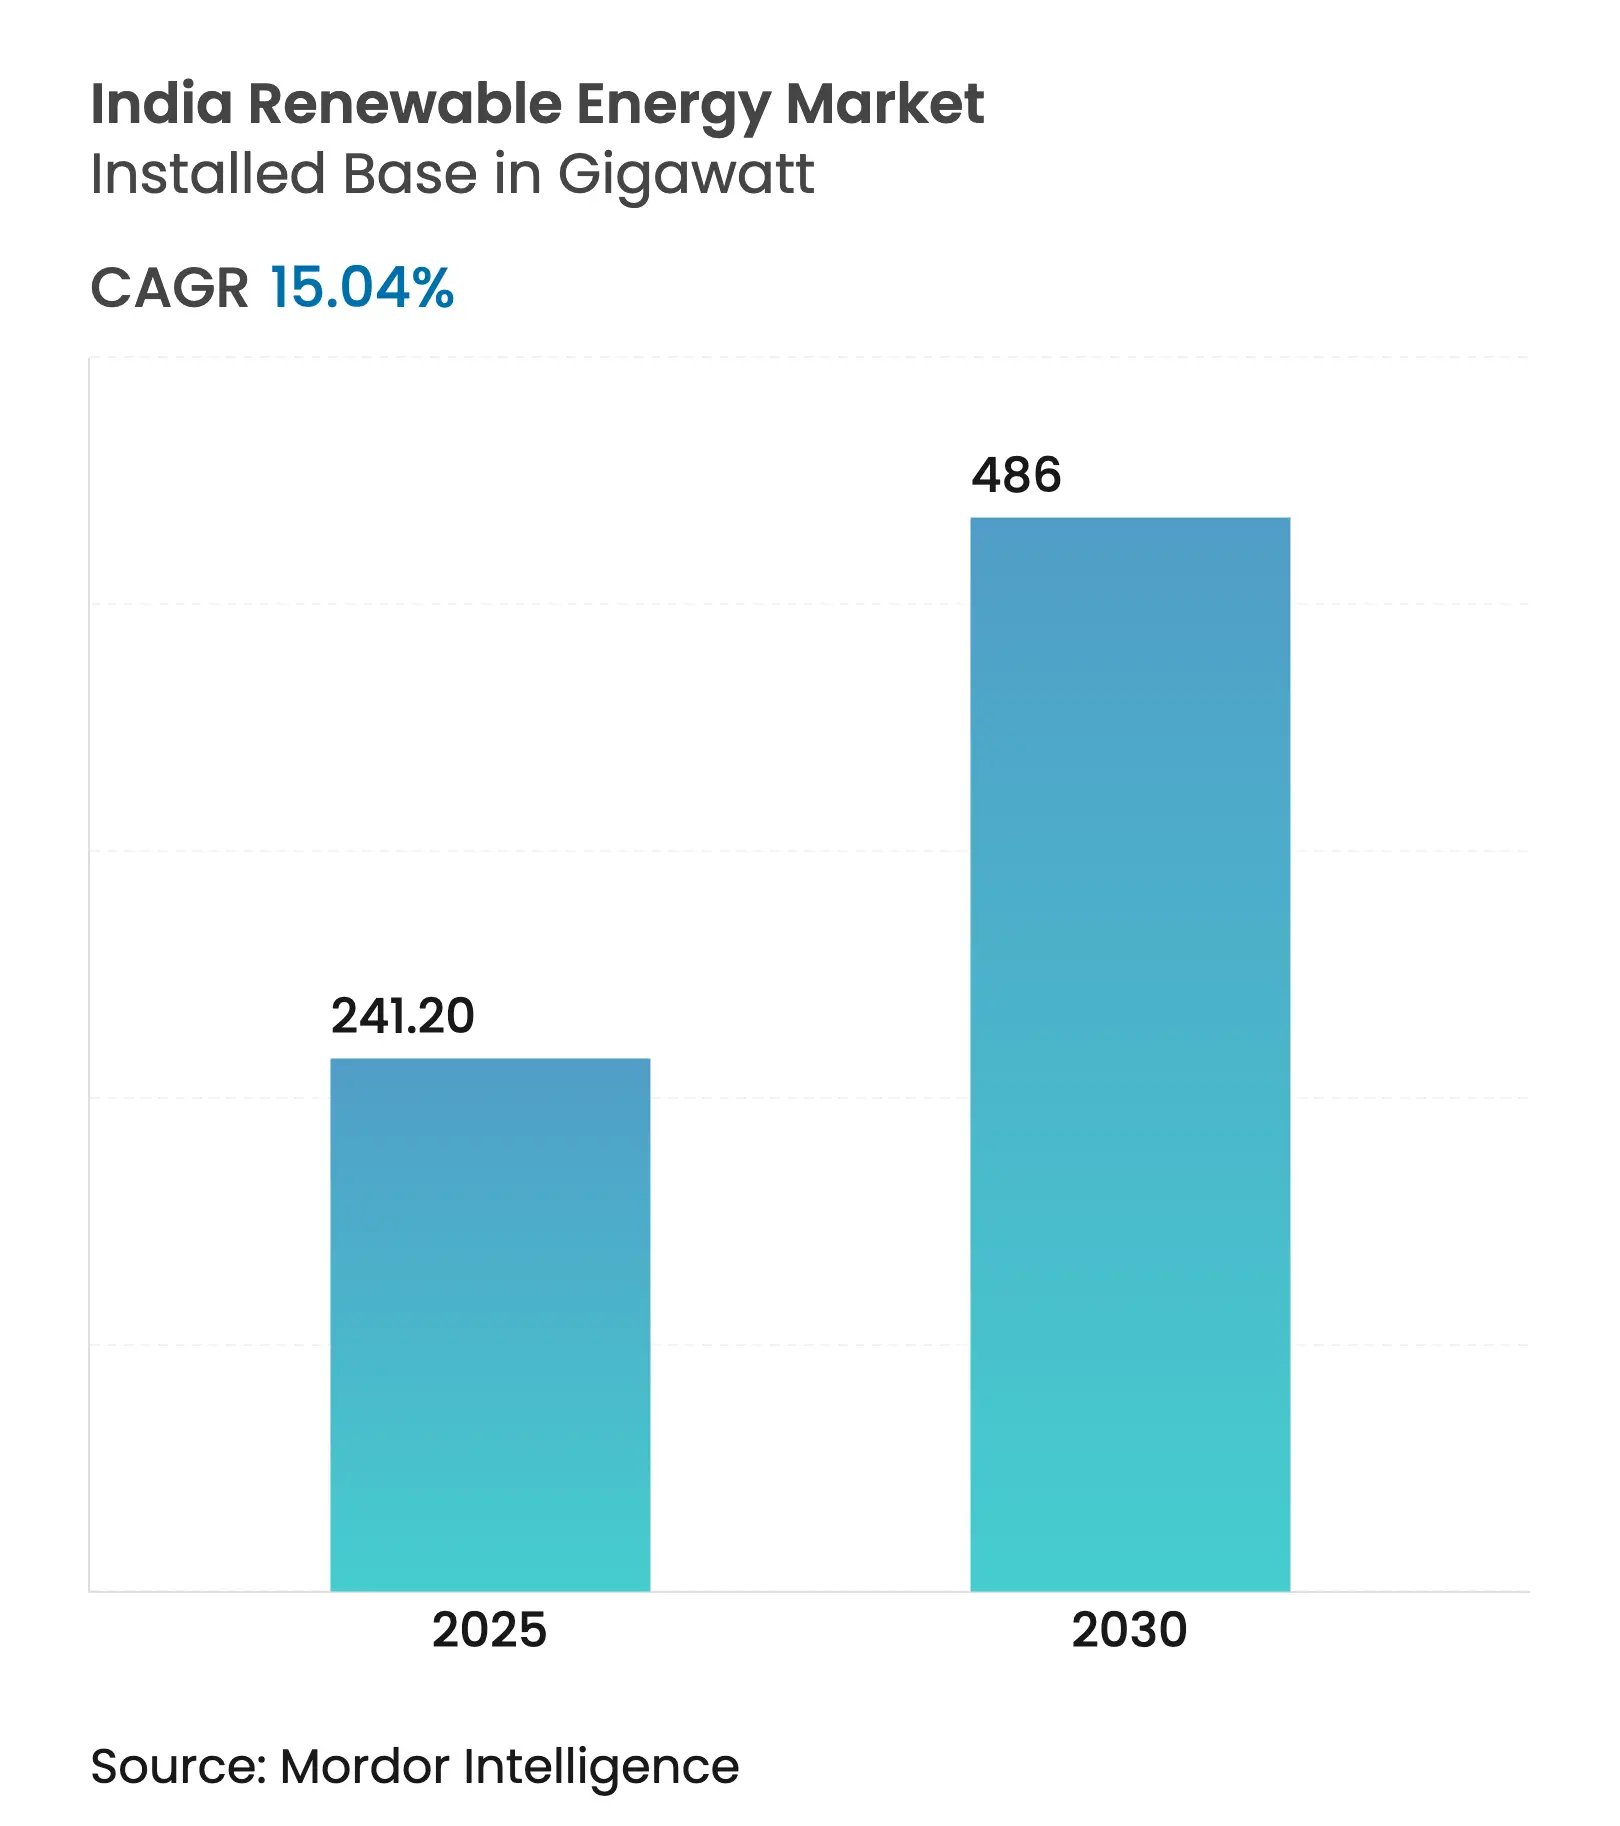
| Market Volume (2025) | 241.20 gigawatt |
| Market Volume (2030) | 486 gigawatt |
| CAGR | 15.04 % |
| Market Concentration | Medium |
Major Players *Disclaimer: Major Players sorted in no particular order. Image © Mordor Intelligence. Reuse requires attribution under CC BY 4.0. |
Declining technology costs, aggressive auctions, and policy tools such as PM-KUSUM and the Production-Linked Incentive (PLI) scheme have created a self-reinforcing cycle of scale and cost reduction. Solar’s expanding dominance, commercial and industrial (C&I) procurement surge, and a widening pipeline of hybrid-plus-storage tenders are redefining competitive dynamics and spurring record capital inflows. At the same time, grid bottlenecks, DISCOM payment delays, and critical-mineral exposure threaten to temper momentum if left unresolved. Nevertheless, the India renewable energy market continues to demonstrate strong investor confidence, underscored by USD 86 billion in fresh commitments announced at recent summits.[1]Press Information Bureau, “India Adds 29.5 GW of Renewable Capacity in FY 2025,” pib.gov.in
Key Report Takeaways
Drivers Impact Analysis
| Driver | (~) % Impact on CAGR Forecast | Geographic Relevance | Impact Timeline | |||
|---|---|---|---|---|---|---|
Falling LCOE of Solar PV & Wind Falling LCOE of Solar PV & Wind | +3.20% | Rajasthan, Gujarat, Karnataka, national roll-out | Medium term (2-4 years) | (~) % Impact on CAGR Forecast:+3.20% | Geographic Relevance:Rajasthan, Gujarat, Karnataka, national roll-out | Impact Timeline:Medium term (2-4 years) |
Aggressive Central & State-Level RE Auctions Aggressive Central & State-Level RE Auctions | +2.80% | National, led by SECI and major state agencies | Short term (≤ 2 years) | |||
Renewable Purchase Obligations & ESCerts Renewable Purchase Obligations & ESCerts | +2.10% | Maharashtra, Tamil Nadu, Andhra Pradesh, national coverage | Medium term (2-4 years) | |||
Surge in Green-Power PPAs from C&I Off-takers Surge in Green-Power PPAs from C&I Off-takers | +2.40% | Industrial belts in Maharashtra, Karnataka, Gujarat | Medium term (2-4 years) | |||
Production-Linked Incentive for Manufacturing Production-Linked Incentive for Manufacturing | +2.60% | Manufacturing hubs in Gujarat, Uttar Pradesh, Odisha | Long term (≥ 4 years) | |||
Hybrid + Storage Tender Structure Hybrid + Storage Tender Structure | +1.90% | Rajasthan, Karnataka, Andhra Pradesh, national pilots | Long term (≥ 4 years) | |||
| Source: Mordor Intelligence | ||||||
Falling LCOE of Solar PV & Wind
Record solar tariffs of INR 2.51/kWh have been achieved on the back of PLI-supported module production and technology gains, reducing import dependence from 90% in 2020 to below 60% in 2025. Wind’s cost trajectory is similar, though slower, yet 25.4 GW of repowering potential for sub-2 MW turbines offers further cost optimization. The merging of solar, wind, and coal cost curves has reached a tipping point where renewable additions are now the default choice for new capacity.
Aggressive Central & State-Level RE Auctions
Solar Energy Corporation of India (SECI) and state agencies issued 7.6 GW of tenders in H1 2024, 191% higher year-on-year, while evolving bid structures now require storage and domestic content to enhance grid integration.[2]Solar Energy Corporation of India, “Bid Documents and Auction Results,” seci.co.in Visibility of 132.7 GW of projects through 2026 gives developers confidence to expand manufacturing and project pipelines.
Renewable Purchase Obligations & ESCerts Enforcement
A 43% Renewable Purchase Obligation (RPO) for 2030 anchors demand, yet uneven state compliance indicates room for policy tightening. New carbon trading rules due in 2026 are expected to create parallel demand for clean power certificates.
Surge in Green-Power PPAs from C&I Off-takers
Commercial and Industrial renewable procurement is booming as corporates view clean power as both a cost hedge and a sustainability lever. Fourth Partner Energy, for example, raised USD 275 million to deliver 3.5 GW to global customers such as Walmart and Unilever. Streamlined open-access rules and forthcoming virtual PPA frameworks are set to further accelerate uptake.
Restraints Impact Analysis
| Restraint | (~) % Impact on CAGR Forecast | Geographic Relevance | Impact Timeline | |||
|---|---|---|---|---|---|---|
DISCOM Financial Stress & Payment Delays DISCOM Financial Stress & Payment Delays | −2.4% | Uttar Pradesh, Rajasthan, Tamil Nadu, national issue | Short term (≤ 2 years) | (~) % Impact on CAGR Forecast:−2.4% | Geographic Relevance:Uttar Pradesh, Rajasthan, Tamil Nadu, national issue | Impact Timeline:Short term (≤ 2 years) |
Land-Acquisition & Right-of-Way Bottlenecks Land-Acquisition & Right-of-Way Bottlenecks | −1.8% | Maharashtra, Madhya Pradesh, Chhattisgarh, national dispersion | Medium term (2-4 years) | |||
Critical-Mineral Supply-Chain Exposure Critical-Mineral Supply-Chain Exposure | −1.3% | Imports from China, Chile, Australia | Long term (≥ 4 years) | |||
Rising Curtailment & Grid Congestion Rising Curtailment & Grid Congestion | −1.6% | Rajasthan, Karnataka, Andhra Pradesh, Gujarat | Medium term (2-4 years) | |||
| Source: Mordor Intelligence | ||||||
DISCOM Financial Stress & Payment Delays
Distribution losses above 20% in several states continue to erode DISCOM liquidity, delaying payments and discouraging new projects despite payment-security mechanisms.[3]Policy Circle, “DISCOM Financial Health Review,” policycircle.org Structural reforms in tariff setting and subsidy rationalization remain essential.
Land-Acquisition & Right-of-Way Bottlenecks
Competition with agriculture and conservation areas slows project timelines. Supreme Court directives on Great Indian Bustard habitats initially stalled Rajasthan and Gujarat projects before revised guidelines restored clarity.
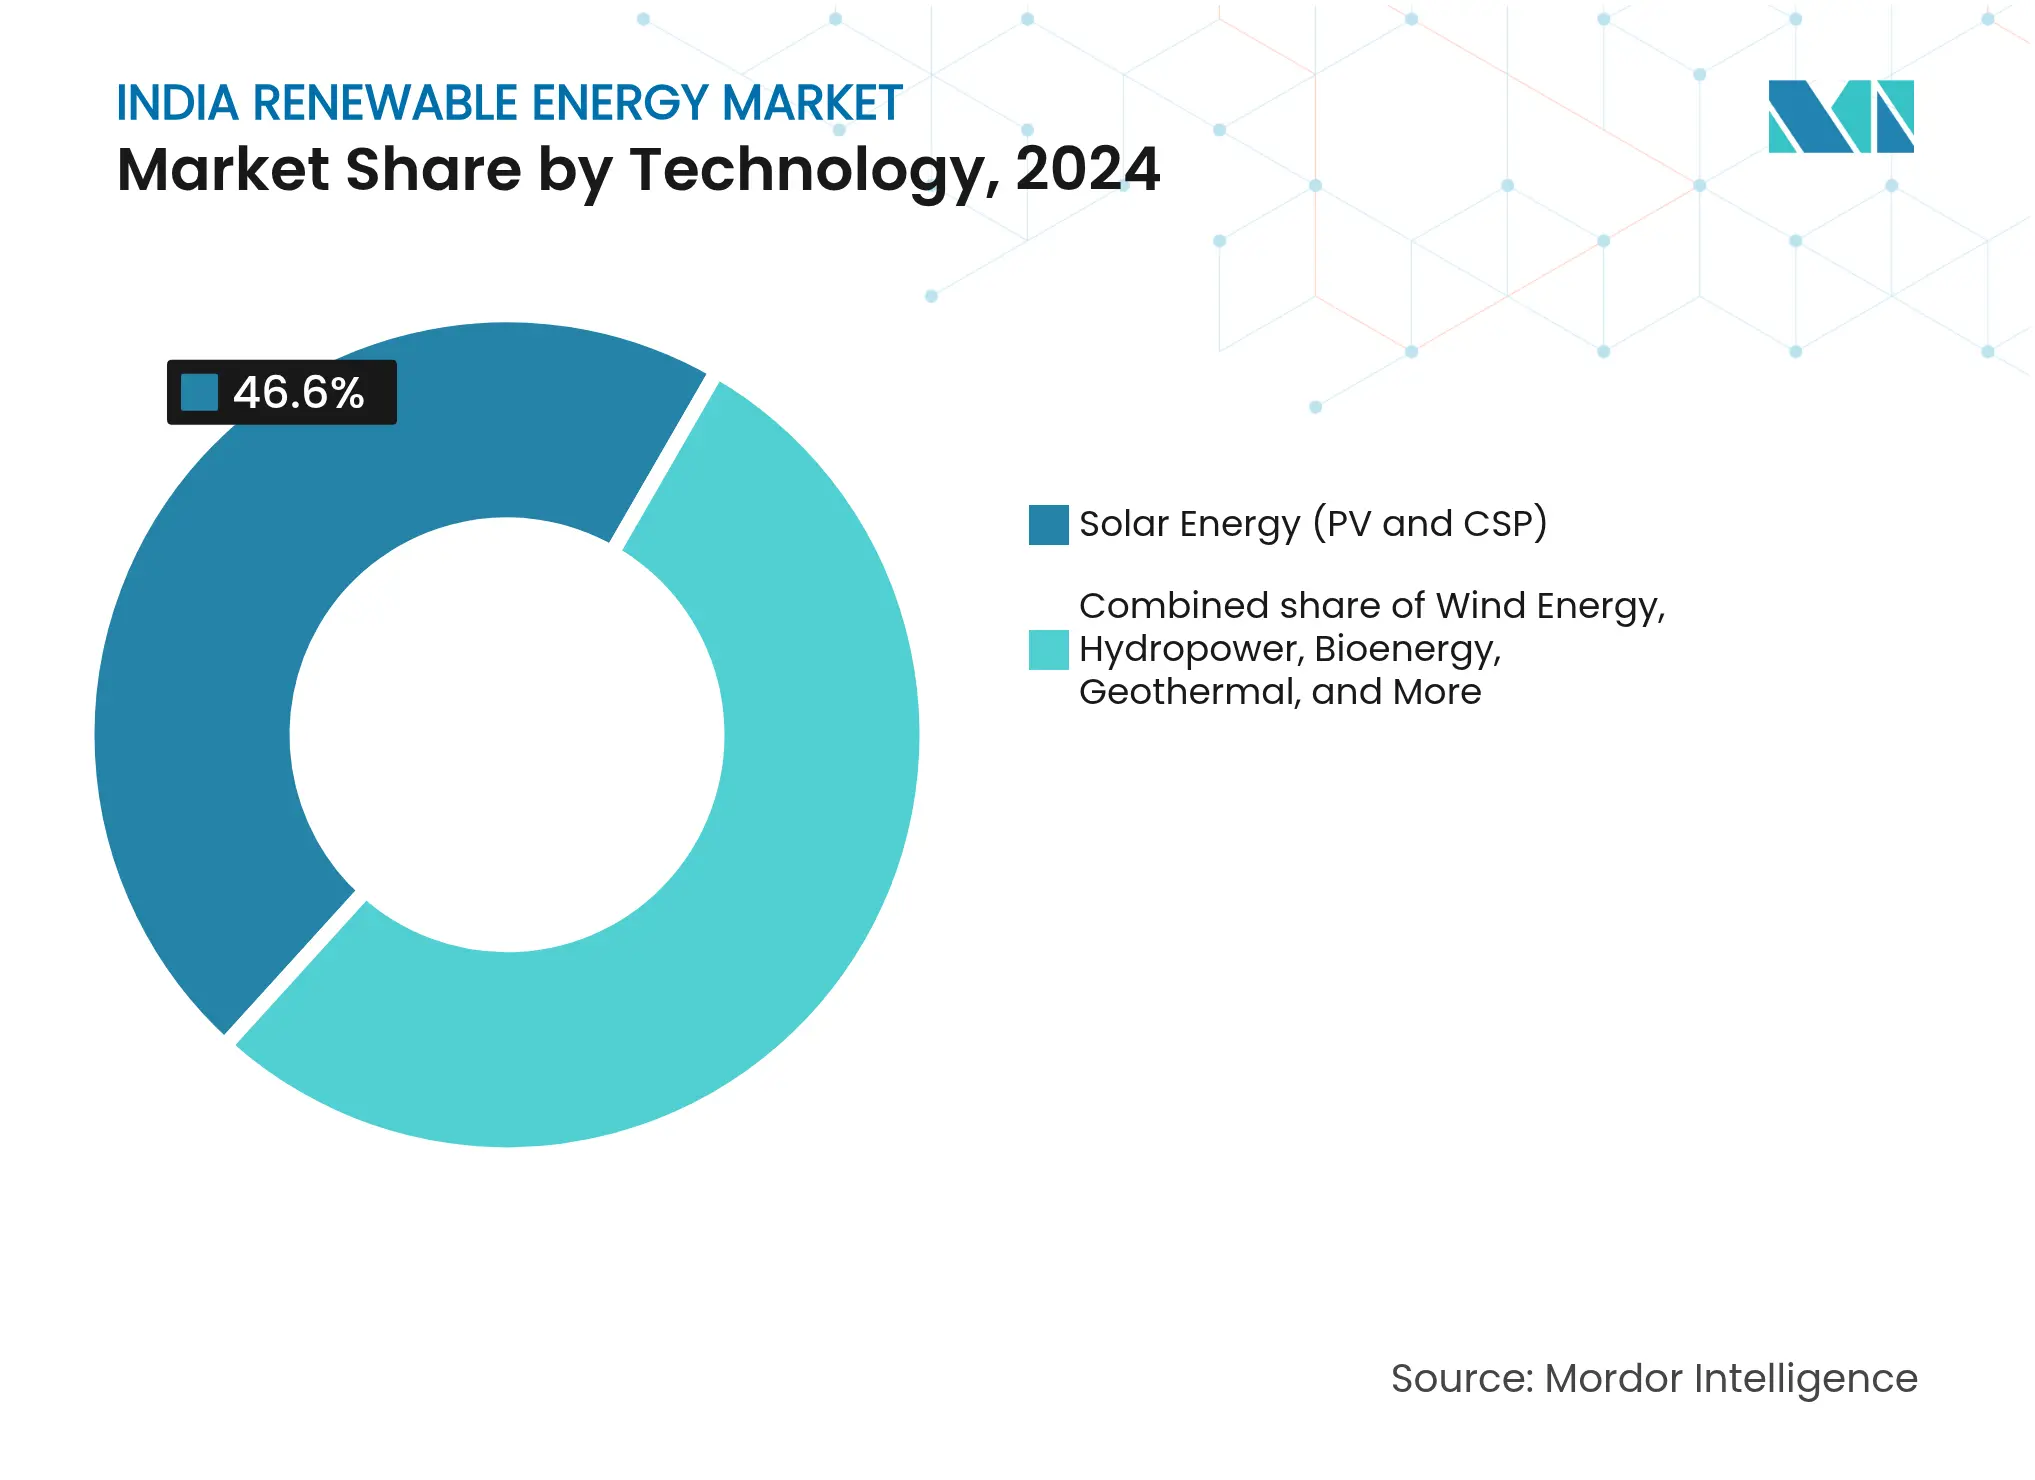
By Technology: Manufacturing Surge Anchors Solar Dominance
Solar Energy’s 46.6% share in 2024 is rooted in the rapid scale-up of domestic factories to 38 GW of modules a year, slashing logistics delays and supporting auctions below thermal parity. The segment’s contribution to the India renewable energy market size is set to widen as utility parks in Rajasthan and Gujarat routinely clear bids near INR 2.5 per kWh, prompting coal retirements across northern load centers. Rooftop solar crossed 11 GW on residential incentives, though net-metering disputes still curb adoption. CSP remains a niche at just 0.5 GW, given its premium capex.
Wind capacity growth is slower because domestic nacelle lines cover barely 40% of annual demand, forcing import reliance. Onshore bids in Tamil Nadu at INR 2.79 per kWh keep the resource competitive, but land and right-of-way hurdles delayed 2.8 GW of awarded projects in 2024. Offshore wind blocks totaling 37 GW have been demarcated off Gujarat and Tamil Nadu, yet environmental reviews extend the first power past 2028. Hydropower stands at 51 GW, with pumped-storage retrofits adding long-duration flexibility, but seven-year build times dampen its near-term impact. Geothermal, though tiny today, shows the fastest growth trajectory as Ladakh pilots head for the demonstration stage. Bioenergy and ocean technologies remain experimental and account for marginal volumes.
Note: Segment shares of all individual segments available upon report purchase
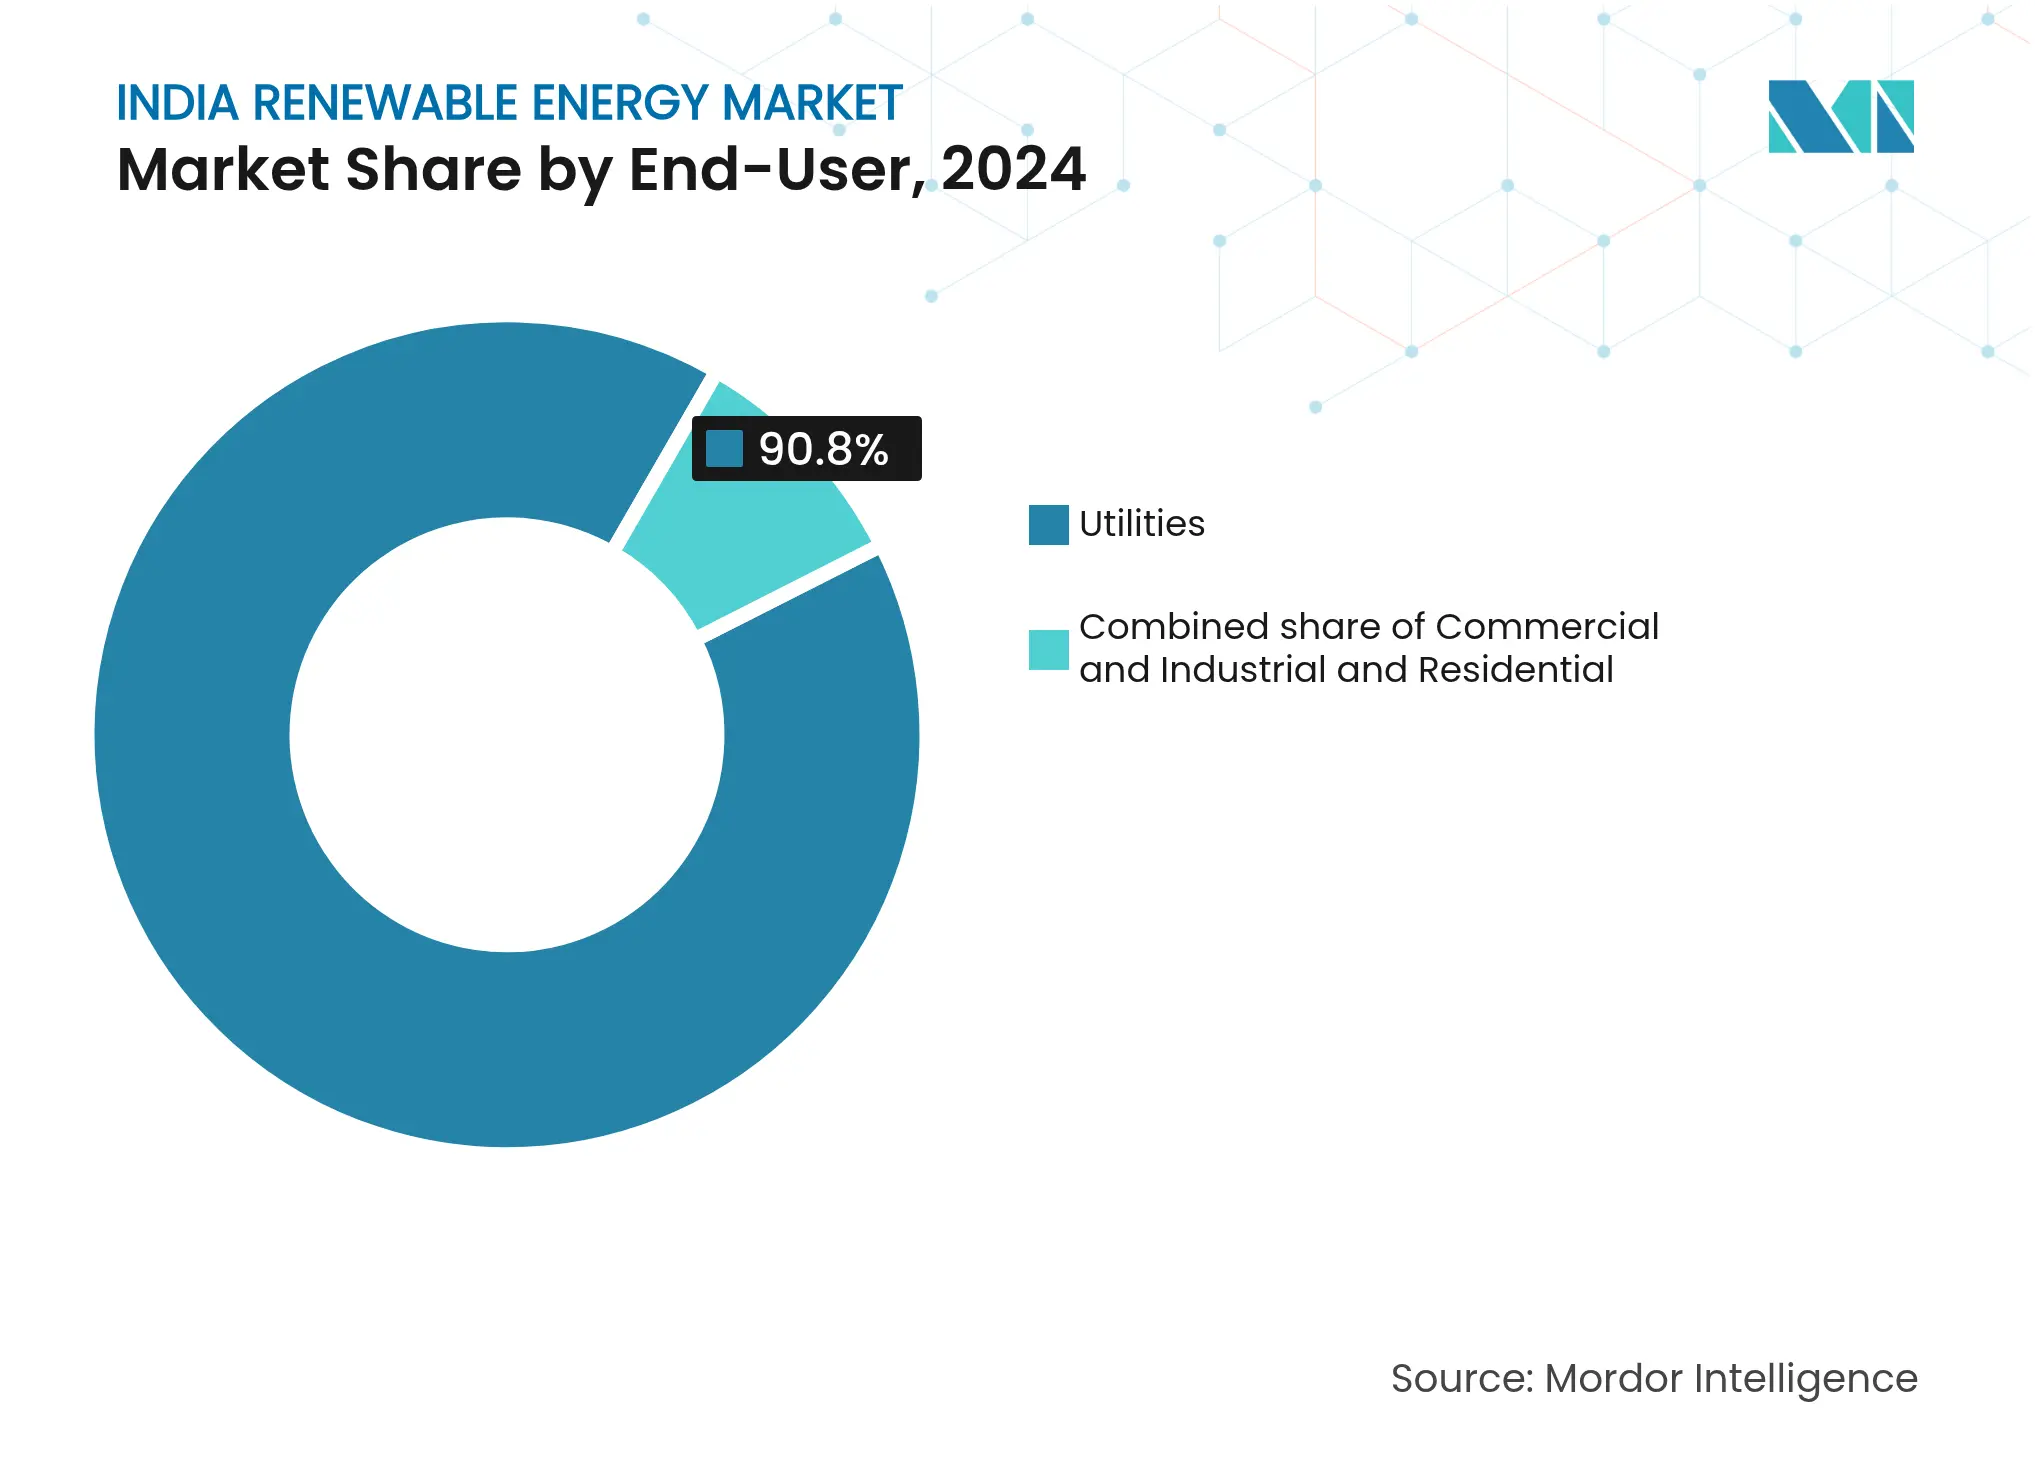
By End-Use Sector: Corporate Procurement Reshapes Market Dynamics
Utilities still purchase 90.8% of renewable output under 15-to-20-year PPAs that anchor most project finance, yet payment delays and rising RPO compliance costs are squeezing their balance sheets. Falling tariffs allow state agencies to add 19 GW of capacity awards in fiscal 2024-25, but the India renewable energy market is witnessing a tilt as commercial-and-industrial buyers sign direct PPAs to cut Scope 2 emissions. The C&I tranche is compounding at 18.8% a year and now pursues group-captive models that pool smaller loads, spurring third-party developers to roll out zero-capex offers.
Industrial clusters in Maharashtra, Gujarat, and Karnataka signed 9.2 GW of PPAs in 2024, exploiting wheeling charges below INR 0.50 per kWh. Rooftop schemes for residences account for barely 1.2% of capacity, in part because net-metering credits often sit well under retail tariffs, elongating payback to almost a decade. Upcoming policy tweaks aim to shift DISCOMs toward a wires-only role, letting them earn on wheeling rather than volumetric sales, which could unlock more distributed generation in housing and small business segments.
Note: Segment shares of all individual segments available upon report purchase
Rajasthan leads the India renewable energy market with 29.98 GW installed in 2024, followed by Gujarat at 29.52 GW, Tamil Nadu at 23.70 GW, and Karnataka at 22.37 GW. Combined, these four states hold more than half of the national capacity. Concentration enhances scale economies and strains existing corridors, prompting a USD 500 billion grid-upgrade roadmap to FY 2050.[4]Financial Express, “USD 500 Billion Grid Investment Need,” financialexpress.com
Karnataka and Gujarat rank highest on power-transition readiness, balancing high variable generation with stable networks, while Uttar Pradesh and West Bengal remain fossil-dominant. The India renewable energy market size for emerging hubs such as Madhya Pradesh is set to accelerate as NTPC earmarks INR 2 lakh crore for new solar, wind, and pumped-hydro assets.
Northeastern states receive 50% capital grants for renewables to offset terrain-related costs, yet logistical hurdles limit deployment. Manufacturing concentration in Gujarat, Tamil Nadu, and Rajasthan streamlines supply chains but creates regional risk; policymakers are exploring incentives for new factories in central and eastern India. Ultra-Mega Renewable Energy Parks planned in less-developed regions aim to spread capacity growth and reduce over-reliance on a handful of states.

Reports are available across multiple geographies.
Gain in-depth market insights across regions to support informed decisions.
Market Concentration
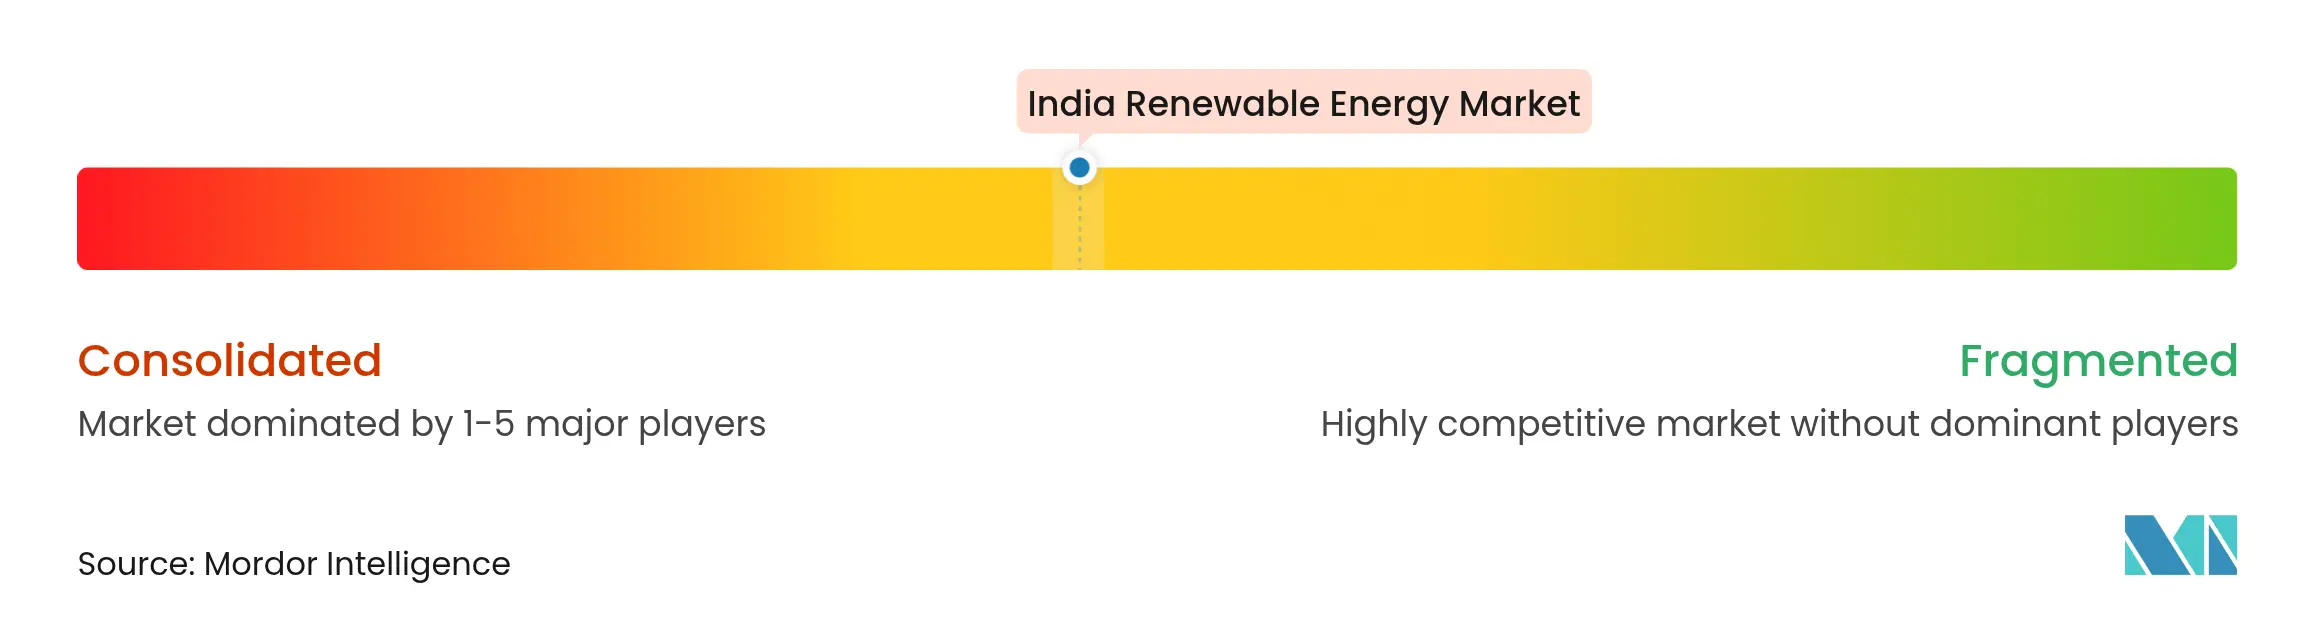
The India renewable energy market is moderately concentrated. Adani Green’s 30 GW Khavda complex positions it as the largest developer, while NTPC and ReNew maintain sizeable diversified portfolios. The ONGC-NTPC acquisition of Ayana Renewable Power for INR 19,500 crore brings state-owned balance-sheet strength into project consolidation. Private players differentiate through technology: Adani has deployed waterless robotic cleaning, and ReNew pilots bifacial panels to lift yields.[5]NTPC Limited, “Renewable Commissioning Updates 2024,” ntpc.co.in
Hybrid renewable-plus-storage is an emerging frontier, with Reliance securing India’s largest 930 MW solar + 465 MW/1,860 MWh contract in December 2024. Offshore wind and green hydrogen are next on the strategic agenda, and firms with established execution track records are likely to capture early-stage concessions.
Foreign capital remains active: Hexa Climate Solutions’ USD 500 million entry via Fortum India highlights sustained international appetite, while equipment majors such as Siemens Gamesa and Vestas vie for repowering orders. Margins continue to compress under competitive auctions, favoring vertically integrated or capital-rich developers capable of optimizing across the project life cycle.

*Disclaimer: Major Players sorted in no particular order
1. Introduction
2. Research Methodology
3. Executive Summary
4. Market Landscape
5. Market Size & Growth Forecasts
6. Competitive Landscape
7. Market Opportunities & Future Outlook
Renewable energy is derived from natural sources that replenish faster than they are consumed, such as sunlight, wind, water, geothermal heat, and biomass. These resources are considered inexhaustible and are used to generate electricity, heat, and fuel, typically resulting in a lower carbon footprint and reduced environmental impact compared to fossil fuels.
The India Renewable Energy Market is segmented by technology and end-user. By technology, the market is segmented by Solar Energy (PV and CSP), Wind Energy (Onshore and Offshore), Hydropower (Small, Large, PSH), Bioenergy, Geothermal, Ocean Energy (Tidal and Wave). By end user, the market is segmented into Utilities, Commercial and Industrial, and Residential. The report also covers the market size and forecasts for India.
For each segment, the market sizing and forecasts have been done based on the installed capacity (GW).
Unlocking Market Potential for Solid-State Transformers
3 Min Read
Strategic Expansion in the Russia Laundry Appliances Market
3 Min Read
A Leading Sanitaryware Company’s Journey in Saudi Arabia
4 Min Read
When decisions matter, industry leaders turn to our analysts. Let’s talk.