Renewable Diesel Market Size and Share
Market Overview
| Study Period | 2020 - 2030 |
|---|---|
| Market Size (2025) | USD 33.91 Billion |
| Market Size (2030) | USD 50.26 Billion |
| Growth Rate (2025 - 2030) | 8.19% CAGR |
| Fastest Growing Market | Europe |
| Largest Market | North America |
| Market Concentration | Medium |
Major Players *Disclaimer: Major Players sorted in no particular order Image © Mordor Intelligence. Reuse requires attribution under CC BY 4.0. | |

Renewable Diesel Market Analysis by Mordor Intelligence
The Renewable Diesel Market size is estimated at USD 33.91 billion in 2025, and is expected to reach USD 50.26 billion by 2030, at a CAGR of 8.19% during the forecast period (2025-2030).
The renewable diesel market is transitioning from an early-stage biofuel niche to a mainstream diesel substitute as long-haul trucking, marine transport and emergency power users favor its drop-in compatibility over first-generation biodiesel. Credit premiums under programs such as California’s Low Carbon Fuel Standard and the European RED III sustain producer margins, while low-CAPEX co-processing retrofits accelerate capacity additions. Growing demand from aviation-grade sustainable aviation fuel and from hyperscale data-center backup generators widens the application base, buffering the renewable diesel market against near-term electrification headwinds. Oil refiners leverage existing logistics to dominate throughput, yet algae-based feedstock innovators are challenging supply-chain conventions.
Key Report Takeaways
- By fuel type, pure renewable diesel (HVO100) led with a 54.5% revenue share in 2024; algae-derived products are forecast to expand at a 12.2% CAGR through 2030.
- By feedstock, vegetable oils commanded 37.8% of the renewable diesel market share in 2024, while algae feedstock is projected to grow at 12.8% CAGR between 2025-2030.
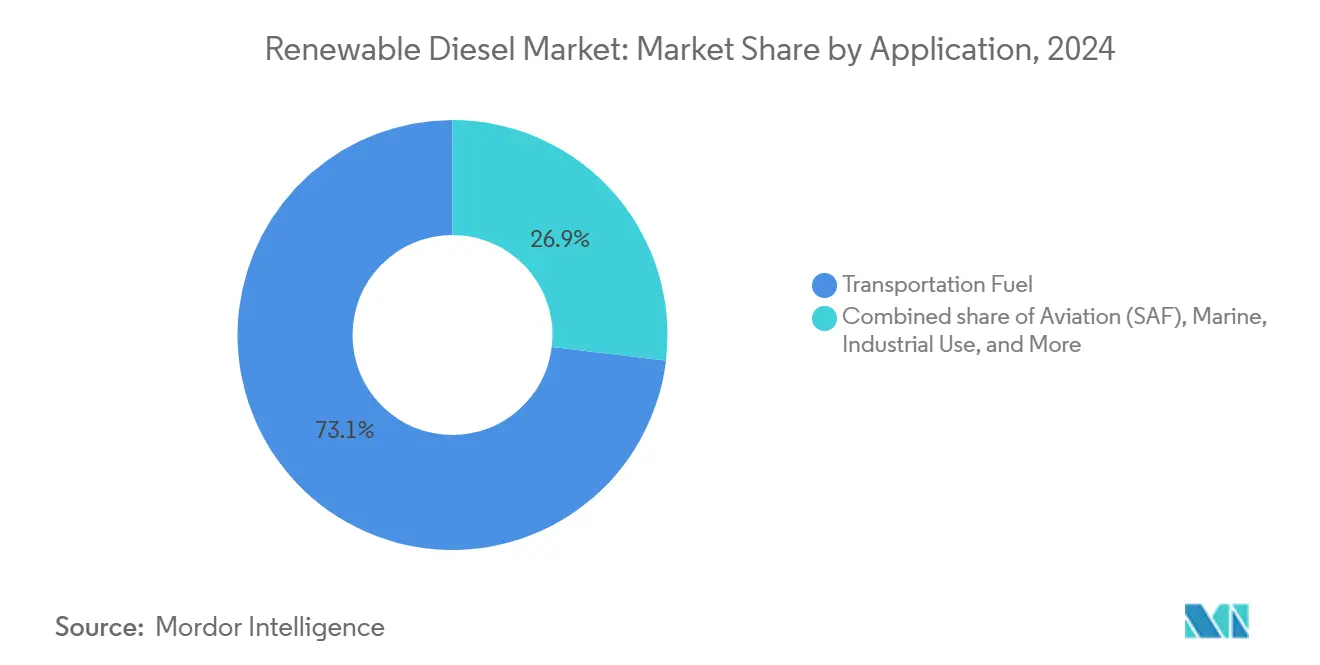
- By application, transportation fuel held 73.1% of the renewable diesel market size in 2024; aviation sustainable aviation fuel is advancing at a 13.1% CAGR to 2030.
- By end user, oil refineries and blenders controlled 53.6% of 2024 demand, whereas airlines are expected to see the highest 13.1% CAGR through 2030.
- By geography, North America accounted for 48.9% revenue in 2024; Europe is set to register the fastest 12.7% CAGR during 2025-2030.
Global Renewable Diesel Market Trends and Insights
Drivers Impact Analysis*
| Driver | ( ~ ) % Impact on CAGR Forecast | Geographic Relevance | Impact Timeline |
|---|---|---|---|
| Drop-in compatibility with diesel infrastructure | +1.80% | Global | Long term (≥ 4 years) |
| Policy incentives (LCFS, RED III, tax credits) | +2.10% | North America & EU | Medium term (2-4 years) |
| Heavy-duty fleet decarbonization push | +1.40% | Global | Medium term (2-4 years) |
| Data-center backup power decarbonization | +0.90% | APAC core, spillover to North America | Short term (≤ 2 years) |
| Low-CAPEX co-processing retrofits | +1.20% | Global | Medium term (2-4 years) |
| Source: Mordor Intelligence | |||
Drop-in Compatibility with Diesel Infrastructure
Renewable diesel mirrors the chemical profile of petroleum diesel, so it flows through pipelines, storage tanks, and engines without a 20% blending wall or material compatibility retrofits.(1)Source: Phillips 66, “Rodeo Renewable Energy Complex Factsheet,” phillips66.comFleet managers avoid capex for new tanks or seals and report seamless winter operability, a decisive benefit for cold-chain logistics in Canada, the Nordics, and the northern United States. Internationally-flagged vessels also exploit the fuel’s sulfur-free nature to meet IMO 2020 rules without adding scrubbers.(2)Source: Neste Corporation, “Renewable Diesel Technical Handbook,” neste.comOver the long term, this infrastructure parity fortifies the renewable diesel market against alternative fuels that need bespoke distribution systems.
Policy Incentives Drive Market Expansion
The 45Z Clean Fuels Production Credit delivers USD 1.00-1.75 per gallon, tipping plant economics depending on lifecycle carbon scores in favor of higher-cost waste and residue feedstocks.(3)Source: Clean Air Task Force, “U.S. 45Z Clean Fuel Production Credit Briefing,” catf.us In Europe, RED III locks in 29% renewable energy in transport by 2030, while individual member states layer SAF blending quotas that converge at 6-8% by 2030. Japan’s roadmap requiring new light vehicles to accept biofuels repositions Asia’s demand outlook. As a result, producers accelerate both greenfield projects and co-processing conversions, ensuring multi-year visibility for the renewable diesel market.
Heavy-Duty Fleet Decarbonization Accelerates Adoption
Battery-electric ranges remain under 400 miles for class-8 trucks, whereas renewable diesel offers a 60-75% well-to-wheel greenhouse-gas cut with no range compromise. Fleet case studies from Mack Trucks show maintenance intervals lengthening by 6-8% after the switch, partly offsetting a 3-10 cent-per-gallon premium. Construction, agriculture, and mining fleets mirror these results, reinforcing a global pivot toward drop-in molecules until zero-emission drivetrains mature.
Data-Center Backup Power Emerges as Growth Driver
Hyperscale operators now target Scope 1 neutrality for diesel gensets that protect mission-critical workloads. Microsoft, Equinix, and Digital Realty each run renewable diesel in megawatt-scale generators, citing negligible reliability penalty during monthly load tests. Singapore-based STT GDC extended the practice across its Asia-Pacific campuses in 2024, proving supply security in markets with limited biofuel history. Premium-priced volumes in this niche contribute outsized margins and diversify the renewable diesel market beyond transport fuels.
Restraints Impact Analysis*
| Restraint | ( ~ ) % Impact on CAGR Forecast | Geographic Relevance | Impact Timeline |
|---|---|---|---|
| Feedstock price volatility & supply | -1.60% | Global | Medium term (2-4 years) |
| Electrification & H₂ competition | -0.80% | Europe & APAC core | Long term (≥ 4 years) |
| LCFS cap on crop-based oils | -0.50% | North America | Short term (≤ 2 years) |
| Source: Mordor Intelligence | |||
Feedstock Price Volatility Constrains Margin Expansion
Soybean oil prices climbed 40-60% between 2022-2024, while imports of used cooking oil into the United States rose to 3 billion pounds in 2023, up from 0.9 billion pounds a year earlier. CoBank warns that the record wave of soybean-crush expansions could outpace incremental renewable diesel market demand, pressuring crush spreads. European and Asian buyers now arbitrage waste-oil cargoes, further tightening supply during policy-driven demand spikes. Producers dependent on single-feedstock strategies carry the greatest earnings risk.
Electrification and Hydrogen Competition Threaten Long-Term Demand
The IEA projects EV adoption to displace 12 million barrels per day of oil by 2035, curbing total diesel demand. Fuel-cell trucks from OEMs such as Hyundai and Toyota validated 900-mile routes in 2024 pilots, with Europe funding hydrogen corridors that challenge renewable diesel’s long-haul moat. Although the renewable diesel market secures short-to-medium-term lift from sectors lacking electrified alternatives, producers will eventually confront a shrinking diesel pool.
*Our forecasts treat driver/restraint impacts as directional, not additive. The impact forecasts reflect baseline growth, mix effects, and variable interactions.
Segment Analysis
By Type: Pure Renewable Diesel Holds Commanding Lead While Algae Drives the Next Wave
Pure HVO100 generated over half of 2024 revenue, underlining user preference for fuel that meets EN 15940 without any petroleum fraction. Bulk buyers cite consistent cetane ratings above 70 and cold filter plug points below –30 °C as decisive performance features. Volume gains in North America and Northern Europe signal widening user acceptance. However, blends and co-processed renewable diesel market volumes remain material in Southeast Asia, where biodiesel infrastructure is entrenched, permitting refiners to toggle between feedstocks. Algae-derived variants could unlock the next S-curve; pilot plants in the United States Southwest have reached 10,000 barrels per day pre-commercial scale, and DOE modeling shows parity pricing by 2028. Once costs converge, the renewable diesel market size for algae fuel could rival vegetable-oil throughput, diversifying supply and diluting indirect land-use change concerns.


By Feedstock: Vegetable Oil Dominance Faces Sustainability Headwinds
Vegetable oils kept a 37.8% share in 2024 thanks to mature crush infrastructure and hedgeable commodity markets. Yet LCFS multipliers increasingly penalize first-use crop oils, prompting refiners to favor animal fats and used cooking oil. Tallow, poultry fat, and yellow grease collectively reached a 37% slice of the renewable diesel market by feedstock in 2023, up from 17% three years earlier. Import exposure is rising: the United States sourced 28% of its waste-oil supply from Asia in 2024, creating logistics risks. Algae, tall oil, and forest-residue streams are positioned to supply long-run growth, especially in the Nordic cluster, where integrated pulp-and-fuel complexes unlock circular-economy credits.
By Application: Transport Retains Scale, Aviation Secures Premium Growth
Road transport absorbed 73.1% of barrels in 2024 because fleets could decarbonize instantly without new hardware. The renewable diesel market size for sustainable aviation fuel was smaller but recorded a 13.1% CAGR as of 2025, supported by European Union mandates and corporate net-zero targets. Airlines value hydrogen-free drop-in molecules that slot into existing JP-8 logistics. Marine, military, and industrial heating users add diversified pull—especially Arctic shipping lines that exploit HVO’s cold-flow edge over heavy fuel oil. Though niche in gallon terms, data-center backup power fetches double-digit price premiums and often secures multi-year offtake contracts, enhancing producer cash conversion.
By End User: Refiners Still Dominate, Airlines Accelerate
Integrated oil refiners and blenders controlled 53.6% of barrels in 2024, leveraging midstream logistics and hedging desks to manage feedstock volatility. Airlines' renewable diesel market share is on track to climb as SAF mandates kick in across the EU, the United Kingdom, and Japan, forcing carriers to pre-book supply through 2030. Government fleets and defense agencies add steady, price-inelastic demand that shields producers in downturns. Mining and agricultural firms round out the customer base, hedging energy security as EV-grade charging in remote regions lags grid upgrades.
Geography Analysis
North America’s 48.9% slice of 2024 revenue reflects established LCFS credits, agricultural feedstock availability, and rapid adoption by class-8 truck operators. Renewable diesel market capacity announced through 2026 exceeds 6 billion gallons annually, triggering oversupply debate and setting up export corridors to Europe and Asia. Feedstock arbitrage remains the region’s Achilles’ heel as Canada and the United States bid against each other for yellow grease cargoes.
Europe is the growth pacesetter at 12.7% CAGR through 2030, driven by RED III transport mandates and aggressive SAF blending quotas. Germany, the Netherlands, and Finland install integrated biorefineries that bolt onto chemical complexes, capturing process-gas co-products. Nordic producers exploit tall-oil from forestry residue, reducing feedstock intensity by 25% versus soy-oil routes. Import dependency nonetheless rises as waste-oil streams plateau, compelling EU policy makers to vet traceability frameworks.
Asia-Pacific offers the deepest untapped runway. Japan legislated Biofuel-Ready Vehicle targets and a 10% SAF blend by 2030, nudging refiners such as ENEOS and Idemitsu to retool hydrocrackers. China pilots SAF at Beijing Daxing and Shanghai Pudong, signaling future scale once certification hurdles are clear. India’s biofuel policy opens demand but faces feedstock scarcity, pushing stakeholders toward algae cultivation on non-arable land, highlighting opportunities in the renewable diesel market. Singapore anchors regional trading flows, exemplified by STT GDC’s campus-wide switch to renewable diesel backup power, a template likely to be replicated in Seoul, Sydney, and Jakarta.


Competitive Landscape
The renewable diesel market shows moderate consolidation. The top five refiners—Phillips 66, ENI, TotalEnergies, Neste, and Marathon—control over half of the installed capacity, helped by co-processing retrofits that exploit sunk hydrotreating assets. Scale affords feedstock purchasing leverage and carbon-credit portfolio optimization. Mid-tier biofuel specialists complement supply by focusing on low-carbon residues, often in joint ventures with renderers and agribusiness majors.
Strategic differentiation is shifting toward feedstock resilience. Repsol bought a 40% stake in three Bunge plants to nail down tallow and used-oil access, mirroring ENI’s long-term memorandum with Novamont for algae oils. Upstream integration helps derisk margin swings triggered by soybean-oil rallies. Technology depth also matters: companies that master isomerization paths for distillate-range molecules can seamlessly pivot output toward premium SAF barrels when jet-fuel cracks widen.
White-space growth centers on premium applications. Data-center operators sign five-year fuel supply deals that index to inflation rather than crude benchmarks, creating sticky margins. The International Maritime Organization’s mid-term carbon intensity targetspursg pilot bunkering at Rotterdam and Singapore. Producers who tailor cold-flow properties and lubricity for ship engines could capture this forthcoming pocket, expanding the renewable diesel market beyond road fuels.
Renewable Diesel Industry Leaders
Neste Oyj
Valero + Diamond Green Diesel JV
Marathon Petroleum Corporation
TotalEnergies SE
Eni S.p.A.
- *Disclaimer: Major Players sorted in no particular order


Recent Industry Developments
- June 2025: Vegas Renewable Diesel acquired a Nevada site for the largest Western US renewable diesel refinery, targeting 100 million gallons per month capacity primarily processing used motor oil.
- March 2025: Green Fuels Operating announced a USD 110 million investment to transform the Evangeline Processing Facility in Louisiana into a Net Zero Emissions Technology refinery with 20,000 barrels per day capacity.
- September 2024: Darling Ingredients announced Diamond Green Diesel will supply the first regular sustainable aviation fuel to Florida through an agreement delivering approximately 60 million gallons of blended SAF over two years.
- August 2024: Japan Airlines and ENEOS Corporation signed an agreement to promote sustainable aviation fuel sale and purchase in Japan, supporting domestic SAF supply chain establishment


Global Renewable Diesel Market Report Scope
| Pure Renewable Diesel (HVO100) |
| Renewable Diesel Blends |
| Co-processed Renewable Diesel |
| Others (e.g., Algae-derived) |
| Vegetable Oils (Palm, Soy, Canola, etc.) |
| Animal Fats |
| Used Cooking Oil |
| Algae |
| Tall Oil and Waste Residues |
| Others (e.g., MSW) |
| Transportation Fuel |
| Aviation (SAF) |
| Marine |
| Industrial Use |
| Power Generation |
| Others (Military, Agri-equipment) |
| Oil Refineries and Blenders |
| Commercial Fleet Operators |
| Airlines and Aviation Authorities |
| Government and Defense |
| Marine Transport Operators |
| Industrial and Utility Sector |
| Others |
| North America | United States |
| Canada | |
| Mexico | |
| Europe | Germany |
| United Kingdom | |
| France | |
| Italy | |
| NORDIC Countries | |
| Russia | |
| Rest of Europe | |
| Asia-Pacific | China |
| India | |
| Japan | |
| South Korea | |
| ASEAN Countries | |
| Rest of Asia-Pacific | |
| South America | Brazil |
| Argentina | |
| Rest of South America | |
| Middle East and Africa | Saudi Arabia |
| United Arab Emirates | |
| South Africa | |
| Egypt | |
| Rest of Middle East and Africa |
| By Type | Pure Renewable Diesel (HVO100) | |
| Renewable Diesel Blends | ||
| Co-processed Renewable Diesel | ||
| Others (e.g., Algae-derived) | ||
| By Feedstock | Vegetable Oils (Palm, Soy, Canola, etc.) | |
| Animal Fats | ||
| Used Cooking Oil | ||
| Algae | ||
| Tall Oil and Waste Residues | ||
| Others (e.g., MSW) | ||
| By Application | Transportation Fuel | |
| Aviation (SAF) | ||
| Marine | ||
| Industrial Use | ||
| Power Generation | ||
| Others (Military, Agri-equipment) | ||
| By End-user | Oil Refineries and Blenders | |
| Commercial Fleet Operators | ||
| Airlines and Aviation Authorities | ||
| Government and Defense | ||
| Marine Transport Operators | ||
| Industrial and Utility Sector | ||
| Others | ||
| By Geography | North America | United States |
| Canada | ||
| Mexico | ||
| Europe | Germany | |
| United Kingdom | ||
| France | ||
| Italy | ||
| NORDIC Countries | ||
| Russia | ||
| Rest of Europe | ||
| Asia-Pacific | China | |
| India | ||
| Japan | ||
| South Korea | ||
| ASEAN Countries | ||
| Rest of Asia-Pacific | ||
| South America | Brazil | |
| Argentina | ||
| Rest of South America | ||
| Middle East and Africa | Saudi Arabia | |
| United Arab Emirates | ||
| South Africa | ||
| Egypt | ||
| Rest of Middle East and Africa | ||


Key Questions Answered in the Report
What is the projected value of the renewable diesel market by 2030?
The renewable diesel market is forecast to reach USD 50.26 billion by 2030, reflecting an 8.19% CAGR from 2025.
Which region will grow fastest in renewable diesel market demand through 2030?
Europe posts the quickest 12.7% CAGR thanks to RED III transport quotas and early SAF mandates.
Why is renewable diesel favored over biodiesel for heavy-duty trucks?
It matches petroleum diesel chemically, so fleets avoid engine or storage modifications and still cut greenhouse-gas emissions by 60-75%.
How are data centers using renewable diesel?
Hyperscale operators such as Microsoft and STT GDC power backup generators with renewable diesel to meet corporate Scope 1 reduction goals.
Which feedstock segment is expected to grow fastest in the renewable diesel market?
Algae-based feedstock shows the highest 12.8% CAGR as technological advances lower cultivation costs.
What risk could slow long-term renewable diesel adoption?
Rapid electrification and hydrogen fuel-cell deployment may shrink diesel pools after 2027, tempering demand growth.
Page last updated on:


