
Market Overview
| Study Period | 2021 - 2031 |
|---|---|
| Market Size (2026) | USD 26.86 Billion |
| Market Size (2031) | USD 36.24 Billion |
| Growth Rate (2026 - 2031) | 6.18 % |
| Fastest Growing Market | Asia Pacific |
| Largest Market | Asia Pacific |
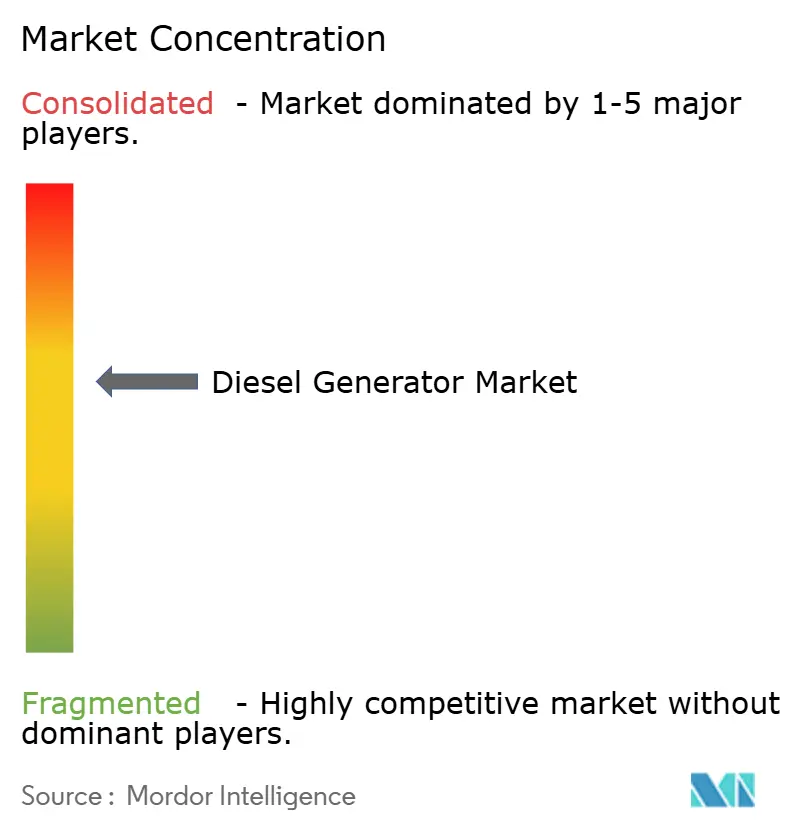
| Market Concentration | Medium |
Major Players *Disclaimer: Major Players sorted in no particular order Image © Mordor Intelligence. Reuse requires attribution under CC BY 4.0. | |
Diesel Generator Market Analysis by Mordor Intelligence
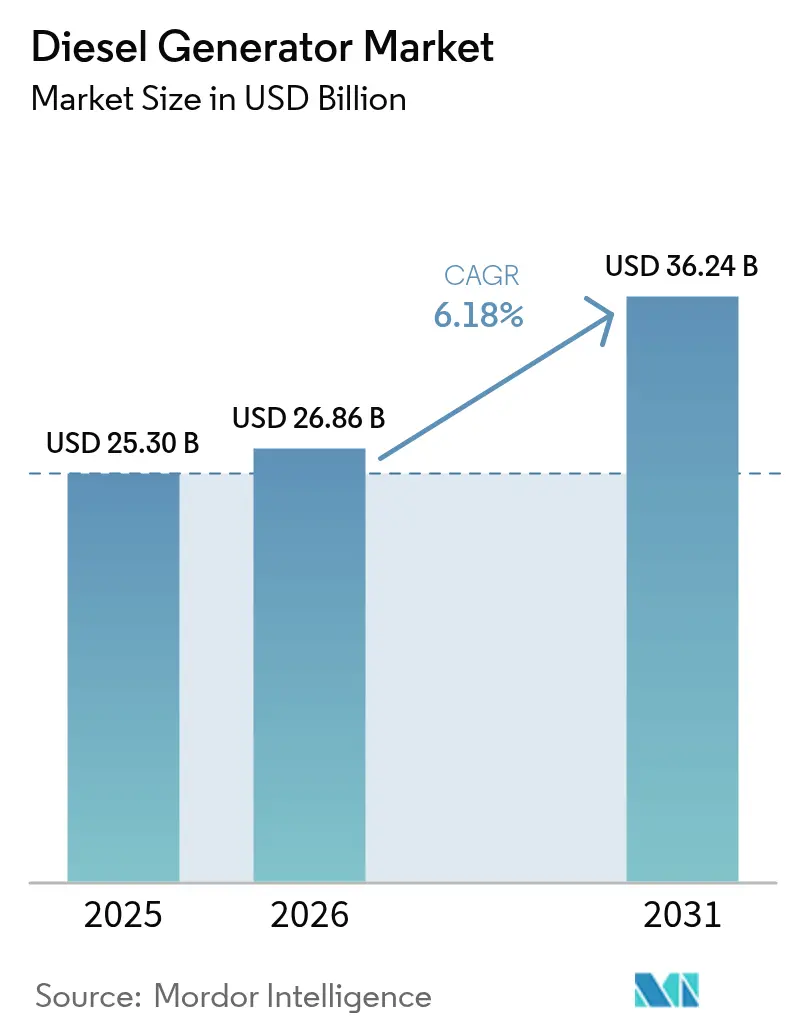
The Diesel Generator market size is expected to grow from USD 25.30 billion in 2025 to USD 26.86 billion in 2026 and is forecast to reach USD 36.24 billion by 2031 at 6.18% CAGR over 2026-2031.
The forecast underscores the market’s continued relevance even as grids add more renewables and regulators tighten emission limits. Demand pivots on three structural forces: the need for resilient power to protect digitalized operations, the rapid industrial build-out in regions where grids cannot keep pace, and the availability of advanced Tier 4 Final engines that sharply cut particulate matter and nitrogen oxides. At the same time, hybrid microgrids combine batteries and photovoltaics with diesel generation, enabling operators to limit fuel consumption without compromising availability. Mid-range 75–375 kVA sets now incorporate remote monitoring, aftertreatment, and parallel-ready switchgear once reserved for megawatt-class units, widening the addressable user base.
Key Report Takeaways
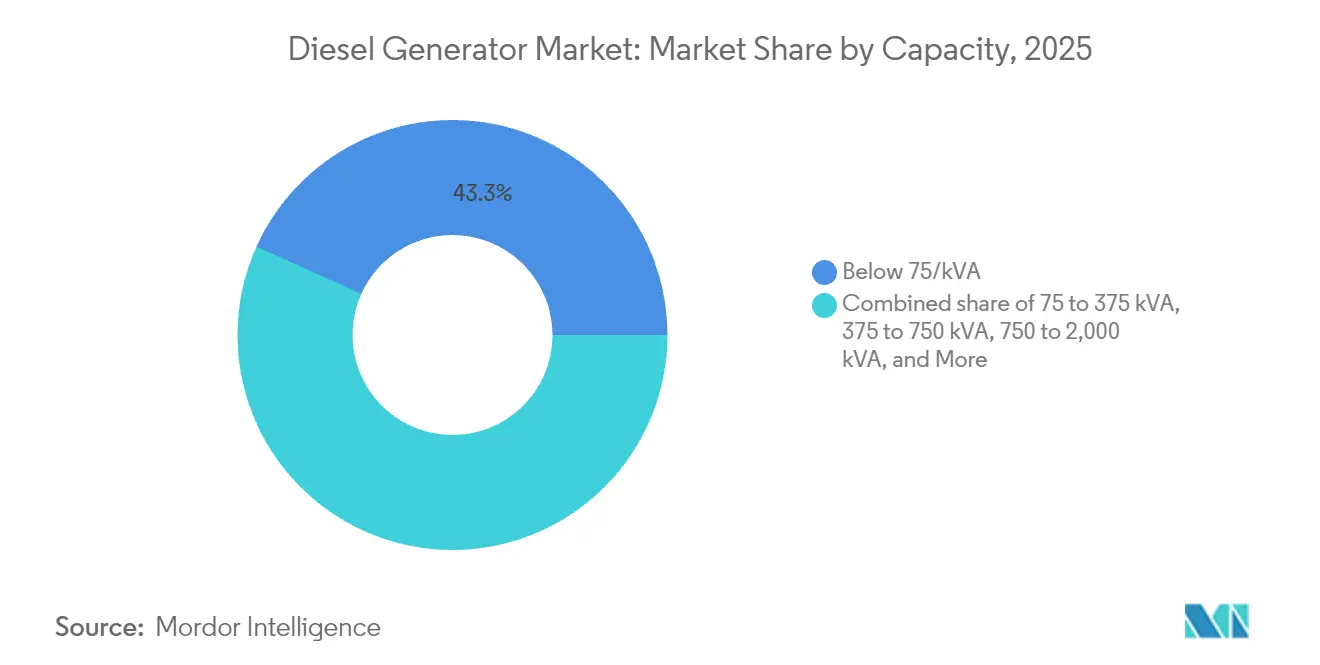
- By capacity, sets below 75 kVA accounted for 43.25% of the diesel generator market size in 2025; however, the 375-750 kVA range is projected to grow at a 7.55% CAGR through 2031.
- By application, standby and backup power controlled 66.70% of the diesel generator market size in 2025, while prime/continuous power is projected to register the fastest CAGR of 7.05% over the forecast period.
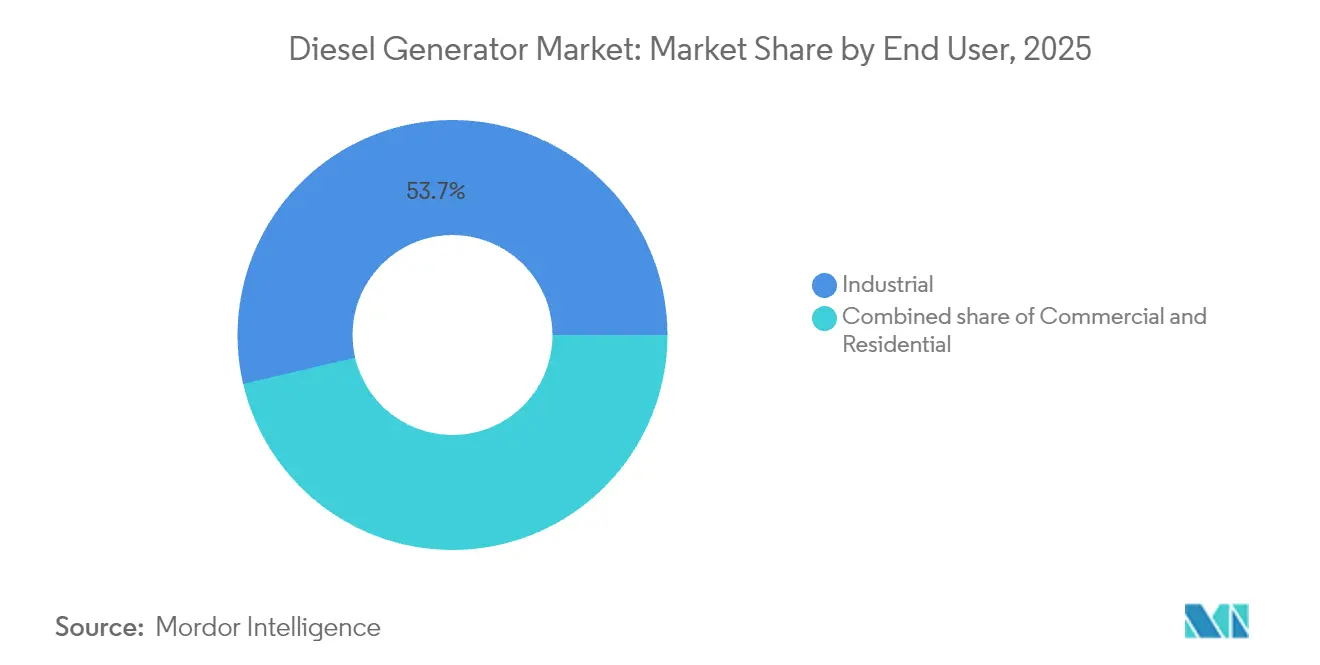
- By end-user, the industrial segment held a 53.65% market share of the diesel generator market in 2025 and is expected to expand at a 6.62% CAGR through 2031.
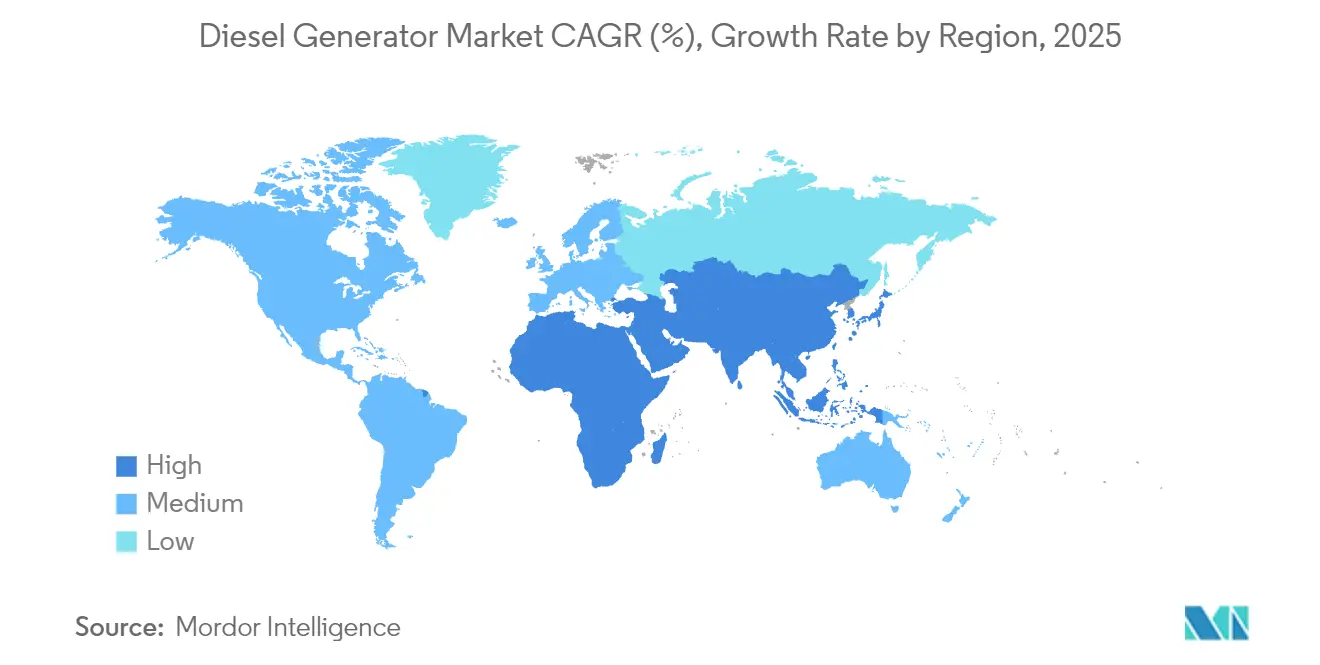
- By geography, the Asia-Pacific region led the diesel generator market with a 48.55% share in 2025 and posted the fastest growth rate of 7.12% through 2031.
Note: Market size and forecast figures in this report are generated using Mordor Intelligence’s proprietary estimation framework, updated with the latest available data and insights as of 2026.
Global Diesel Generator Market Trends and Insights
Drivers Impact Analysis*
| Driver | (~) % Impact on CAGR Forecast | Geographic Relevance | Impact Timeline |
|---|---|---|---|
| Rising demand for uninterrupted power in critical infrastructure | +1.2% | Global, concentrated in North America & APAC | Medium term (2-4 years) |
| Rapid industrialisation & infrastructure build-out in APAC & Africa | +1.8% | APAC core, spill-over to MEA | Long term (≥ 4 years) |
| Grid instability caused by extreme weather events | +0.9% | North America & EU, emerging in APAC | Short term (≤ 2 years) |
| Edge-data-centre roll-outs in Tier-2 cities | +0.7% | Global, led by North America & China | Medium term (2-4 years) |
| Surge in telecom tower deployments for 5G | +0.6% | Global, concentrated in APAC & North America | Medium term (2-4 years) |
| Diesel-hybrid micro-grid adoption in off-grid mining | +0.5% | MEA, APAC, South America mining regions | Long term (≥ 4 years) |
| Source: Mordor Intelligence | |||
Rising Demand for Uninterrupted Power in Critical Infrastructure
Hospitals, financial exchanges, and semiconductor fabs now categorise power loss as a business-continuity risk on par with cyberattacks. The Walsh Data Center in California installed 96 MW of diesel backup to protect cloud workloads, an investment illustrating how operators equate generator capacity with revenue protection.[1]California Energy Commission, “Santa Clara Data Center Environmental Impact Report,” energy.ca.gov Predictive analytics embedded in controller firmware schedule maintenance around live loads, lowering lifecycle costs and turning generators into active facility assets. As average downtime costs exceed USD 100,000 per hour for many digital businesses, procurement teams increasingly prioritize proven diesel reliability over capital expenditure savings. This trend supports premium pricing for Tier 4 Final sets that combine remote diagnostics with 99% lower particulate emissions, preserving the diesel generator industry’s value proposition even under stricter regulations.
Rapid Industrialisation and Infrastructure Build-out in APAC & Africa
Factory output in Southeast Asia and Africa rises faster than utilities can reinforce transmission. Industrial parks frequently integrate 10–20 MW of on-site generation that synchronises with weak grids or runs islanded during outages. Turnkey rental fleets supplied by Aggreko and Cummins keep green-field mines in Sub-Saharan Africa operational until permanent lines arrive, shortening project schedules by several years. Diesel generators are delivered, commissioned, and load-tested in months, compared with multi-year grid-extension timelines. This speed advantage fuels a virtuous cycle where industrial growth demands more generation capacity, enabling further expansion and keeping the diesel generator industry on a steady upward trajectory in emerging economies.
Grid Instability Caused by Extreme Weather Events
Hurricanes, wildfires, and polar vortexes have increased the frequency of unplanned outages, prompting North American facility owners to rethink resilience strategies. The International Energy Agency notes that dispatchable assets, such as diesel generators, remain vital in stabilizing grids with high variable-renewable penetration. Residential genset shipments in the United States are projected to advance at a 6% CAGR through 2026, as homeowners seek autonomy amid aging infrastructure. Industrial buyers specify longer-duration fuel tanks and improved sound attenuation to operate uninterrupted during prolonged events. Consequently, premium-grade diesel sets with advanced emission controls capture market share from legacy emergency-only models, reinforcing the fundamentals of the diesel generator industry.
Edge Data-Centre Roll-outs in Tier-2 Cities
Hyperscale operators place micro-facilities closer to users to cut latency, driving distributed demand for 1–10 MW backup blocks. Edged Energy’s Atlanta site uses EPA-certified Tier 4 Final diesel units supplied by PowerSecure to meet stringent emission limits while ensuring uptime. The global data-centre generator segment is forecast to reach USD 12.98 billion by 2030, largely driven by new edge deployments that require mid-range sets that balance footprint and reliability. These installations broaden the diesel generator industry market geographically and support regional service providers that can offer rapid response times.
Restraints Impact Analysis*
| Restraint | % Impact on CAGR Forecast | Geographic Relevance | Impact Timeline |
|---|---|---|---|
| Stricter emission norms favouring gas & hybrid sets | -0.8% | Global, led by EU & California | Medium term (2-4 years) |
| Growing penetration of battery-storage backed UPS | -0.6% | North America & EU, emerging in APAC | Long term (≥ 4 years) |
| Rare-earth supply bottlenecks for Tier-4 engines | -0.4% | Global, supply concentrated in China | Short term (≤ 2 years) |
| Higher urban insurance premiums for diesel exhaust risks | -0.3% | North America & EU urban centers | Medium term (2-4 years) |
| Source: Mordor Intelligence | |||
Stricter Emission Norms Favouring Gas & Hybrid Sets
California's Air Resources Board is pushing diesel particulate and NOx thresholds below Tier 4 Final, motivating some fleet owners to switch to natural-gas units or hybrid microgrids.[2]California Air Resources Board, “Proposed Amendments to Stationary Diesel Engine Regulations 2025,” arb.ca.gov The European Stage V rule set mandates the use of selective catalytic reduction and particulate filters on engines exceeding 19 kW, thereby increasing acquisition costs and complicating maintenance schedules. While these standards pose a headwind, engine manufacturers have responded with cooled-EGR combustion strategies, advanced fuel injection, and renewable diesel compatibility that meet compliance without eroding performance. Facilities with mission-critical loads continue to value diesel's energy density, thereby preserving the diesel generator industry's relevance in premium segments.
Growing Penetration of Battery-Storage-Backed UPS
Lithium-ion prices have fallen by more than 60% since 2016, enabling four-hour containerised batteries to substitute for diesel in short-duration applications. Mobile units now power film sets and urban construction sites that face noise or emission limits, a niche previously dominated by small gensets. Even so, diesel maintains cost advantages for multi-day outages and in temperatures where battery efficiency drops. Hybrid architectures that pair a battery for first-start response with diesel for extended runtime are becoming common, enlarging the total spend per site rather than cannibalising the diesel generator industry outright. Manufacturers integrating battery controls into genset switchgear stand to capture this blended demand.
*Our forecasts treat driver/restraint impacts as directional, not additive. The impact forecasts reflect baseline growth, mix effects, and variable interactions.
Segment Analysis
By Capacity: Mid-Range Units Emerge as Growth Catalysts
The below-75 kVA class retained the largest 43.25% slice of the diesel generator industry share in 2025, reflecting strong uptake in residential, small commercial, and telecom sites where modest loads warrant compact sets. Yet the 375-750 kVA band is advancing at a 7.55% CAGR to 2031, outpacing every other bracket as factories, data-processing hubs, and large retail footprints migrate to solutions that balance cost and resiliency. Mid-range models now ship with Tier 4-Final aftertreatment, hybrid-ready controls, and cloud telemetry once reserved for multi-megawatt units.
Caterpillar’s compact architecture reduces installation space by 31% while maintaining full EPA compliance, a design leap that lowers total installed costs and accelerates adoption in brownfield facilities. At the top end, 750-2,000 kVA and >2,000 kVA sets power mines and hyperscale data centers, which require extended runtime with utility-grade voltage regulation. The widening performance gap between entry-level and feature-rich models signals a maturing diesel generator industry, in which application demands, rather than price alone, dictate buying criteria and open premium positioning for OEMs.



By Application: Prime Power Gains Momentum Despite Standby Dominance
Standby and backup duties still commanded 66.70% of 2025 revenue, underscoring diesel’s core role in guarding against grid failure. Nonetheless, prime and continuous-duty deployments are growing at the fastest rate, with a 7.05% CAGR, as off-grid mines, oilfields, and remote industrial parks rely on diesel as their primary source of power. The shift shows operators embracing distributed energy to bypass costly or slow grid extensions.
In Sub-Saharan Africa, mining companies adopt containerized, prime-rated sets that can be delivered and commissioned in months, rather than years, for transmission hookups. Peak-shaving projects in grid-tied regions likewise tap prime-rated units to avoid time-of-use tariffs while retaining outage coverage, turning generators from static insurance into revenue-generating assets. This diversified duty profile broadens the diesel generator industry size and cushions it against cyclical dips in any single application niche.
By End User: Industrial Sector Drives Both Scale and Growth
Industrial facilities controlled 53.65% of the diesel generator industry share in 2025 and are projected to post the fastest 6.62% CAGR through 2031 as smart-factory and process-automation rollouts heighten tolerance for zero downtime. Lost production in heavy industry can exceed USD 100,000 per hour, pushing plant managers toward high-reliability gensets with harmonic-filtering and predictive-maintenance analytics.
Commercial users, data centers, hospitals, and financial hubs remain the second-largest slice, but their growth is steadier as many sites already possess N+1 redundancy. Residential demand benefits from more frequent extreme-weather outages and heightened awareness of personal resilience, especially in storm-prone North America. The convergence of operational technology and IT systems raises power-quality thresholds across sectors, sustaining an upward trajectory for the diesel generator industry even as alternative fuels and storage technologies advance.
Geography Analysis
The Asia-Pacific region holds a leading 48.55% share of the diesel generator industry in 2025 and is projected to expand at a 7.12% CAGR through 2031. Strong factory output, new transport links, and a sharp rise in cloud spending keep demand well ahead of local grid upgrades. China and India account for the majority of installations, as manufacturers rely on on-site sets to protect production from voltage fluctuations. Regional data-center capacity now totals 12,206 MW, with another 14,338 MW under construction, each megawatt of IT load matched by roughly one megawatt of standby power. Singapore’s moratorium on new server farms has redirected investment to Johor and Greater Jakarta, widening the geographic spread of generator sales. A rapid 5G rollout requires the addition of thousands of telecom towers, which necessitate small but reliable units. Meanwhile, remote mine sites in Australia and Southeast Asia specify larger hybrid diesel-solar packages to avoid costly grid extensions.
North America is the second-largest region by revenue and exhibits steady growth as utilities enhance their networks to mitigate weather-driven outages. Residential shipments rise 5.82% CAGR to 2027 because homeowners buy protection from longer blackouts caused by hurricanes, wildfires, and ice storms. California’s strict emission rules favor Tier 4 Final engines and renewable diesel blends, creating premium sub-segments that value compliance as much as price. The diesel generator industry also benefits from rising demand in Virginia, Texas, and Northern California. They host clusters of hyperscale data centers, and a single campus, such as the 96 MW Walsh facility, can order dozens of medium-speed generators to guarantee uptime for cloud services. In Europe, carbon-reduction goals are prompting buyers to opt for hybrid sets and Stage V-compliant aftertreatment systems that reduce particulate matter and NOx emissions.
The Middle East and Africa are experiencing high single-digit growth as governments invest in building airports, rail corridors, and mines that are far from reliable grids. Developers often pair diesel with solar arrays and batteries to trim fuel costs and simplify logistics in desert or high-altitude terrain. South America mirrors this pattern: copper and lithium miners in Chile, Peru, and Argentina deploy containerized, prime-rated units because grid connections often lag behind project timelines. The diesel generator industry in Brazil and Argentina also adds capacity for food processing and petrochemicals, widening the customer base beyond extractive industries. A stable outlook for global diesel supply, outlined in the International Energy Agency’s 2025 report, supports generator availability and pricing across emerging regions. Together, these factors create a diverse demand landscape where integrated solutions that combine diesel reliability with renewable inputs gain traction.

Regulatory Landscape
Emissions compliance remains the primary regulatory lever shaping diesel generator specifications across major markets. In the United States, EPA Tier 4 Final standards for nonroad compression-ignition engines (commonly applicable to mobile or semi-mobile generator applications in many configurations) anchor the aftertreatment baseline using combinations of SCR and DPF to reduce NOx and particulate matter. In California, the California Air Resources Board (CARB) layers tighter requirements and oversight, including 2025 Federal Register actions recognizing California updates to in-use off-road diesel fleet standards with phase-in periods running from 2024 through 2036.
In Europe, Regulation (EU) 2016/1628 (Stage V) continues to govern emission limits for non-road mobile machinery engines, pushing OEMs toward integrated aftertreatment and type-approval discipline for generator sets sold into mobile and semi-mobile duty cycles. A complementary EU framework, Regulation (EU) 2025/14 dated December 19, 2024, sets technical requirements and administrative procedures for EU type-approval and market surveillance for non-road mobile machinery circulating on public roads, increasing compliance complexity for rental fleets and transportable power packages versus permanently installed stationary units that are handled under local air-quality permitting and related eco-design or national provisions.
Competitive Landscape
The diesel generator industry is moderately concentrated. Caterpillar leads with 17.15% share of broader power-systems revenue, followed by Cummins at 9.02% and Generac at 1.14%, gaining ground in residential and commercial niches. OEMs differentiate themselves through their expertise in aftertreatment, controller software, and lifecycle service footprints. Tier 4 Final engines demand high-precision dosing of urea or DEF, creating barriers to entry for low-cost manufacturers. Customers value rapid parts availability and remote diagnostics that predict injector wear or filter saturation, anchoring loyalty to full-service brands.
Consolidation is a core strategy. Generac added MOTORTECH, Deep Sea Electronics, and Off Grid Energy in 2025, boosting expertise in gaseous-engine controls, generator controllers, and mobile storage. DEUTZ’s purchase of Blue Star Power Systems tilts the German engine maker toward complete genset packages with a 2030 revenue target of USD 500 million from its energy segment. These deals illustrate how incumbents bolt on specialised software or battery technology to deliver integrated microgrids that satisfy reliability and ESG mandates.
Innovation spans fuel flexibility and digital twins. Caterpillar sells engines certified for renewable diesel (HVO), enabling carbon-in-use reductions without hardware changes. Cummins has field-tested dual-fuel kits blending natural gas and diesel at ratios up to 70% gas, cutting diesel consumption for prime-power mines. Generac’s PowerINSIGHT portal connects thousands of field units, aggregating vibration, coolant, and load data to refine maintenance schedules. This service-driven differentiation helps protect margins, even as lower-horsepower segments of the diesel generator market become increasingly commoditized.
Diesel Generator Industry Leaders
Caterpillar Inc.
Generac Holdings Inc.
Kohler Co.
Cummins Inc.
Mitsubishi Heavy Industries Ltd (MTU)
- *Disclaimer: Major Players sorted in no particular order

Market Opportunities and Future Outlook
White-space opportunities are concentrating around compliant, modular, and service-wrapped solutions that preserve diesel reliability while meeting tightening local air-quality rules. One clear pocket is mission-critical and industrial sites that need larger, higher-spec packages with modern controllers and emissions-ready architectures. Generac’s March 2026 launch of the SD1250 and SD1500 diesel generators, built around Perkins 5012 46-liter engines, points to continued OEM investment in high-capacity, standardized platforms aimed at data centers and other uptime-sensitive facilities.
A second opportunity sits in off-grid and weak-grid industrial development where customers procure power as a service rather than only equipment, especially in remote regions with long grid-connection lead times. Brazil Potash Corp’s May 2026 28-year BOOT arrangement with Gera Center Ltda for a 20 MW modular diesel power plant in the Amazon region illustrates how long-duration contracts can pull through containerized, maintainable generation blocks and associated fuel, controls, and O&M ecosystems. Technical pathways that keep diesel in regulated markets are also widening through advanced aftertreatment and combustion strategies, including 2026 technical publications focused on meeting India CPCB emission norms with DOC, DPF, and SCR, and on hydrogen-assist combustion concepts for gensets, which together expand the design space for compliant prime and backup duty cycles.
Recent Industry Developments
- June 2026: Cummins Power Generation expanded its high-horsepower generator offering around the QSK78 engine platform, positioning up to 3,500 kVA capability for 50 Hz markets. The release supports higher-density backup blocks for data centers and other mission-critical sites, while also reinforcing OEM differentiation around packaged controls, serviceability, and standardized platforms.
- May 2025: Generac acquired Off Grid Energy, a UK-based designer and manufacturer of mobile energy storage systems. The deal strengthens Generac’s ability to pair diesel generation with batteries in hybrid and mobile applications where customers are managing both runtime requirements and local noise or emissions constraints.
- December 2024: Hatz Americas expanded its power generation portfolio to include AC and DC mobile diesel generators for recreational vehicle and industrial uses after acquiring rights to RV generators previously produced by Dometic Italy SPA. The acquisition broadened Hatz’s product footprint in compact and mobile formats, aligning with demand for flexible, transportable power solutions.


Research Methodology Framework and Report Scope
Market Definition and Coverage
For this report, the market is defined as revenue earned from diesel-powered generator sets sold for standby, prime, or peak-shaving electricity supply across residential, commercial, and industrial users, including packaged gensets and their standard alternator and control systems.
Scope exclusions: This sizing does not count fuel consumption, generator rental service revenue, or non-diesel generator technologies.
Segmentation Overview
- By Capacity (kVA)
- Below 75 kVA
- 75 to 375 kVA
- 375 to 750 kVA
- 750 to 2000 kVA
- Above 2000 kVA
- By Application
- Stand-by/Backup Power
- Prime/Continuous Power
- Peak-shaving/Load Management
- By End User
- Residential
- Commercial
- Industrial
- Geographic Analysis
- North America
- United States
- Canada
- Mexico
- Europe
- Germany
- United Kingdom
- France
- Italy
- NORDIC Countries
- Russia
- Rest of Europe
- Asia-Pacific
- China
- India
- Japan
- South Korea
- ASEAN Countries
- Rest of Asia-Pacific
- South America
- Brazil
- Argentina
- Rest of South America
- Middle East and Africa
- Saudi Arabia
- United Arab Emirates
- South Africa
- Egypt
- Rest of Middle East and Africa
- North America
Data Sources, Market Sizing, and Validation
Desk Research
We started by mapping the demand drivers that usually move diesel generator set sales, and then we checked which public data series best reflect those drivers. Common inputs came from sources such as the International Energy Agency for power access and reliability indicators, the World Bank for macro and electrification context, and the U.S. Energy Information Administration for fuel and power-sector signals.
To ground the equipment side, we reviewed sources such as UN Comtrade for trade flows on generator-related categories and USITC DataWeb for import trends into the United States, alongside regulatory and permitting portals that can indicate project pipelines in large end-user sectors. Company annual reports, investor presentations, and reputable press were used to validate pricing direction and capacity mix. We also used selective paid subscriptions for company financials and patent coverage to cross-check supplier activity and product refresh cycles. These examples are not exhaustive, and we also reviewed other public and paid sources for data collection, cross-checking, and clarification.
Primary Interviews and Surveys
Next, we spoke with a mix of genset OEM teams, packagers, distributors, EPC participants, and large end users that regularly buy backup power. This helped us align assumptions to what is being purchased and installed today. Because the market is global, we validated inputs across major consuming regions, and the discussions were used to close gaps on average selling prices, typical duty cycles (standby versus prime), and the share of demand tied to new projects versus replacements.
Distribution of primary research fieldwork respondents
| Company type | Respondent position | Region |
|---|---|---|
| Top tier: 37% | CXOs: 12% | APAC: 46% |
| Mid tier: 48% | Functional/Unit leaders: 35% | EMEA: 34% |
| Smaller Players: 15% | Managers: 53% | Americas: 20% |
Market-Sizing & Forecasting
Sizing was built using a top-down demand pool view, where electrification gaps, grid outage patterns, and construction and industrial activity are translated into likely genset installations and replacement needs, and then converted to value using observed pricing ranges by kVA band. To keep the model practical, we used a limited set of repeatable inputs, including diesel price direction, data center and telecom site additions, mining and oil and gas project activity, and the split between standby and prime usage that affects unit selection.
We then stress-tested results using selective bottom-up approximations, including sampled ASP times estimated unit volumes for key kVA ranges, distributor channel checks on order run-rates, and supplier-side revenue sanity checks where disclosures were available. When a country-level input was weak, we handled the gap by using proxy indicators, such as trade inflows and construction output, and then adjusted with interview feedback so the assumptions stayed realistic.
For forecasting, we relied on scenario analysis supported by a light multivariate regression layer on a few stable drivers, such as industrial output, commercial floor space additions, and outage exposure proxies. We finalized assumptions only after aligning them to what experts expect for regulations, emissions-related product shifts, and typical replacement cycles over the study period.
Data Validation & Update Cycle
Outputs were validated through multiple passes that compare total market value against independent signals, including implied unit demand from project activity, trade movement direction, and price progression consistency across kVA bands. If a country or segment showed a sudden spike or drop, we revisited the drivers, rechecked source data, and re-contacted industry participants when needed before the numbers were signed off.
Each report is refreshed annually, and interim updates are made when material events occur, such as major outages, policy changes affecting diesel use, or sharp fuel price moves that change buying behavior. Before delivery, a final review pass is completed so the latest public releases and on-the-ground feedback are reflected in the published view.
Mordor Intelligence's Diesel Generator Market Estimate Compared With Other Published Estimates
Published market values for diesel generators can differ even when the topic sounds the same, because counting rules are not always aligned. The table below helps show how differences in base year, what gets included in a genset price, and how capacity splits are treated can move the final number.
What usually creates the biggest spread is scope and conversion logic. In some estimates, portable equipment and stationary packages are blended without consistently separating kVA bands. Other estimates apply aggressive price growth or replacement rates without checking them against trade and order signals. The table shows a tighter 2025 value than one external figure, and under Mordor Intelligence's scope the number is built around genset revenue tied to standby, prime, and peak-shaving applications, without adding fuel or rental service revenue that can inflate totals.
Benchmark comparison
| Source | Market Size | Gaps in Research Methodology |
|---|---|---|
| Mordor Intelligence | USD 25.30 B (2025) | |
| Global Consultancy A | USD 28.01 B (2024) | Uses a different base year and presents a higher growth profile, and the scope description suggests portable and stationary mixes that can shift the average pricing and unit assumptions. |
| Trade Journal B | USD 19.90 B (2024) | Anchors to a lower 2024 starting point, and its public summary does not clearly state how standby versus prime demand and kVA mix are converted into value across regions. |
Looking across the three figures, most of the variance is explained by the year chosen for the starting point and by whether adjacent revenue pools get blended into the same total. By keeping inputs tied to observable demand triggers, and then cross-checking with supplier and channel signals, the model stays traceable and can be repeated when conditions change.


Key Questions Answered in the Report
What is driving today’s demand for diesel generators?
Businesses of every size want rock-solid backup power as outages become more frequent; this need is pushing global revenue from USD 25.30 billion in 2025 to USD 36.24 billion by 2031, a 6.18% CAGR.
Which region is buying the most units?
Asia-Pacific sits on top with 48.55% of global sales in 2025 and is still growing at 7.12% a year, helped by new factories, data centers and 5G roll-outs.
How are tougher emission rules changing what buyers choose?
Stricter limits in places like California and the EU are nudging customers toward Tier 4 Final engines, renewable diesel blends and hybrid sets, trimming the headline growth rate by about 0.8% but opening premium niches for compliant models.
Which generator sizes are gaining the fastest?
Mid-range machines rated 375-750 kVA are the stand-outs, logging a projected 7.55% CAGR through 2031 as users look for a sweet spot between footprint, price and power.
Are batteries replacing diesel units?
Lithium-ion systems now cover short outages, especially in North America and Europe, but diesel still wins on multi-day runtime and harsh-weather resilience; the battery shift clips growth by roughly 0.6% rather than eliminating demand.
Beyond emergency backup, where else are generators finding work?
Prime-power roles in off-grid mines, remote industrial parks and peak-shaving projects are climbing at a 7.05% CAGR, showing that diesel sets are becoming everyday power sources as well as safety nets.
Page last updated on:


 Your data is secure and never sold or shared.


