Market Overview
| Study Period | 2021 - 2031 |
|---|---|
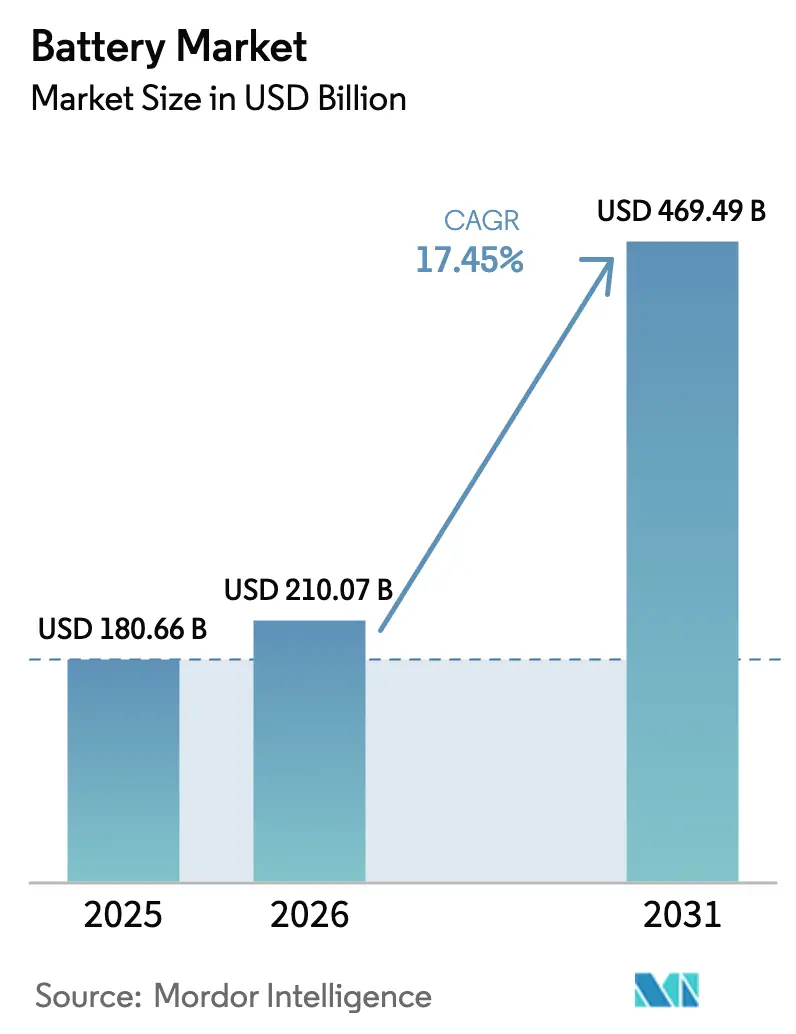
| Market Size (2026) | USD 210.07 Billion |
| Market Size (2031) | USD 469.49 Billion |
| Growth Rate (2026 - 2031) | 17.45% CAGR |
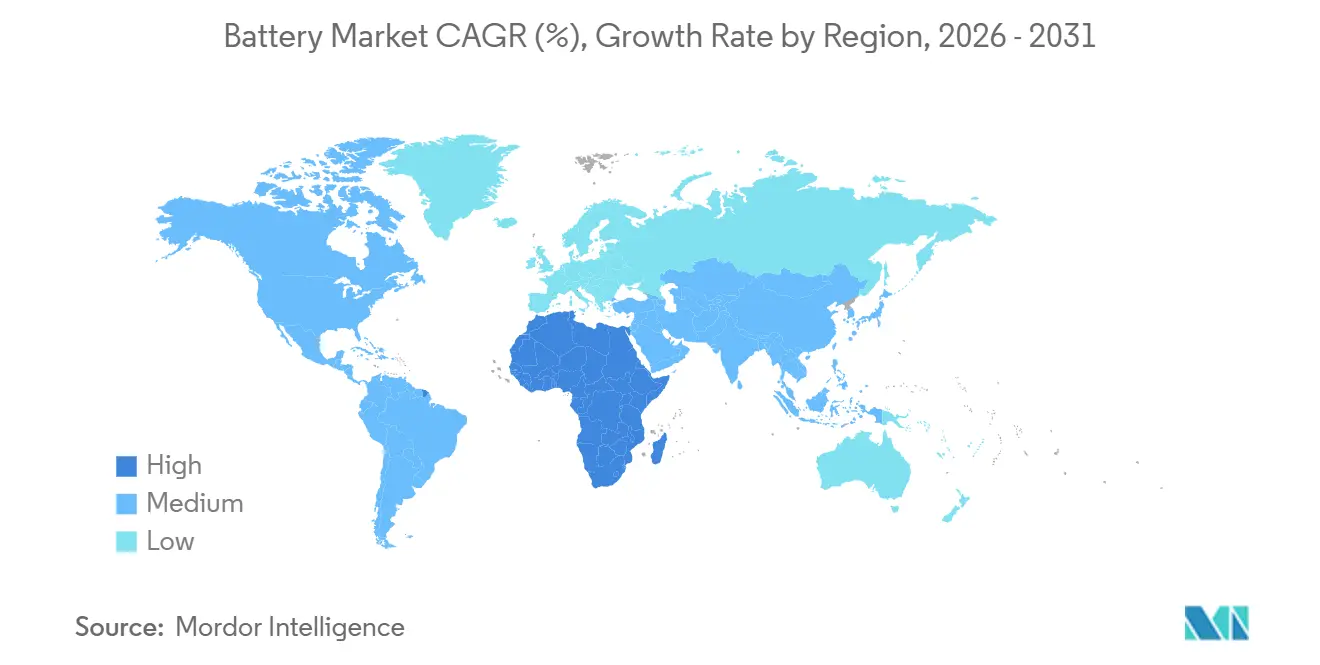
| Fastest Growing Market | Asia-Pacific |
| Largest Market | Asia-Pacific |
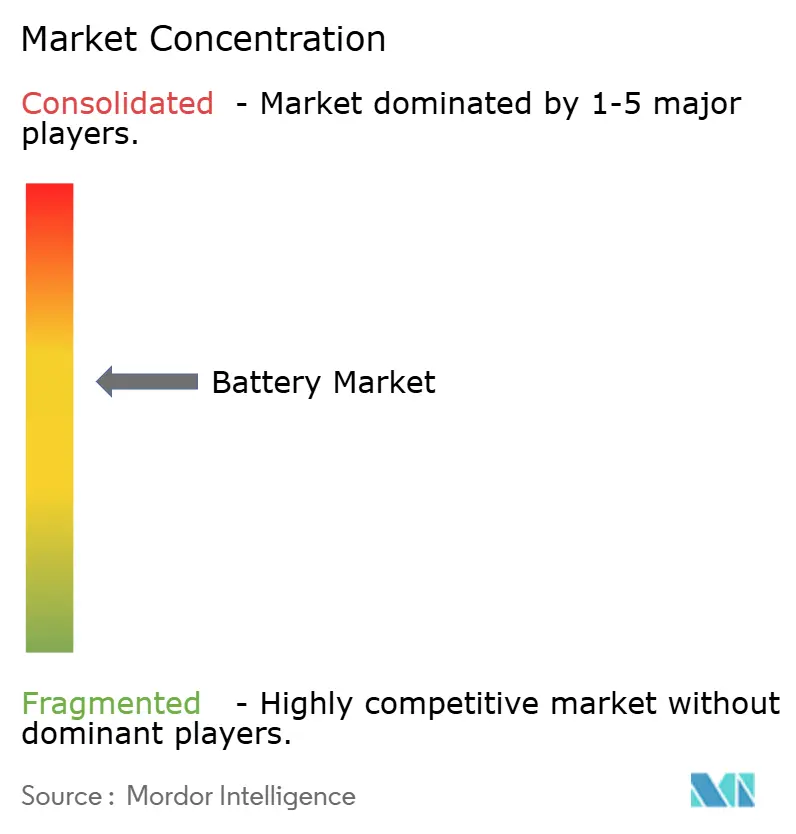
| Market Concentration | Medium |
Major Players *Disclaimer: Major Players sorted in no particular order Image © Mordor Intelligence. Reuse requires attribution under CC BY 4.0. | |
Battery Market Analysis by Mordor Intelligence
The Battery Market size is projected to expand from USD 180.66 billion in 2025 and USD 210.07 billion in 2026 to USD 469.49 billion by 2031, registering a CAGR of 17.45% between 2026 to 2031.
Declining lithium-ion pack prices, escalating grid-scale storage procurements, and vehicle electrification mandates are accelerating demand as batteries shift from passive storage to active grid assets. Secondary rechargeable systems supplied 90.6% of global demand in 2025, propelled by automotive and utility-scale applications that absorbed over 60% of worldwide lithium-ion cell output.[1]U.S. Energy Information Administration, “Battery Storage Update,” eia.gov Lithium-ion retained 57.2% technology share, yet solid-state chemistries promise 26.9% CAGR as pilot lines scale between 2026 and 2028. Asia-Pacific contributed 47.0% of revenue in 2025, supported by China’s 1,800 GWh of installed capacity and India’s incentives for 500 GWh by 2030.[2]U.S. Energy Information Administration, “Battery Storage Update,” eia.gov Competitive intensity is rising as Chinese producers leverage vertical integration to push lithium iron phosphate prices below USD 53 kWh, spurring Western and Japanese rivals to seek joint ventures and solid-state differentiation.[3]Press Information Bureau, Government of India, “PLI Scheme,” pib.gov.in
Key Report Takeaways
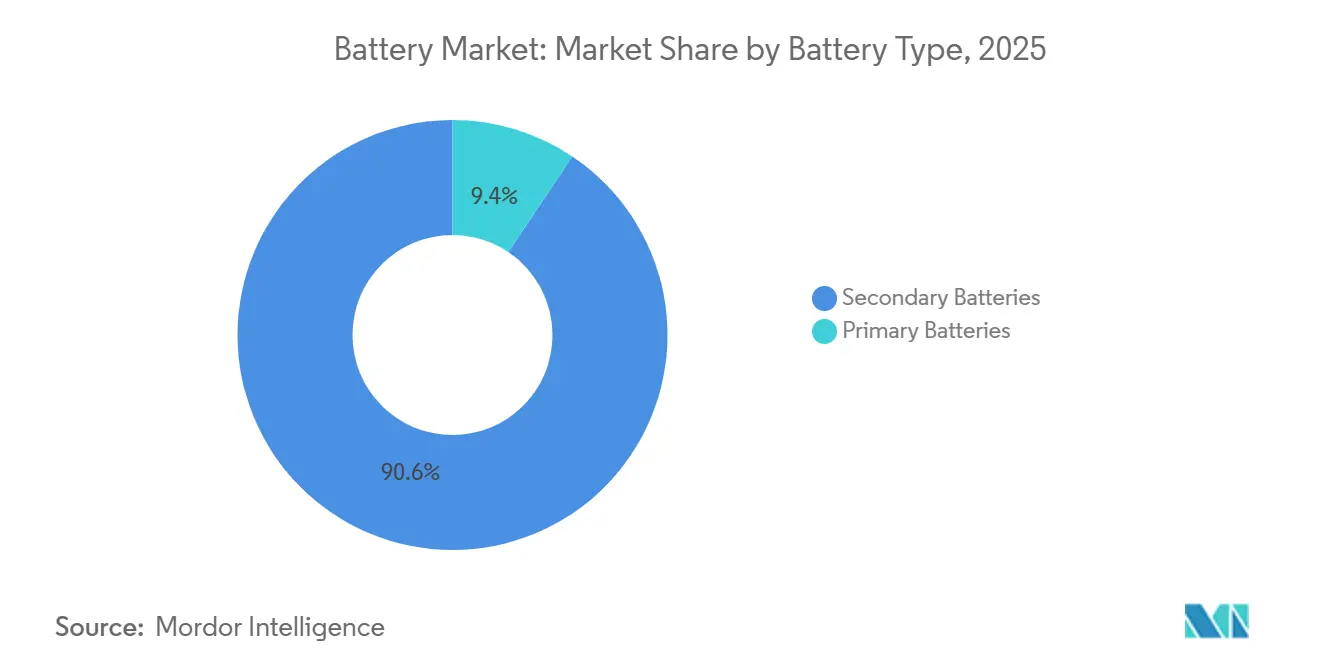
- By battery type, secondary rechargeable batteries held 90.6% revenue share in 2025 and are expanding at an 18.5% CAGR to 2031.
- By technology, lithium-ion commanded 57.2% of 2025 revenue, while the solid-state segment recorded the fastest 26.9% CAGR through 2031.
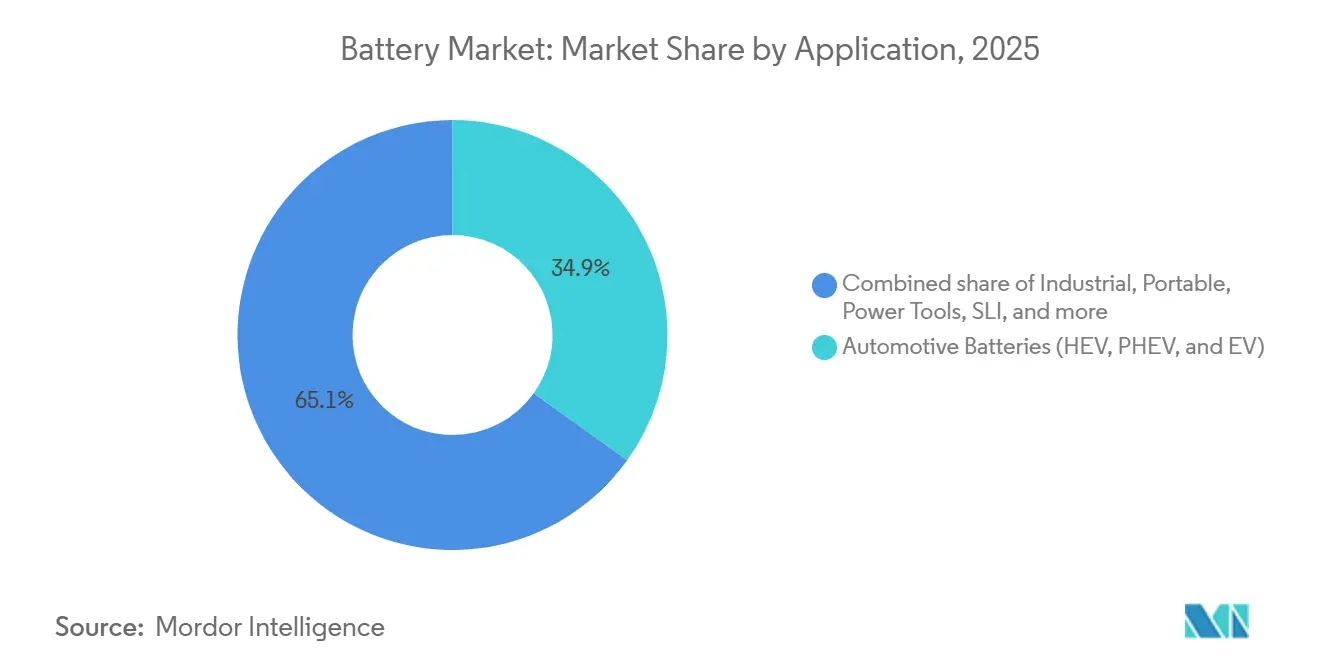
- By application, automotive led with a 34.9% share in 2025, and is projected to deliver the highest 22.8% CAGR to 2031.
- By geography, Asia-Pacific contributed 47.0% of 2025 revenue and is forecast to maintain a 20.3% CAGR, the quickest among regions.
Note: Market size and forecast figures in this report are generated using Mordor Intelligence’s proprietary estimation framework, updated with the latest available data and insights as of January 2026.
Global Battery Market Trends and Insights
Drivers Impact Analysis*
| Driver | (~) % Impact on CAGR Forecast | Geographic Relevance | Impact Timeline |
|---|---|---|---|
| Declining Lithium-Ion Pack Prices | +3.2% | Global, strongest in China and Asia-Pacific | Short term (≤ 2 years) |
| Surge in Grid-Scale Storage Procurements | +4.1% | North America, Europe, India, Australia | Medium term (2-4 years) |
| Vehicle Electrification Mandates | +5.8% | Europe, China, California and select U.S. states | Medium term (2-4 years) |
| Energy-Access Mini-Grid Programs | +0.9% | Sub-Saharan Africa, South Asia, Southeast Asia | Long term (≥ 4 years) |
| Corporate Renewable-Plus-Storage PPAs | +1.7% | North America, Europe | Medium term (2-4 years) |
| Nascent Solid-State Breakthroughs | +1.8% | Global, early adoption in premium automotive segments | Long term (≥ 4 years) |
| Source: Mordor Intelligence | |||
Declining Lithium-Ion Pack Prices
Lithium-ion pack prices fell to USD 108 kWh in December 2025, a 22% drop from 2023, enabled by cathode-material deflation, manufacturing scale gains, and broader lithium iron phosphate adoption.[4]Reuters, “Chinese Battery Pricing,” reuters.com Chinese producers leveraged vertical integration to achieve spot prices of USD 53 kWh in Q2 2024, undercutting Western peers that lack similar scale or subsidies. Automakers responded by shifting mainstream models to lithium iron phosphate: Tesla sourced the chemistry for over half of Model 3 and Model Y builds in 2025, and Ford targets late-2026 adoption for the Mustang Mach-E. Fast cost declines shortened payback periods for battery-electric platforms to less than five years in markets with fuel prices above USD 1.50 L, accelerating commitments to phase out internal-combustion variants.[5]BloombergNEF, “Battery Pack Prices 2025,” about.bnef.com Pack prices are on track to breach USD 80 kWh by 2028, aligning the total cost of ownership with gasoline vehicles in unsubsidized segments and opening demand for compact sedans and light commercial vans.
Surge in Grid-Scale Storage Procurements
Utility-scale battery installations are forecast to hit 18.2 GW in 2025, up from 10.3 GW in 2024, as operators replace aging gas peakers and integrate solar fleets exceeding 300 GW worldwide. India’s tenders reached 6.1 GWh in Q1 2025 under rules requiring storage to guarantee a round-the-clock renewable supply. Lithium-ion dominates two- to four-hour use cases, while flow systems and compressed-air alternatives pursue six- to twelve-hour niches where energy-to-power ratios favor decoupled scaling. ESS Inc. deployed 500 MWh of iron-flow units by year-end 2024 to industrial customers and island grids that prioritize supply-chain security over round-trip efficiency. In August 2025, batteries shaved 6.6 GW of net peak load in California, matching six combined-cycle plants and averting blackouts during a heatwave.
Vehicle Electrification Mandates
Euro 7 standards, effective 2025, require battery-electric passenger vehicles to retain 80% capacity after eight years or 160,000 km, prompting automakers to over-provision cells or adopt long-life chemistries. China’s dual-credit policy lifted plug-in sales to 37% of 2025 deliveries and targets 80% electrification by 2030. California’s Advanced Clean Cars II rule demands 68% zero-emission sales by 2030, driving 150 GWh of annual U.S. cell demand. The IEA projects 250 million electric vehicles on roads by 2030, implying 1,500 GWh of new cell capacity or 30 plants at 50 GWh each. OEMs reacted with multi-billion-dollar joint ventures: LG Energy Solution and Honda committed USD 4.4 billion to an Ohio facility, while Samsung SDI and General Motors plan USD 3.5 billion in Indiana, both slated for 2026-2027 start-ups.
Energy-Access Mini-Grid Programs (Global South)
Government-led mini-grid schemes are unlocking demand across Sub-Saharan Africa, South Asia, and Southeast Asia. Projects pair solar with lithium-ion or lead-carbon batteries to deliver reliable power in remote communities. The programs support off-grid healthcare, education, and small enterprises, reducing diesel reliance and lowering operating costs. Multilateral financing and concessional loans cover early-stage risk, while pay-as-you-go tariffs ensure long-run viability. As financing models standardize, cumulative installations could surpass 5 GWh by 2030, lifting local manufacturing and assembly opportunities in Kenya, India, and Indonesia.
Restraints Impact Analysis*
| Restraint | (~) % Impact on CAGR Forecast | Geographic Relevance | Impact Timeline |
|---|---|---|---|
| Critical-Metal Supply Bottlenecks | -2.4% | Global, pronounced in Europe and North America | Medium term (2-4 years) |
| ESG-Driven Raw-Material Audits | -0.8% | Europe, North America | Short term (≤ 2 years) |
| Cell Manufacturing Overcapacity Risk (China) | -1.9% | China with spillover to export markets | Short term (≤ 2 years) |
| Recycling-Cost Uncertainty for Next-Gen Chemistries | -0.6% | Global, early impact under EU Regulation | Long term (≥ 4 years) |
| Source: Mordor Intelligence | |||
Critical-Metal Supply Bottlenecks
Lithium demand is set to quintuple by 2040, yet new mines face seven- to ten-year lead times and permitting hurdles that kept supply expansion to 15% annually, half of what electrification requires. China refines 60% of the world’s lithium and 80% of cathode materials, concentrating risk for Western countries. Cobalt is even more constrained as the Democratic Republic of Congo supplies 70% of mined volumes, and Global Witness logged 111 violent incidents a year at extraction sites, prompting ESG audits that halted mines representing 8% of capacity. Nickel sulfate deficits persist because Indonesian laterite projects prioritize stainless-steel output, widening the Class 1 versus Class 2 price spread to USD 4,000 t in 2025, the decade’s peak. Automakers mitigate by pivoting to lithium iron phosphate and sodium-ion cells that remove nickel and cobalt, evidenced by CATL’s commercial sodium-ion production for Chery and JAC in 2024.
ESG-Driven Raw-Material Audits
European and North American regulators require traceability of critical minerals from mine to module. Third-party audits uncovered labor and environmental breaches at multiple cobalt and nickel sites, suspending imports until remediation plans are approved. Compliance raises transaction costs and lengthens procurement cycles, affecting short-term supply security. Suppliers with robust governance credentials command premiums, while downstream manufacturers invest in blockchain and on-site monitoring to certify origin.
*Our forecasts treat driver/restraint impacts as directional, not additive. The impact forecasts reflect baseline growth, mix effects, and variable interactions.
Segment Analysis
By Battery Type: Rechargeables Dominate Across Use Cases
Secondary rechargeables accounted for a commanding 90.6% of 2025 revenue, illustrating how high-cycle life and falling cost per kilowatt-hour outweigh higher upfront investment. Rechargeables are forecast to grow at 18.5% CAGR through 2031, sustaining the battery market size momentum as electric vehicles and stationary storage absorb most new capacity. Primary systems retained a 9.4% share, continuing to serve sensors, medical implants, and emergency equipment, where multi-year endurance offsets disposal concerns. This slice will expand at 8.2% CAGR, reflecting the proliferation of maintenance-free Internet of Things nodes.
Lead-acid persists in starting-lighting-ignition, telecom backup, and motive power where cost per cycle and recyclability trump weight penalties. Nickel-metal hydride now holds just 4% after the shift to plug-in architectures, although Toyota still specifies it for markets facing lithium supply constraints or sub-zero climates. Sodium-ion and zinc-air, introduced commercially in 2024, target entry-level electric vehicles and long-duration storage, signaling a diversification that maintains robust battery market growth.


By Technology: Lithium-Ion Leads, Solid-State Disrupts
Lithium-ion captured 57.2% of the value in 2025, anchoring the battery market share landscape across automotive and grid applications. Lead-acid followed at 31.4%, with entrenched positions in legacy vehicles and industrial forklifts. Solid-state contributed less than 0.5% but is projected to scale at 26.9% CAGR, creating a premium tier that could reshape the overall battery market size by 2031 as economics improve.
Within lithium-ion, lithium iron phosphate jumped from 35% of cell output in 2023 to 48% in 2025, narrowing the gap with nickel-cobalt-manganese. Tesla’s and Ford’s mainstream adoptions indicate acceptance of energy densities supporting 300-400 km ranges. Nickel-rich chemistries retain premium segments demanding over 500 km per charge. CATL’s 2024 Shenxing PLUS battery, leveraging silicon-carbon anodes, achieved 1,000 km nominal range and 10-minute 600 km recharge, blunting solid-state’s advantage. Sodium-ion is forecast to reach 5-8% of entry-level electric vehicles by 2028. Flow batteries, led by vanadium and iron chemistries, occupy six- to twelve-hour niches where decoupled scaling offsets lower efficiency.
By Application: Automotive Pulls Ahead of Industrial
Automotive batteries supplied 34.9% of revenue in 2025 and are growing at a 22.8% CAGR, the fastest among major end uses. Electrification mandates and hefty penalties for non-compliance force OEMs to lock in multi-gigawatt-hour contracts. Industrial deployments, covering utility-scale storage, material handling, and telecom backup, are anchored by grid-scale procurements that support renewable integration. Together, these segments keep the battery market size on its steep trajectory.
Geography Analysis
Asia-Pacific led with 47.0% battery market share in 2025 and registers a 20.3% CAGR through 2031. The region hosts 1,800 GWh of Chinese cell capacity and India’s incentives for 500 GWh by 2030. Chinese exports climbed to 127 GWh in H1 2024 as domestic utilization sagged to 56%. India’s 6.1 GWh of Q1 2025 standalone storage tenders plus Southeast Asian gigafactory announcements from Hyundai-LG, BYD, and CATL position the corridor as a tariff-free bridge into Western markets.[6]Press Information Bureau, Government of India, “PLI Scheme,” pib.gov.in
The North America market is lifted by the Inflation Reduction Act’s USD 7,500 consumer credit and content rules that catalyzed more than USD 150 billion in announced projects. LG Energy Solution-Honda, Panasonic-Tesla, and Samsung SDI-GM headline joint ventures totaling 110 GWh of capacity by 2027. Yet permitting delays and labor shortages push several launches into 2028, challenging 2030 thresholds. Canada courts cathode and hydroxide plants with CAD 13 billion in tax credits.
The EU Battery Regulation mandates recycled content and funnels EUR 1.5 billion in low-interest loans toward gigafactories. Automotive Cells Company targets 120 GWh by 2030 across France, Germany, and Italy. Germany earmarked EUR 3 billion for the sector, and France financed Verkor’s Dunkirk plant with EUR 2 billion. Still, Northvolt’s 2024 bankruptcy underscored execution risks as Chinese incumbents leverage cost parity even after tariffs.
BYD’s USD 620 million Brazil complex leverages Argentine and Chilean lithium, while Saudi Arabia’s Lucid factory and potential joint ventures with Chinese cell makers underpin a 30% national electric-vehicle target. South Africa’s 2.5 GWh procurement under the Renewable Energy IPP Program and Egypt’s assembly plans illustrate early regional momentum.

Competitive Landscape
The battery market is moderately concentrated: CATL, BYD, LG Energy Solution, Panasonic, and Samsung SDI control about 65% of lithium-ion capacity. BYD’s vertical stack spans mining, cathode, cell, and pack, yielding 30-40% lower costs than firms relying on external suppliers. CATL invests in Australian and African lithium mines to secure feedstock. Joint ventures dominate Western expansion; LG Energy Solution, Samsung SDI, and Panasonic each committed over USD 10 billion to partnerships with GM, Stellantis, Honda, and Tesla.
White-space opportunities lie in sodium-ion for entry-level vehicles, solid-state for premium segments, and closed-loop recycling. Redwood Materials scaled to 100 GWh of recycling capacity by 2025 and signed feedstock agreements with Panasonic and Toyota, cutting virgin mineral demand. Technology racelines include silicon anodes, single-crystal cathodes, and dry-electrode coating. Tesla’s 4680 cell, produced in Texas with a tabless design, aims for 50% cost cuts versus 2170 predecessors. QuantumScape’s Eagle Line start-up in 2026 could mark an inflection if solid-state economics reach parity in premium models.
Regional fragmentation persists in lead-acid, nickel-metal hydride, and niche chemistries. Clarios, EnerSys, GS Yuasa, and Exide hold sway in automotive and industrial backup. Emerging players like EVE Energy and Microvast target specialty transport and commercial fleets. Price wars in China push consolidation, but pockets of local demand and regulatory preferences preserve smaller actors in telecom backup and two-wheeler propulsion.
Battery Industry Leaders
CATL
BYD Co. Ltd
LG Energy Solution
Panasonic Energy
Samsung SDI
- *Disclaimer: Major Players sorted in no particular order

Recent Industry Developments
- January 2025: Forge Battery secured USD 100 million from the U.S. Department of Energy to build a lithium-ion gigafactory in North Carolina.
- December 2024: LG Energy Solution and India’s JSW entered talks for a USD 1.5 billion battery venture aimed at the Indian EV market.
- June 2024: Hyundai Motor and LG Energy Solution opened Indonesia’s first 10 GWh EV battery plant, tapping regional nickel reserves.
- June 2024: Amplify Cell Technologies broke ground on a 21 GWh LFP plant in Mississippi, a USD 3 billion joint venture by Cummins, Daimler Truck, and PACCAR.


Global Battery Market Report Scope
A battery is a device that converts chemical energy contained within its active materials directly into electric energy by means of an electrochemical oxidation-reduction (redox) reaction.
The battery market is segmented by type, technology, application, and geography. By type, the market is segment into primary battery and secondary battery. By technology, the market is segmented into lead-acid battery, lithium-ion battery, nickel-metal hydride (NiMh) battery, nickel-cadmium (NiCd) battery, nickel-zinc (NiZn) battery, flow battery, sodium–sulfur (NAS) battery, zinc-manganese dioxide battery, small sealed lead-acid battery, and other technologies (dual carbon battery, zinc-carbon battery, silver-oxide battery, etc.). By application, the market is segmented into automotive batteries (HEV, PHEV, and EV), industrial batteries (motive, stationary (telecom, ups, energy storage systems (ESS)), etc.), portable batteries (consumer electronics, etc. ), power tools batteries, SLI batteries, and other applications The report also covers the market size and forecasts for the battery market across major regions, such as Asia-Pacific, North America, Europe, South America, the Middle East, and Africa. For each segment, the market sizing and forecasts have been done based on revenue (USD).
By Battery Type
| Primary Batteries |
| Secondary Batteries |
By Technology
| Lead-acid |
| Li-ion |
| Nickel-metal hydride |
| Nickel-cadmium |
| Sodium-sulfur |
| Solid-state |
| Flow Battery |
| Emerging chemistries |
By Application
| Automotive (HEV, PHEV, and EV) |
| Industrial (Motive, Stationary (Telecom, UPS, ESS), etc.) |
| Portable (Consumer Electronics, etc.) |
| Power Tools |
| SLI |
| Other Applications |
By Geography
| North America | United States |
| Canada | |
| Mexico | |
| Europe | Germany |
| United Kingdom | |
| France | |
| Italy | |
| NORDIC Countries | |
| Russia | |
| Rest of Europe | |
| Asia-Pacific | China |
| India | |
| Japan | |
| South Korea | |
| ASEAN Countries | |
| Australia and New Zealand | |
| Rest of Asia-Pacific | |
| South America | Brazil |
| Argentina | |
| Colombia | |
| Rest of South America | |
| Middle East and Africa | Saudi Arabia |
| United Arab Emirates | |
| South Africa | |
| Egypt | |
| Rest of Middle East and Africa |
| By Battery Type | Primary Batteries | |
| Secondary Batteries | ||
| By Technology | Lead-acid | |
| Li-ion | ||
| Nickel-metal hydride | ||
| Nickel-cadmium | ||
| Sodium-sulfur | ||
| Solid-state | ||
| Flow Battery | ||
| Emerging chemistries | ||
| By Application | Automotive (HEV, PHEV, and EV) | |
| Industrial (Motive, Stationary (Telecom, UPS, ESS), etc.) | ||
| Portable (Consumer Electronics, etc.) | ||
| Power Tools | ||
| SLI | ||
| Other Applications | ||
| By Geography | North America | United States |
| Canada | ||
| Mexico | ||
| Europe | Germany | |
| United Kingdom | ||
| France | ||
| Italy | ||
| NORDIC Countries | ||
| Russia | ||
| Rest of Europe | ||
| Asia-Pacific | China | |
| India | ||
| Japan | ||
| South Korea | ||
| ASEAN Countries | ||
| Australia and New Zealand | ||
| Rest of Asia-Pacific | ||
| South America | Brazil | |
| Argentina | ||
| Colombia | ||
| Rest of South America | ||
| Middle East and Africa | Saudi Arabia | |
| United Arab Emirates | ||
| South Africa | ||
| Egypt | ||
| Rest of Middle East and Africa | ||


Key Questions Answered in the Report
How large is the battery market in 2026?
The battery market stood at USD 210.07 billion in 2026, progressing toward USD 469.49 billion by 2031 at a 17.45% CAGR.
Which battery technology is gaining share fastest after 2026?
Solid-state batteries post a 26.9% CAGR through 2031 as pilot lines scale and automotive integration begins.
What regional policies drive battery manufacturing in North America?
The Inflation Reduction Act’s tax credits and domestic-content rules have triggered over USD 150 billion in announced battery investments.
Why are lithium-ion pack prices expected to keep falling?
Vertical integration, larger gigafactories, and the switch to lithium iron phosphate chemistries are driving costs toward USD 80 kWh by 2028.
Which raw materials pose the greatest supply risk?
Lithium, cobalt, and nickel face bottlenecks due to concentrated refining and mining in limited jurisdictions with ESG challenges.
How does Chinese overcapacity affect global suppliers?
China’s 1,800 GWh capacity and low utilization rates depress global prices, pressuring Western entrants and prompting tariffs in the United States and Europe.
Page last updated on:


