Diesel Power Engine Market Size and Share
Market Overview
| Study Period | 2021 - 2031 |
|---|---|
| Market Size (2026) | USD 12.87 Billion |
| Market Size (2031) | USD 16.69 Billion |
| Growth Rate (2026 - 2031) | 5.33% CAGR |
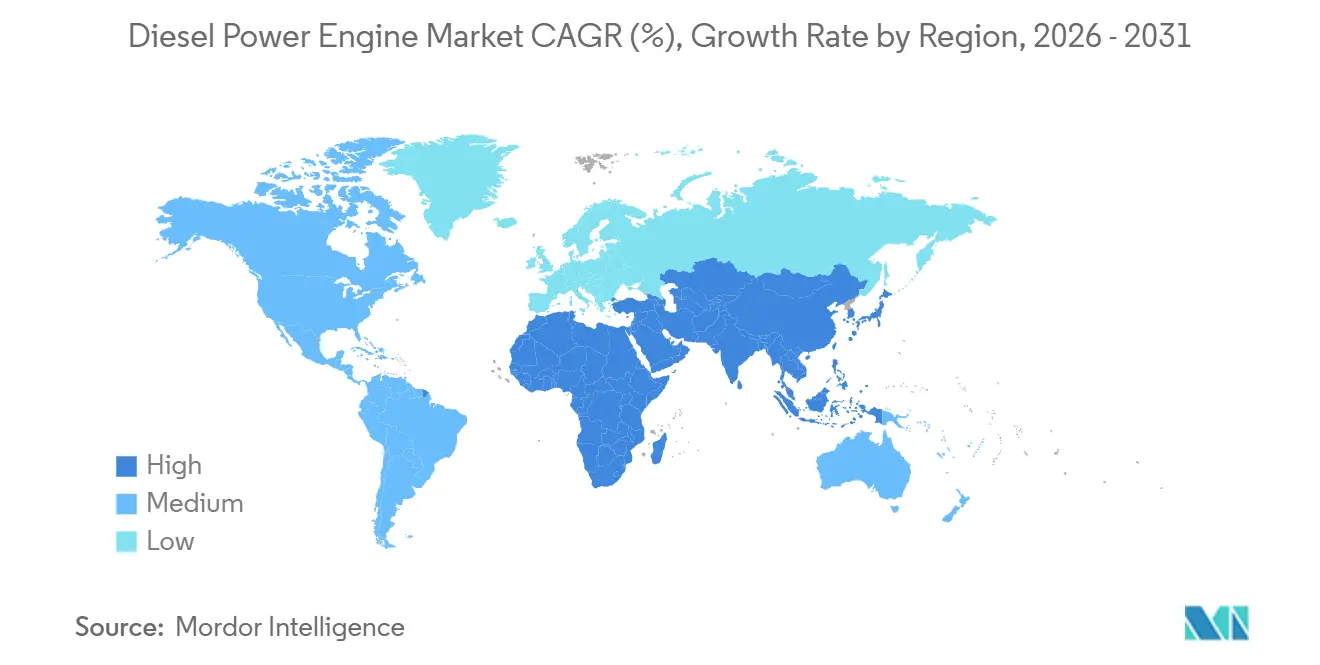
| Fastest Growing Market | Asia Pacific |
| Largest Market | Asia Pacific |
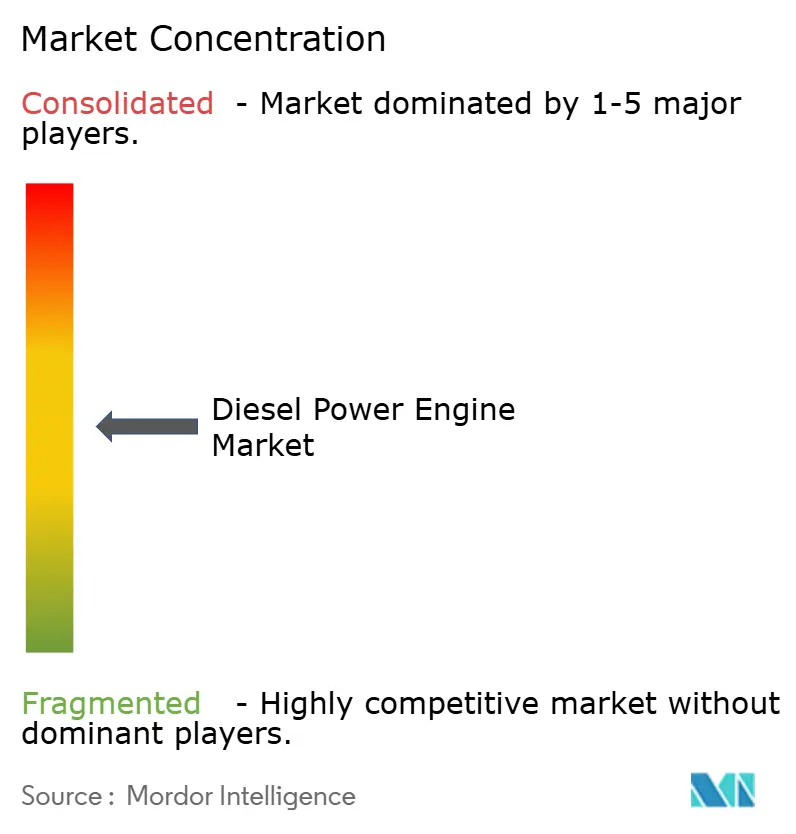
| Market Concentration | Medium |
Major Players *Disclaimer: Major Players sorted in no particular order Image © Mordor Intelligence. Reuse requires attribution under CC BY 4.0. | |

Diesel Power Engine Market Analysis by Mordor Intelligence
The Diesel Power Engine Market size is estimated at USD 12.87 billion in 2026, and is expected to reach USD 16.69 billion by 2031, at a CAGR of 5.33% during the forecast period (2026-2031).
Declining battery-storage costs, wider scrutiny of grid resilience, and the need for multi-day autonomy continue to shape procurement decisions, even as regulatory pressures intensify across OECD regions. Data-center expansions in Asia-Pacific, military modernization in NATO and Indo-Pacific countries, and grid-hardening initiatives in Sub-Saharan Africa provide steady volume for mid- and high-capacity gensets. Simultaneously, OEMs are front-loading investment into after-treatment systems and hybrid controllers to comply with EPA Tier 4 Final and EU Stage V norms and to preserve margins in a price-sensitive environment. Larger engines are also benefiting from modular designs that allow facilities to scale standby power in smaller increments, reducing single-point failure risk and easing maintenance scheduling.
Key Report Takeaways
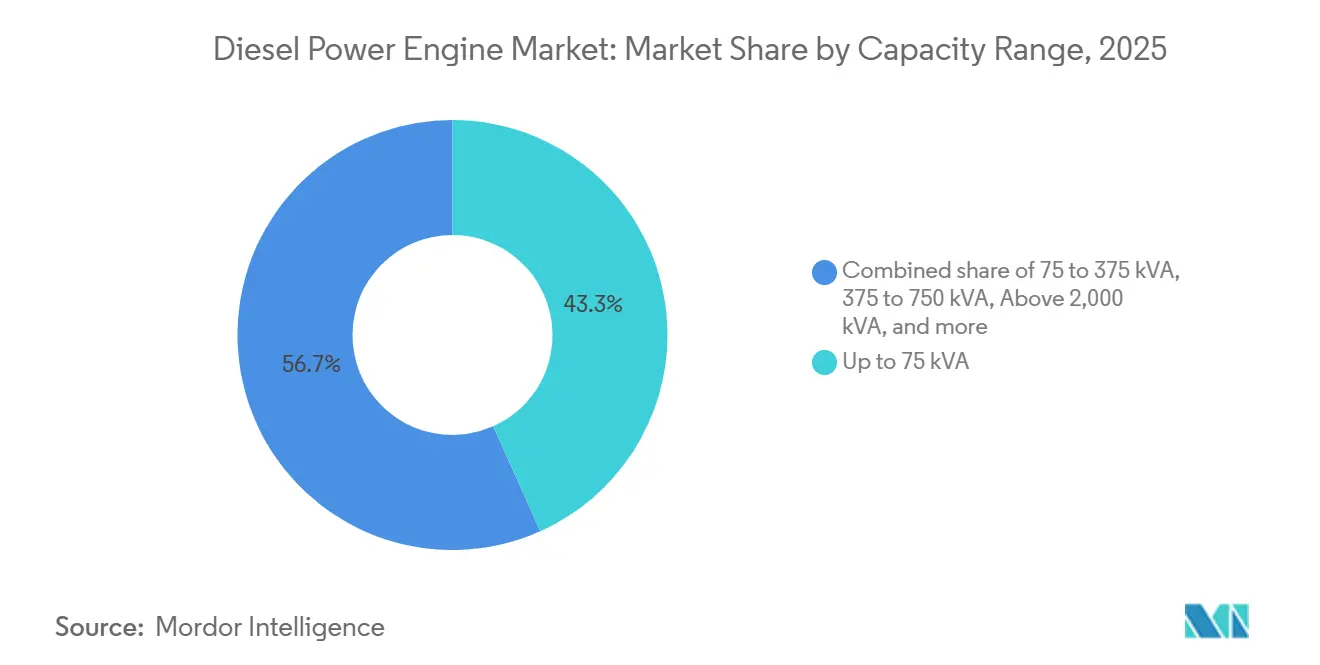
- By capacity, units up to 75 kVA held 43.3% of the diesel power engine market share in 2025, while the 375-750 kVA band is expanding at a 7.5% CAGR through 2031.
- By application, standby installations commanded 56.3% of the diesel power engine market size in 2025 and are advancing at a 6.3% CAGR through 2031.
- By end user, industrial facilities accounted for 55.7% of 2025 revenue and will grow at a 6.2% CAGR between 2026-2031.
- By geography, Asia-Pacific captured a 38.1% share in 2025 and is projected to post a 6.6% CAGR through 2031.
Note: Market size and forecast figures in this report are generated using Mordor Intelligence’s proprietary estimation framework, updated with the latest available data and insights as of January 2026.
Global Diesel Power Engine Market Trends and Insights
Drivers Impact Analysis*
| Driver | (~) % Impact on CAGR Forecast | Geographic Relevance | Impact Timeline |
|---|---|---|---|
| Grid-hardening investments in emerging markets | +1.2% | Sub-Saharan Africa, South Asia, Southeast Asia | Medium term (2-4 years) |
| Boom in data-center construction across Asia | +1.5% | China, India, ASEAN; spill-over to Middle East | Short term (≤ 2 years) |
| Industrial automation demand for mission-critical backup | +0.9% | North America, Europe, East Asia | Medium term (2-4 years) |
| Military mobile-power modernization programs | +0.6% | North America, Europe, Indo-Pacific | Long term (≥ 4 years) |
| Micro-utility growth in rural Africa | +0.5% | Sub-Saharan Africa, South Asia | Long term (≥ 4 years) |
| Maritime IMO III retrofit wave | +0.4% | Global maritime routes, Asian shipyards | Medium term (2-4 years) |
| Source: Mordor Intelligence | |||


Grid-Hardening Investments in Emerging Markets
Utilities in Sub-Saharan Africa and South Asia are adopting diesel-solar mini-grids as an interim solution while long-distance transmission lines and substations catch up with electrification targets. In 2025, the World Bank allocated USD 2.3 billion for rural projects pairing 50-150 kW engines with photovoltaic arrays, lowering delivered power costs to USD 0.18-0.25 per kWh in 18 African nations.[1]World Bank Group, “Mini-Grid Market Opportunities,” worldbank.org India’s Saubhagya program completed household connections yet still recorded sub-12-hour daily reliability in 40% of rural districts, prompting state utilities to order 15,000 standby gensets last year.[2]Government of India, “Saubhagya Scheme Dashboard,” gov.in These sets often run 6-10 hours per day, driving faster wear and replacement cycles. The African Development Bank confirms similar economics, noting that mini-grids can undercut regulated tariffs without direct subsidies in Kenya, Tanzania, and Nigeria.[3]African Development Bank, “Hybrid Mini-Grid Economics in Africa,” afdb.org
Boom in Data-Center Construction Across Asia
Hyperscale operators installed 1.2 GW of new diesel standby capacity in Asia-Pacific during 2025, with India and China representing 68% of the total build-out. Microsoft and AWS committed USD 6.5 billion to campuses in Hyderabad requiring N+1 diesel redundancy for 72-hour operation, while China’s Ministry of Industry and Information Technology obliges all new Tier-3 sites to store three days of fuel on-site.[4]Ministry of Industry and Information Technology, “Data Center Energy Regulations,” miit.gov.cn NREL’s latest density models suggest battery systems will not match diesel’s energy storage efficiency at the multi-megawatt scale until after 2029.
Industrial Automation Demand for Mission-Critical Backup
Semiconductor fabs, automotive lines, and pharmaceutical clean rooms have tightened voltage-sag tolerances to less than 2%. In Arizona, TSMC installed six Caterpillar 3512C gensets rated 1,825 kVA each, capable of full load within 10 seconds of grid loss. Cummins reports a 31% year-on-year surge in orders for QSK60 and QSK95 engines equipped with digital load-sharing controllers for plants in Mexico and Eastern Europe. Vaccine cold-chain hubs in Singapore and Belgium specified automatic-transfer switches rated for 100,000 cycles, highlighting how downtime avoidance justifies higher capital outlay.
Military Mobile-Power Modernization Programs
NATO identified aging 60 kVA tactical sets as a capability gap and began replacing them with 375-750 kVA modular units interoperable with JP-8, F-76, and commercial ultra-low-sulfur diesel. The U.S. Army awarded Cummins a USD 180 million contract in 2025 for 1,200 AMMPS gensets rated 450 kVA each. Australia’s Department of Defence ordered Caterpillar C18 units for forward bases, emphasizing silent-watch and encrypted controls to thwart cyber intrusion.
Restraints Impact Analysis*
| Restraint | (~) % Impact on CAGR Forecast | Geographic Relevance | Impact Timeline |
|---|---|---|---|
| Rapid fall in battery-storage LCOE | -1.3% | North America & Europe (primary), Asia-Pacific (accelerating), with spillover to Middle East & Africa | Short term (≤ 2 years) |
| Tighter NOx & particulate limits in OECD markets | -0.9% | North America, Europe, Japan, South Korea (OECD core markets) | Medium term (2-4 years) |
| LNG-to-power small-scale deployments | -0.6% | Asia-Pacific, Middle East, Africa, Latin America (emerging markets with gas infrastructure development) | Medium to Long term (3-5 years) |
| OEM supply-chain exposure to Tier-1 chip shortages | -0.4% | Global (affecting all major manufacturing regions and OEMs) | Short to Medium term (1-3 years) |
| Source: Mordor Intelligence | |||
Rapid Fall in Battery-Storage LCOE
Lithium-ion battery pack prices fell to USD 139 per kWh in 2024, a 14% drop from 2023, making four-hour storage viable for commercial buildings previously reliant on diesel. California’s Self-Generation Incentive Program distributed USD 320 million in 2025, allowing hospitals and data centers to substitute battery systems for short-duration outages. Lazard’s 2025 analysis shows a 1 MW/4 h battery delivers backup at USD 0.18 per kWh over 15 years, versus USD 0.22 for a diesel set running 50 hours per year. Yet providing 72-hour autonomy for a 5 MW load still requires a 360 MWh battery system costing about USD 50 million, compared to USD 3 million for diesel hardware and fuel.
Tighter NOx & Particulate Limits in OECD Markets
EPA Tier 4 Final and EU Stage V standards cap nitrogen oxides at 0.4 g/kWh and particulate matter at 0.02 g/kWh, forcing adoption of SCR and diesel particulate filters. Caterpillar’s compliant C9.3B engine adds USD 18,000 in after-treatment components, raising the price of a 500 kVA genset by 12%. The California Air Resources Board plans to prohibit new diesel sets above 500 kW in certain air basins from 2027, potentially affecting 22% of U.S. commercial sales (arb.ca.gov). European regulators are debating real-time emissions monitoring for engines above 1 MW, adding USD 25,000-40,000 per unit.
*Our forecasts treat driver/restraint impacts as directional, not additive. The impact forecasts reflect baseline growth, mix effects, and variable interactions.
Segment Analysis
By Capacity Range: Mid-Power Surge Reshapes Demand
The diesel power engine market size for 375-750 kVA units is expanding at 7.5% per year during 2026-2031, outpacing every other band as hospitals, telecom hubs, and factories upgrade to higher reliability specifications. Sets up to 75 kVA retained 43.3% of the diesel power engine market share in 2025 by serving residential and small-commercial loads, yet growth moderates to 4.8% as affluent consumers migrate toward solar-battery solutions. Mid-range 75-375 kVA engines equip retail centers and food-processing sites where automatic transfer within 10 seconds is now a standard bid requirement. At 500-750 kVA, Caterpillar’s C18 and Rolls-Royce’s mtu 12V 2000 capture healthcare and telecom orders by coupling variable-geometry turbochargers with 6% lower fuel burn. Units above 2,000 kVA continue to serve hyperscale campuses, though operators now favor multiple 1,500-2,000 kVA modules for redundancy rather than single 4 MW blocks, tempering procurement cycles but not eliminating demand.
Telecom carriers in India and Indonesia are retiring 250 kVA gensets in favor of 500-600 kVA models to feed 5G radio units that consume 40% more power than 4G. PwC’s 2025 telecom-energy audit found that 600 kVA machines cut carbon intensity 12% on a per-subscriber basis by reducing runtime through improved efficiency. Hospital administrators similarly specify 600-750 kVA arrays to cover expanded ICU and imaging loads, and these orders are bundled with eight-hour load-bank tests to secure insurance certification. Small sets under 75 kVA will still permeate rural Africa and South Asia, aided by micro-financing programs that spread payments over five years.


By Application: Standby Installations Cement Dominance
Standby duty accounted for 56.3% of 2025 revenue and will rise at a 6.3% CAGR, underscoring diesel’s role as insurance rather than baseload generation. Regulatory frameworks tighten fuel-reserve targets: U.S. hospitals must maintain 96 hours of storage and run monthly load tests, prompting 1,800 facilities to replace or augment legacy equipment. Data-center colocation providers limit runtime to fewer than 50 hours a year yet demand 72-hour autonomy, further anchoring diesel in the architecture of digital infrastructure. Prime-duty engines running daily in off-grid mines or island utilities advance at 4.2% as LNG micro-turbines and solar hybrids capture part of the segment. Peak-shaving remains a niche play, hindered by batteries that bid into demand-response programs without emitting pollutants; California enrolled 420 MW of battery capacity for this purpose in 2025.
Across standby operations, the diesel power engine market size for healthcare alone is forecast to hit USD 3.1 billion by 2031, reflecting growth in imaging and critical-care wings. Continuous-duty applications survive where heat recovery boosts total efficiency above 70%; a Brazilian ethanol plant achieved this threshold using Cummins QSK60 units paired with heat-recovery boilers. Peak-shaving still appeals to industrial users in regions with punitive demand charges, provided local air-quality rules allow limited runtime.
By End User: Industrial Sector Anchors Growth
Industrial plants retained 55.7% revenue in 2025 and will maintain a 6.2% CAGR through 2031. Semiconductor fabs deploy multimillion-dollar backup suites. TSMC’s Arizona line invested in six synchronized 1,825 kVA units because a single power event can scrap USD 2-5 million in wafers. Automotive suppliers reshoring to Mexico and Eastern Europe replicate similar architectures, producing a wave of 500-1,500 kVA orders that extend well beyond 2029. Cold-chain logistics facilities safeguard vaccine inventories using diesel gensets with automatic transfer switches designed for 100,000 cycles, a specification now written into most pharmaceutical RFPs.
Commercial buildings occupy 38% of 2025 sales, with developers in California and New York choosing natural-gas engines backed by small diesel sets to satisfy air-quality mandates. Generac’s 350 kVA gas-diesel hybrid targets this slice, promising 15-year total cost parity with a traditional diesel-only approach. Residential demand grows at 4.5% but is bifurcated: solar-battery adoption trims sales in wealthy suburbs while micro-finance expands ownership of 10-25 kVA sets in India, Nigeria, and the Philippines. Kirloskar’s financing plan with HDFC Bank lowered the upfront cost to USD 800-1,200, capturing 62% of India’s sub-15 kVA niche.

Geography Analysis
Asia-Pacific booked 38.1% of 2025 turnover and is set to deliver a 6.6% CAGR, backed by China’s mandate for 72-hour reserves at all new Tier-3 data centers and India’s USD 1.3 trillion infrastructure roadmap. ASEAN’s telecom tower boom under unreliable grids spurred Yanmar to place 2,500 gensets in rural India and Indonesia during 2025. Middle-East-Africa clocks a robust 6.4% CAGR: Saudi Arabia’s NEOM ordered 400 MW of standby power using Wärtsilä 31 engines, and Kenya, Tanzania, and Nigeria scale mini-grid programs with World Bank backing. North America posts a mature 4.1% trajectory, limited by battery incentives and stricter emissions but buoyed by military contracts and semiconductor reshoring. Europe’s 3.8% clip reflects parallel pressures, especially with the pending Industrial Emissions Directive that may require live emissions telemetry on engines over 1 MW.
Across the diesel power engine market, Asia-Pacific’s sustained investment pipeline and looser emissions rules offset headwinds in developed economies. The Middle East leverages petro-financed megaprojects to offset rising gas-turbine adoption, while Sub-Saharan Africa relies on hybrid diesel-solar mini-grids to bridge electrification gaps through 2035.

Competitive Landscape
The top five OEMs, Caterpillar, Cummins, Generac, Kohler, and Wärtsilä, captured a combined 48% of global revenue in 2025, lending the diesel power engine market a moderately concentrated profile. Caterpillar and Cummins dominate mid- to high-capacity sets, plowing R&D into after-treatment and digital diagnostics; Cummins allocated USD 890 million to R&D in 2025, with 18% devoted to remote analytics and alternative fuels. Wärtsilä and Rolls-Royce focus on utility-scale microgrids, showcasing hybrid controllers that shave fuel consumption 30-40% during partial-load events. Generac and Kohler rely on extensive dealer networks to address North American home and light-commercial replacements, while Himoinsa and Kirloskar win on speed-to-market in rental and off-grid telecom niches.
Patent filings for digital load-sharing and hybrid controllers rose 22% year-on-year, underlining a pivot toward total cost-of-ownership differentiation rather than raw horsepower. Mitsubishi Heavy Industries’ S16R-PTA2 earned IMO III certification by integrating urea injection and exhaust-gas recirculation, capturing Asian yard retrofits for auxiliary power. Aggreko’s battery-diesel hybrids trimmed runtime 40% during short outages at Malaysian data centers, signaling emergent competition from rental specialists offering modular green upgrades. Successful OEMs will pair emissions-compliant hardware with financing structures that spread higher acquisition costs over long service contracts, ensuring adoption in both regulated and emerging markets.
Diesel Power Engine Industry Leaders
Caterpillar Inc.
Cummins Inc.
Generac Holdings Inc.
Kohler Co.
Mitsubishi Heavy Industries Ltd.
- *Disclaimer: Major Players sorted in no particular order

Recent Industry Developments
- January 2026: Stellantis' Ram brand has introduced the 6.7 L Cummins High-Output (HO) turbo diesel in the Ram Power Wagon for the first time. The new Power Wagon, equipped with the 6.7 L inline-six diesel engine, boasts an impressive output of 430 hp (321 kW) and a torque of 1,075 lb-ft (1,458 Nm). Ram proudly markets the vehicle as the most off-road-capable full-size pickup on the market.
- October 2025: Researchers at the Federal University of Technology, Owerri, in Nigeria, have unveiled a groundbreaking method to reduce diesel engine pollution without compromising performance.
- April 2024: Weichai Power has launched a groundbreaking diesel engine boasting an unprecedented thermal efficiency of 53.09%. This achievement not only sets a new global record but also eclipses the standard diesel engine efficiency, which hovers between 30% and 35%.


Global Diesel Power Engine Market Report Scope
A diesel power engine is an internal combustion engine in which compressed air is heated to a high enough temperature to ignite diesel fuel pumped into the cylinder, where combustion and expansion operate a piston.
The diesel power engine market is segmented by capacity range, application, end user (industrial, commercial, residential), and geography. By capacity range, the market is segmented into up to 75 kVA, 75 to 375 kVA, 375 to 750 kVA, 750 to 2,000 kVA, and above 2,000 kVA. By application, the market is segmented into stand-by, prime/continuous, and peak-shaving. By end user, the market is segmented into industrial, commercial, and residential. The report also covers the market size and forecasts for the diesel power engine market across major regions. For each segment, the market sizing and forecasts were made based on revenue (USD).
| Up to 75 kVA |
| 75 to 375 kVA |
| 375 to 750 kVA |
| 750 to 2,000 kVA |
| Above 2,000 kVA |
| Stand-by |
| Prime/Continuous |
| Peak-shaving |
| Industrial |
| Commercial |
| Residential |
| North America | United States |
| Canada | |
| Mexico | |
| Europe | United Kingdom |
| Germany | |
| France | |
| Spain | |
| NORDIC Countries | |
| Russia | |
| Rest of Europe | |
| Asia-Pacific | China |
| India | |
| Japan | |
| South Korea | |
| ASEAN Countries | |
| Australia and New Zealand | |
| Rest of Asia-Pacific | |
| South America | Brazil |
| Argentina | |
| Colombia | |
| Rest of South America | |
| Middle East and Africa | Saudi Arabia |
| United Arab Emirates | |
| South Africa | |
| Egypt | |
| Rest of Middle East and Africa |
| By Capacity Range | Up to 75 kVA | |
| 75 to 375 kVA | ||
| 375 to 750 kVA | ||
| 750 to 2,000 kVA | ||
| Above 2,000 kVA | ||
| By Application | Stand-by | |
| Prime/Continuous | ||
| Peak-shaving | ||
| By End User | Industrial | |
| Commercial | ||
| Residential | ||
| By Geography | North America | United States |
| Canada | ||
| Mexico | ||
| Europe | United Kingdom | |
| Germany | ||
| France | ||
| Spain | ||
| NORDIC Countries | ||
| Russia | ||
| Rest of Europe | ||
| Asia-Pacific | China | |
| India | ||
| Japan | ||
| South Korea | ||
| ASEAN Countries | ||
| Australia and New Zealand | ||
| Rest of Asia-Pacific | ||
| South America | Brazil | |
| Argentina | ||
| Colombia | ||
| Rest of South America | ||
| Middle East and Africa | Saudi Arabia | |
| United Arab Emirates | ||
| South Africa | ||
| Egypt | ||
| Rest of Middle East and Africa | ||


Key Questions Answered in the Report
What is the expected CAGR for diesel power engines between 2026-2031?
The diesel power engine market is projected to grow at a 5.33% CAGR during 2026-2031, driving the market from USD 12.87 billion in 2026 to USD 16.69 billion in 2031.
Which capacity range is expanding the fastest?
Engines rated 375-750 kVA are growing at 7.5% annually, driven by hospital, telecom, and manufacturing upgrades.
Why does Asia-Pacific dominate future demand?
Large data-center rollouts, infrastructure spending, and rural electrification gaps give Asia-Pacific 38.1% share and a 6.6% growth trajectory.
How are emissions regulations affecting OEM costs?
Compliance with EPA Tier 4 Final and EU Stage V adds roughly USD 18,000 per 500 kVA unit for after-treatment hardware.
Are batteries replacing diesel in standby roles?
Batteries are gaining share for four-hour autonomy needs, but diesel remains the cost-effective choice for multi-day backup where 72-hour reserves are mandated.
Which companies lead R&D on alternative fuels?
Rolls-Royce and Cummins are testing hydrogen blends and hybrid controllers, while Mitsubishi Heavy Industries focuses on marine IMO III compliance.
Page last updated on:


