Redox Flow Battery Market Size and Share
Market Overview
| Study Period | 2021 - 2031 |
|---|---|
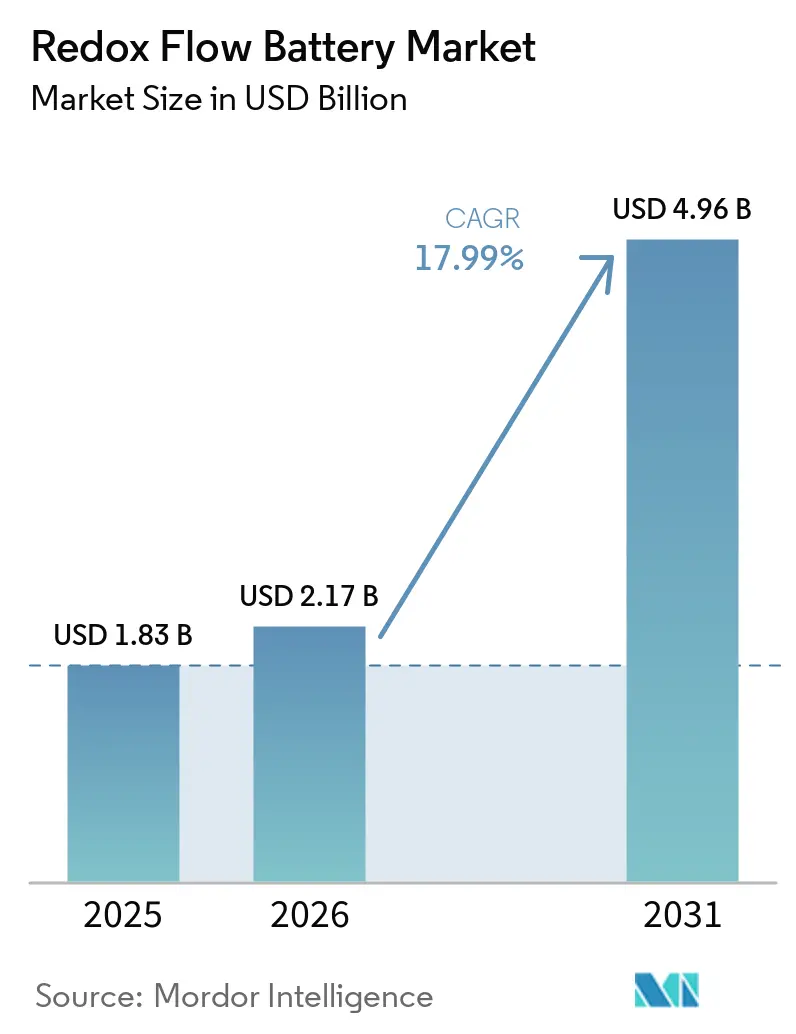
| Market Size (2026) | USD 2.17 Billion |
| Market Size (2031) | USD 4.96 Billion |
| Growth Rate (2026 - 2031) | 17.99% CAGR |
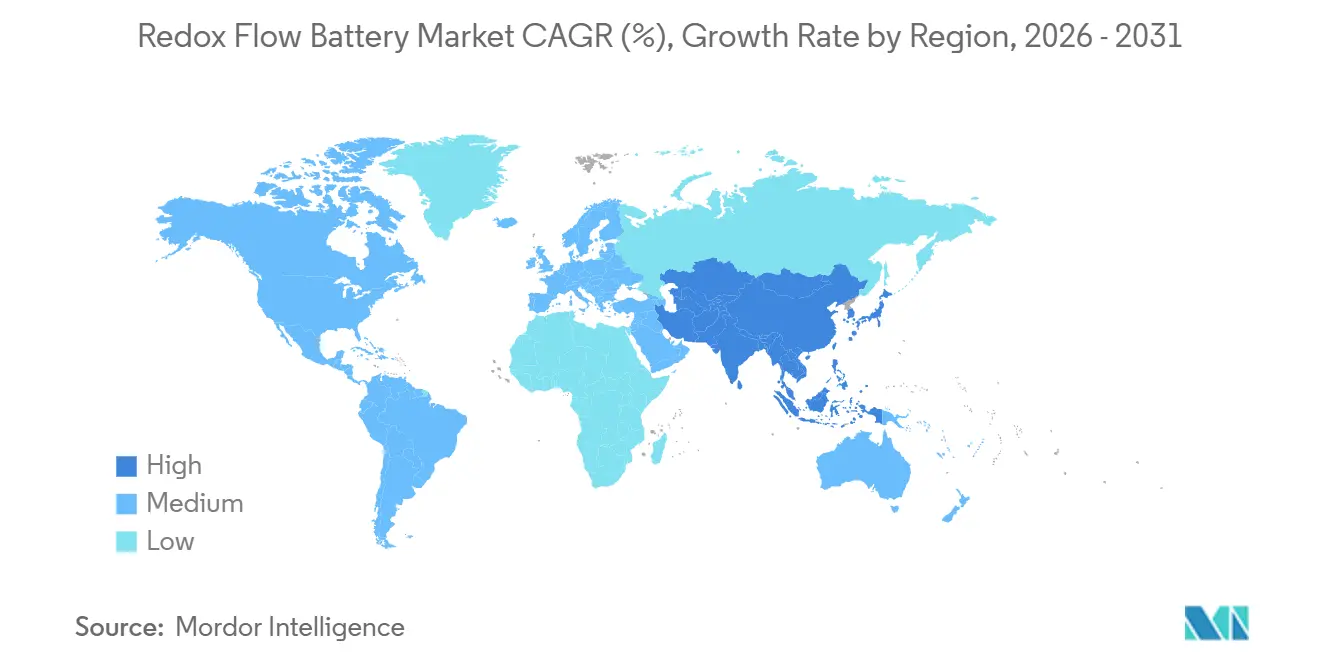
| Fastest Growing Market | Asia Pacific |
| Largest Market | Asia Pacific |
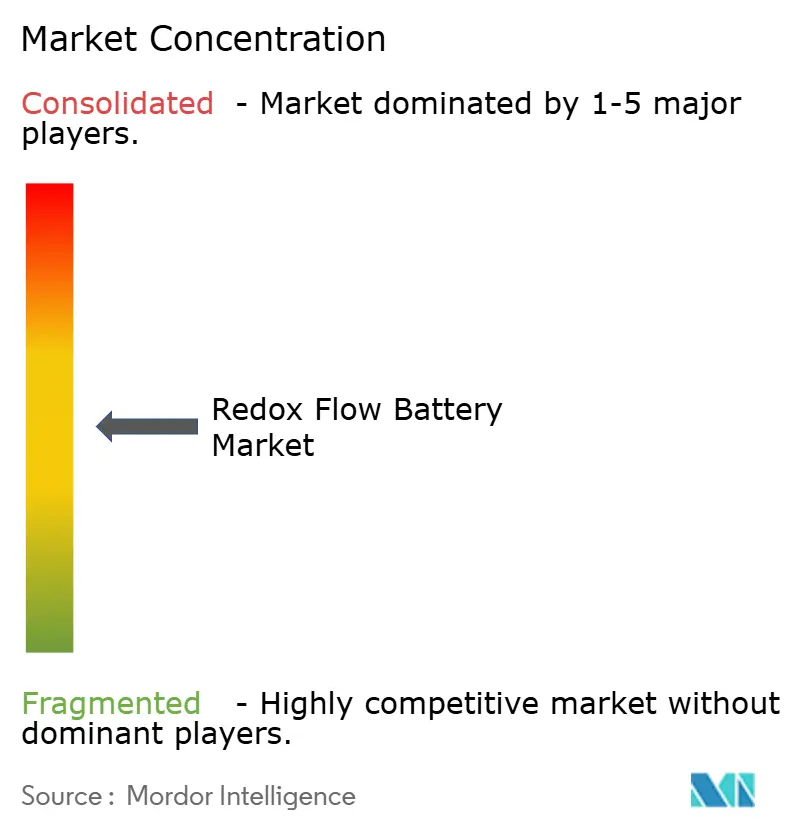
| Market Concentration | Medium |
Major Players *Disclaimer: Major Players sorted in no particular order Image © Mordor Intelligence. Reuse requires attribution under CC BY 4.0. | |
Redox Flow Battery Market Analysis by Mordor Intelligence
The Redox Flow Battery Market size is projected to expand from USD 1.83 billion in 2025 and USD 2.17 billion in 2026 to USD 4.96 billion by 2031, registering a CAGR of 17.99% between 2026 to 2031. Rising policy support for long-duration storage, falling electrolyte leasing costs, and mounting corporate demand for eight-hour-plus storage contracts are widening the addressable base for flow systems beyond traditional pilot programs. Vanadium chemistries still anchor nearly half of installed capacity, yet iron flow designs are moving from laboratory scale to multi-megawatt arrays as developers pursue abundant feedstocks and simplified supply chains. Utility-scale projects account for more than half of global deployments, but commercial and industrial owners are accelerating fastest because demand-charge arbitrage can trim peak grid draws by 30-50%.[1]BloombergNEF, “Long-Duration Storage Outlook,” about.bnef.com Asia-Pacific dominates installations on the back of China’s 12 GWh mandate, while U.S. tax credits and European market-access reforms are catalyzing new procurement models that blend wholesale-market revenues with behind-the-meter savings.[2]Federal Energy Regulatory Commission, “Order 841 Storage Participation,” ferc.gov
Key Report Takeaways
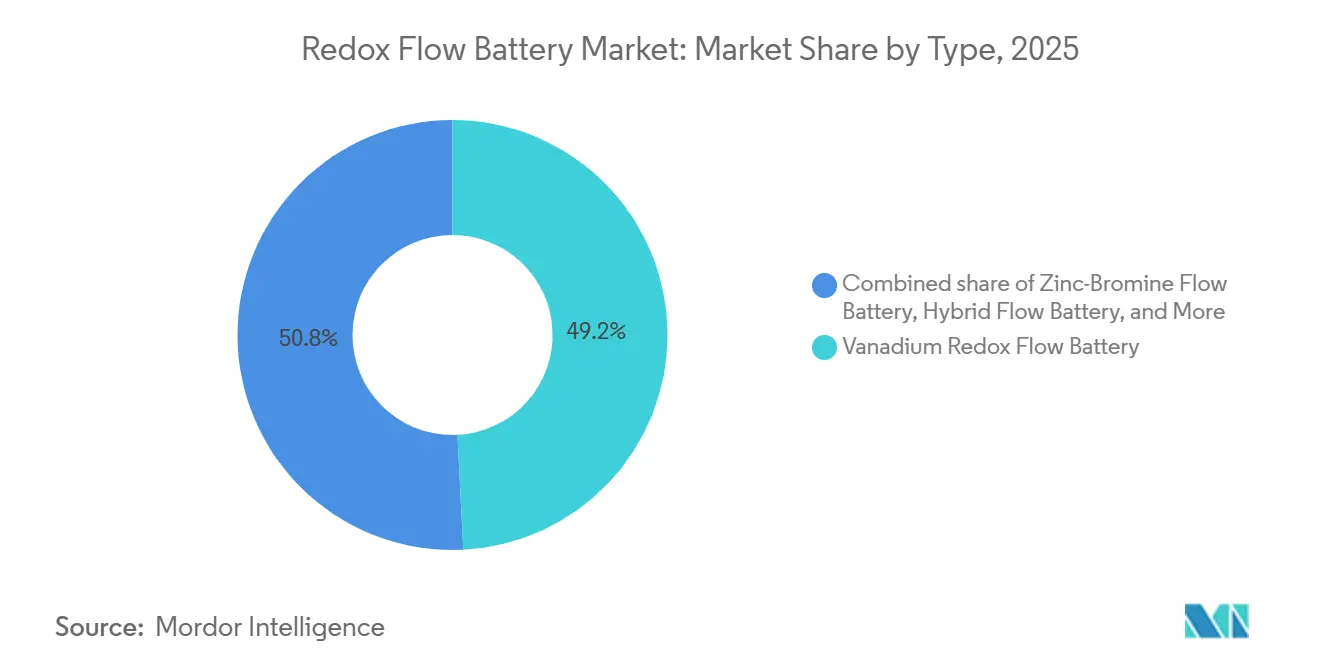
- By type, vanadium systems led with 49.2% of redox flow battery market share in 2025, whereas iron flow chemistries are advancing at a 22.2% CAGR through 2031.
- By application, utility-scale installations captured 53.8% of the redox flow battery market size in 2025, while commercial and industrial facilities are projected to grow at a 23.4% CAGR to 2031.
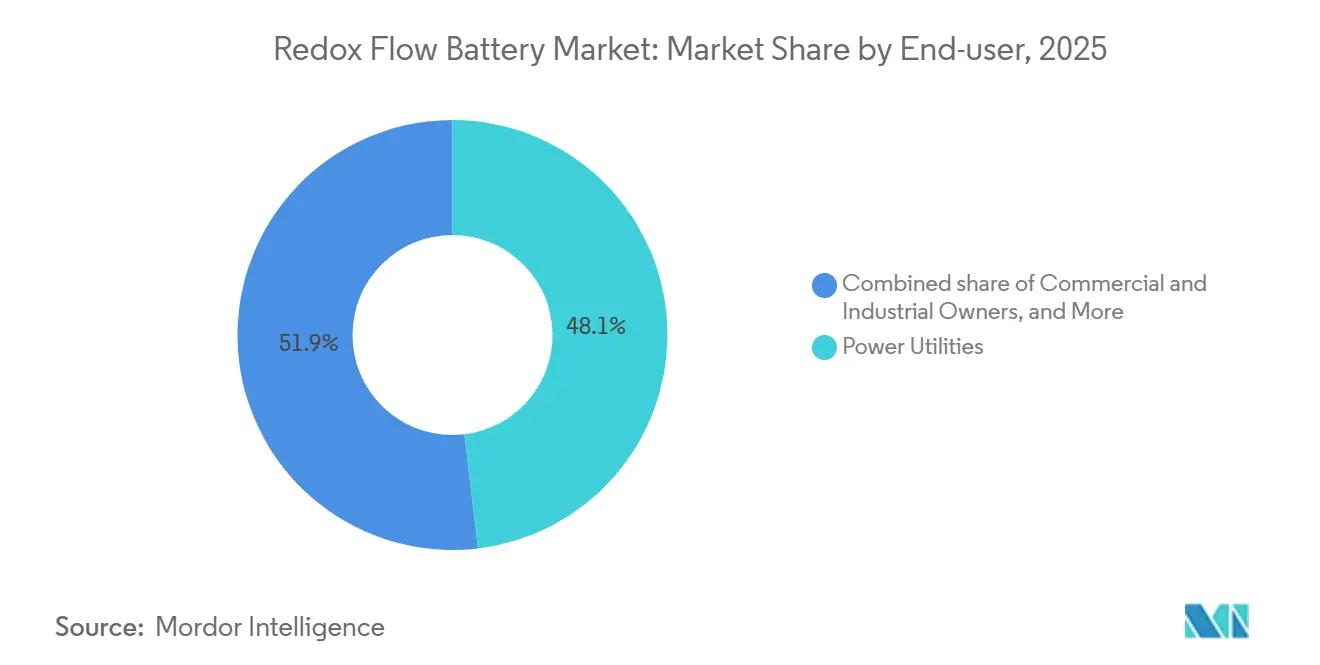
- By end-user, power utilities and IPPs held 48.1% revenue share in 2025; commercial and industrial owners record the highest forecast CAGR at 23.7% over 2026-2031.
- By geography, Asia-Pacific commanded 45.9% of global capacity in 2025 and is projected to expand at a 19.3% CAGR through 2031.
Note: Market size and forecast figures in this report are generated using Mordor Intelligence’s proprietary estimation framework, updated with the latest available data and insights as of January 2026.
Global Redox Flow Battery Market Trends and Insights
Drivers Impact Analysis*
| Driver | (~) % Impact on CAGR Forecast | Geographic Relevance | Impact Timeline |
|---|---|---|---|
| Grid-stability mandates | +3.2% | North America & Europe, spillover to APAC | Medium term (2-4 years) |
| Vanadium leasing cost decline | +2.8% | Global, early adoption in China, Australia, North America | Short term (≤ 2 years) |
| Solar & wind LCOE parity | +3.5% | Global, concentrated in high-renewable regions | Long term (≥ 4 years) |
| Corporate net-zero storage PPAs | +2.1% | North America & Europe, emerging in Asia-Pacific | Medium term (2-4 years) |
| Made-in-USA tax credits (IRA 45X) | +2.6% | United States, indirect global pricing influence | Short term (≤ 2 years) |
| Data-center micro-grid reliability targets | +1.9% | North America, Europe, APAC hubs | Medium term (2-4 years) |
| Source: Mordor Intelligence | |||
Grid-Stability Mandates Drive Wholesale Market Integration
Federal Energy Regulatory Commission Order 841 obliges U.S. wholesale markets to accept storage assets for all services for which they are technically capable, unlocking new revenue streams for flow batteries that previously relied on behind-the-meter savings alone.[3]Federal Energy Regulatory Commission, “Order 841 Storage Participation,” ferc.gov Europe’s Clean Energy Package imposes similar reforms by 2026, and developers have already announced 1.2 GW of flow projects in Germany, the United Kingdom, and the Nordic region.[4]European Commission, “Clean Energy Package Implementation,” ec.europa.eu Order 2222 further aggregates distributed resources, allowing commercial sites to pool flow batteries and earn capacity and ancillary revenue, which shortens project payback from 12 years to 7 years in solar-heavy states. U.S. utilities in California and Texas now issue tenders that explicitly favor non-lithium chemistries for six-hour-plus services because flow systems decouple power and energy, enabling incremental capacity additions without full system replacement. Mandates, therefore, underpin scheduling flexibility and economic certainty, accelerating procurement decisions across both regulated and deregulated markets.
Vanadium Leasing Models Accelerate Capital Cost Reduction
Electrolyte leasing agreements, exemplified by Storion Energy’s USD 85 kWh program, cut initial capital requirements by up to 60% and transfer commodity risk to the lessor. Because vanadium retains 99% recyclability, leasing firms can redeploy electrolyte over multiple 20-year cycles, creating a circular-economy advantage that lithium-ion lacks. Chinese developers have validated lease-to-own structures that convert operating expenses into asset ownership after roughly a decade, aligning cost profiles with corporate renewable PPAs. Academic studies project that ten-hour vanadium systems fall below USD 300 kWh when electrolyte is leased, undercutting lithium iron phosphate at equivalent durations. As financial innovations diffuse globally, capital-intensive long-duration projects gain bankability, widening the total addressable redox flow battery market.
Solar and Wind LCOE Parity Creates Duration-Specific Storage Demand
Solar PV and onshore wind now produce power at USD 20-50 MWh, outcompeting gas-fired generation in resource-rich regions. Yet pairing four-hour lithium-ion storage with renewables lifts delivered costs to USD 60-90 MWh, whereas eight-hour redox flow systems cost USD 80-120 MWh absent policy incentives. California’s Self-Generation Incentive Program allocates enhanced rebates for six-hour-plus storage, bridging part of this gap and pushing commercial customers toward flow chemistries that offer 25-year calendar life and unlimited cycling. BloombergNEF forecasts that long-duration storage costs must halve this decade, and material-light iron or organic chemistries are on a steeper decline curve than lithium variants. The convergence of low renewable cost and policy signals, therefore, magnifies unmet eight-to-twelve-hour needs, reinforcing demand for the redox flow battery market.
Corporate Net-Zero Procurement Drives 8-12-Hour Storage PPAs
Google’s 300 MW, 30 GWh agreement with Form Energy and Microsoft’s 24/7 carbon-free standard exclude four-hour lithium solutions from consideration for many hyperscale data centers. Approximately 30% of planned U.S. data-center capacity is shifting to behind-the-meter self-supply, with most projects located in renewable-rich but intermittency-prone states, creating persistent demand for eight-hour discharge capabilities. Virtual PPAs increasingly embed firming clauses, and flow batteries can meet these profiles without gas peakers, thus lowering scope-3 emissions for corporate buyers. The trend adds a stable offtake channel that improves revenue stacking and underpins project-finance terms, propelling the redox flow battery market forward.
Restraints Impact Analysis*
| Restraint | (~) % Impact on CAGR Forecast | Geographic Relevance | Impact Timeline |
|---|---|---|---|
| Volatile vanadium price linked to steel demand | -1.8% | Global, with concentrated impact in China, Russia, South Africa supply chain | Short term (≤ 2 years) |
| Lower round-trip efficiency vs lithium-ion | -1.3% | Global, particularly acute in daily-cycling applications | Medium term (2-4 years) |
| PFAS-free membrane regulations | -0.9% | Europe & North America, spillover to export markets | Long term (≥ 4 years) |
| Lengthy permitting for >50 MWh haz-mat electrolyte trucking | -0.7% | North America, select European jurisdictions | Medium term (2-4 years) |
| Source: Mordor Intelligence | |||
Volatile Vanadium Pricing Creates Investment Uncertainty
Vanadium pentoxide fell from USD 9.20 lb in 2022 to USD 5.60 lb in March 2026, a 40% slide tied to weak Chinese steel demand. Although the slump lowered capex for new projects, uncertainty complicates long-term offtake agreements and deters lenders. CRU Group expects demand from China’s 12 GWh mandate to lift prices later in the decade, but fresh supply from Brazil and Madagascar could mute any rally. Developers thus hedge price swings through electrolyte leasing, but fluctuations still sway debt-service coverage ratios, marginally slowing redox flow battery market growth.
Lower Round-Trip Efficiency Versus Lithium-Ion
Vanadium systems operate at 65-85% efficiency compared with 88–92% for lithium iron phosphate at the system level, adding USD 10-15 MWh to levelized costs for daily cycling. Laboratory advances have pushed prototype stacks above 80%, but commercialization lags. For solar-plus-storage time-shift, the penalty is tolerable; however, frequency-regulation markets where round-trip efficiency is paramount still lean toward lithium or super-capacitors. Efficiency gaps, therefore, constrain certain revenue streams within the redox flow battery market.
*Our forecasts treat driver/restraint impacts as directional, not additive. The impact forecasts reflect baseline growth, mix effects, and variable interactions.
Segment Analysis
By Type: Iron Flow Disrupts Vanadium Incumbency
Vanadium designs maintained 49.2% redox flow battery market share in 2025 on the back of a mature ecosystem in China, Japan, and South Korea. Iron flow systems, however, are projected to grow at 22.2% CAGR to 2031 as vendors eliminate reliance on critical minerals and boost energy density 20% over first-generation stacks. Vanadium’s dominance persists because 99% electrolyte recyclability underwrites residual value at end-of-life, yet feedstock volatility nudges risk-averse financiers toward iron alternatives. Zinc-bromine occupies telecom backup and off-grid niches, while organic and hybrid concepts remain pre-commercial. Over the forecast period, technology pluralism is likely, with regional policies shaping deployment preferences rather than a single chemistry winning outright in the redox flow battery market.
Second-generation vanadium stacks now tout 20,000-cycle lifetimes, double that of lithium iron phosphate, supporting warranty terms that appeal to infrastructure investors seeking stable cash flows. Meanwhile, membrane innovators are striving for PFAS-free solutions to pre-empt European regulation. Altogether, technology shifts are starting to erode barriers to entry, suggesting that vanadium’s share may slip below 40% by 2031 even as absolute shipments grow, broadening competitive dynamics within the redox flow battery market.


By Application: C&I Facilities Surge on Demand-Charge Savings
Utility-scale arrays delivered 53.8% of shipments in 2025, anchored by headline projects in California and Hubei. Yet commercial and industrial facilities are charting a 23.4% CAGR because behind-the-meter storage trims demand charges that can top USD 20 kW in dense load pockets. EV-charging plaza buffering is an emerging micro-segment where flow batteries can absorb midday solar surplus and discharge during evening peaks without degradation penalties, potentially adding 400 MWh of demand annually by 2028.
Micro-grids and islands grow in double digits because fuel logistics dominate the total cost of ownership in remote areas. Residential nanogrids lag due to high installed costs, although iron-salt modules below EUR 5,000 per 10 kWh are testing European consumer appetite. Collectively, diverse use cases stabilize project pipelines and even out cyclical swings in utility procurement, deepening the installed base of the redox flow battery market.
By End-User: Corporates Close the Gap with Utilities
Power utilities and IPPs maintained 48.1% of revenue in 2025, leveraging capacity payments and frequency-regulation tariffs in high-renewable states. Commercial and industrial owners, including data-center operators and heavy manufacturers, are on track to outspend utilities before 2030 as net-zero supply agreements proliferate. The redox flow battery market share held by C&I end-users could rise to 42% by 2031, driven by eight-hour storage PPAs that replace gas peakers during evening ramps. Renewable project developers integrate flow batteries at the point of generation to lift capacity factors, avoiding curtailment penalties in markets with negative midday pricing.
Government and defense entities prioritize energy security in extreme environments such as Alaska, where ESS Inc. is delivering a 27 MWh array that survives - 40 °C. Academic and research installations remain small but influential, functioning as living laboratories that validate new revenue stacking algorithms.
Geography Analysis
Asia-Pacific held 45.9% of capacity in 2025 and is forecast to maintain a 19.3% CAGR through 2031, chiefly due to China's 12 GWh mandate for vanadium systems that decouple renewable volatility. Provincial subsidies of USD 0.04 - 0.07 kWh guarantee dispatch revenues, while domestic giants like Rongke Power are erecting an 800 MWh array in Hubei slated for 2026 completion. Japan and Australia are piloting iron flow chemistries to hedge critical-mineral exposure, signaling chemistry diversification across the region.
North America contributed a significant share of capacity in 2025, but with Section 45X tax credits in force until 2029, the region's share of the redox flow battery market size could climb to one-third by 2031. California alone procured 1.8 GW of long-duration storage in 2024, 40% of which favored flow chemistry for six-hour-plus services. Canadian provinces are evaluating flow systems to firm hydropower exports, while Mexico's utility CFE is reviewing tender guidelines for eight-hour storage near industrial corridors, illustrating expanding continental demand. Sumitomo Electric's 51-megawatt, 306-megawatt-hour California installation, operational in 2024, is the largest North American deployment, showcasing Japanese manufacturers' U.S. market share gains. Europe, with 18% of 2025 capacity, led by Germany and the UK, is advancing PFAS-free membrane technologies. The European Chemicals Agency's updated PFAS restriction dossier and final opinions drive investments by IONOMR, Fraunhofer IAP, and Cellfion, positioning European suppliers to meet regulatory-driven demand.
Germany's innovation auctions and the United Kingdom's Capacity Market both award duration bonuses that materially improve flow economics. Yet pending PFAS restrictions raise execution risk for legacy membrane suppliers, prompting OEMs to accelerate PFAS-free rollouts. Scandinavia and the Baltic states, vested in wind-plus-hydrogen hybrids, now include flow batteries in project pipelines to mitigate seasonal deficits.
Chile and Brazil are mapping policy frameworks that value long-duration storage as a transmission alternative, while South Africa's Eskom deployed a 12 MWh vanadium system to cut load shedding, demonstrating applicability in emerging grids. These regions could collectively account for 8 GWh of cumulative deployments by 2031 as solar LCOE parity spreads.

Competitive Landscape
The redox flow battery market is moderately concentrated; the top five players are Sumitomo Electric, Rongke Power, Invinity, ESS Inc., and VRB Energy. Vertical integration is a defining theme, with Storion Energy merging Largo’s mining assets and Stryten’s integration capability to offer sub-USD 85 kWh electrolyte leasing that undercuts third-party vendors by up to 60%. Chinese incumbents leverage cost advantages by co-locating membrane, stack, and electrolyte production, while Japanese suppliers differentiate through high-cycle warranties suited for utility applications.
Technology roadmaps show patent clusters in PFAS-free membranes and high-current bipoles. Ionomr and Fraunhofer IAP secured 2024 EU grants to commercialize hydrocarbon ionomers that comply with looming PFAS bans. ESS Inc.’s iron flow chemistry thrives in extreme cold, grabbing military and Arctic micro-grid contracts, whereas Invinity focuses on modular 2-4 MWh units that enable incremental capex for commercial sites. Fragmentation persists beneath the Tier-I cohort as regional integrators tailor systems for telecom, island, and mining micro-grids, but scale benefits favor large players.
Partnerships with renewable developers are rising. Sumitomo teamed with AES Andes in 2025 to explore a 100 MWh Chilean pilot, and Invinity aligned with Statkraft for a 20 MWh UK wind-firming project, signaling cross-border diffusion of flow technology. Collectively, these moves indicate a shift from standalone battery sales to turnkey storage-as-infrastructure offerings, deepening competitive moats while maintaining healthy rivalry that spurs innovation within the redox flow battery market.
Redox Flow Battery Industry Leaders
Sumitomo Electric Industries
Invinity Energy Systems
VRB Energy
ESS Inc.
Redflow Limited
- *Disclaimer: Major Players sorted in no particular order

Recent Industry Developments
- March 2026: ESS Inc. unveiled a 5 MW, 50 MWh iron flow project with Salt River Project in Arizona for delivery in Dec 2027, one of the largest U.S. iron flow contracts to date.
- June 2025: Europe’s largest flow battery project was launched to bolster energy security.
- May 2025: Switzerland approved constructing a 1.6 GWh flow battery facility, Europe’s biggest.
- May 2025: VFlowTech raised USD 21 million to back India’s clean-energy ambitions.


Global Redox Flow Battery Market Report Scope
A Redox Flow Battery (RFB) is a rechargeable electrochemical cell that stores energy in liquid electrolytes housed in external tanks. Unlike conventional batteries, such as lithium-ion batteries, which store energy in solid electrode materials, RFBs store energy in chemical compounds dissolved in a solvent. These compounds are circulated through a reactor to produce electricity.
The Redox Flow Battery Market is segmented into type, application, end-user, and geography. By type, the market is segmented into vanadium redox flow battery, zinc-bromine flow battery, iron flow battery, organic/hybrid flow battery, and other chemistries. By application, the market is segmented into utility-scale energy storage, micro-grids and islands, commercial and industrial facilities, residential nanogrids, EV-charging plaza buffering, and other applications. By end-user, the market is segmented into power utilities/IPPs, renewable project developers, commercial and industrial owners, government and defense, and research and academic institutions. The report also covers the market size and forecasts for the redox flow battery market across major regions, including North America, Europe, Asia-Pacific, South America, and the Middle East and Africa. For each segment, the market sizing and forecasts have been done on the basis of value (USD).
| Vanadium Redox Flow Battery (VRFB) |
| Zinc-Bromine Flow Battery |
| Iron Flow Battery |
| Organic/Hybrid Flow Battery |
| Other Chemistries (e.g., Fe/Cr, H2-Br2) |
| Utility-Scale Energy Storage (Above 10 MWh) |
| Micro-grids and Islands |
| Commercial and Industrial Facilities |
| Residential Nanogrids |
| EV-Charging Plaza Buffering |
| Other (Defense, Mining, Off-grid Telecom) |
| Power Utilities/IPPs |
| Renewable Project Developers |
| Commercial and Industrial Owners |
| Government and Defense |
| Research and Academic |
| North America | United States |
| Canada | |
| Mexico | |
| Europe | Germany |
| United Kingdom | |
| France | |
| Italy | |
| NORDIC Countries | |
| Russia | |
| Rest of Europe | |
| Asia Pacific | China |
| India | |
| Japan | |
| South Korea | |
| ASEAN Countries | |
| Rest of Asia Pacific | |
| South America | Brazil |
| Argentina | |
| Rest of South America | |
| Middle East and Africa | Saudi Arabia |
| United Arab Emirates | |
| South Africa | |
| Egypt | |
| Rest of Middle East and Africa |
| By Type | Vanadium Redox Flow Battery (VRFB) | |
| Zinc-Bromine Flow Battery | ||
| Iron Flow Battery | ||
| Organic/Hybrid Flow Battery | ||
| Other Chemistries (e.g., Fe/Cr, H2-Br2) | ||
| By Application | Utility-Scale Energy Storage (Above 10 MWh) | |
| Micro-grids and Islands | ||
| Commercial and Industrial Facilities | ||
| Residential Nanogrids | ||
| EV-Charging Plaza Buffering | ||
| Other (Defense, Mining, Off-grid Telecom) | ||
| By End-user | Power Utilities/IPPs | |
| Renewable Project Developers | ||
| Commercial and Industrial Owners | ||
| Government and Defense | ||
| Research and Academic | ||
| By Geography | North America | United States |
| Canada | ||
| Mexico | ||
| Europe | Germany | |
| United Kingdom | ||
| France | ||
| Italy | ||
| NORDIC Countries | ||
| Russia | ||
| Rest of Europe | ||
| Asia Pacific | China | |
| India | ||
| Japan | ||
| South Korea | ||
| ASEAN Countries | ||
| Rest of Asia Pacific | ||
| South America | Brazil | |
| Argentina | ||
| Rest of South America | ||
| Middle East and Africa | Saudi Arabia | |
| United Arab Emirates | ||
| South Africa | ||
| Egypt | ||
| Rest of Middle East and Africa | ||


Key Questions Answered in the Report
What is the projected value of the redox flow battery market in 2031?
It is expected to reach USD 4.96 billion by 2031, up from USD 2.17 billion in 2026.
Which chemistry is growing fastest within flow batteries?
Iron flow systems show the highest CAGR at 22.2% over 2026-2031.
How do electrolyte leasing models affect project economics?
Leasing can cut upfront capex 40-60% by shifting vanadium price risk to the lessor and recycling electrolyte across multiple life-cycles.
Why are commercial and industrial owners adopting flow batteries?
Demand-charge arbitrage and eight-hour storage PPAs help reduce peak electricity costs and meet carbon-free energy targets.
How will PFAS regulation influence future stack designs?
European and U.S. proposals could ban legacy membranes, steering manufacturers toward PFAS-free ionomers and modestly increasing near-term costs.
What tax incentives support U.S. flow battery manufacturing?
The Inflation Reduction Act Section 45X offers USD 35 kWh cell credits and 10% component bonuses through 2029, tapering thereafter.
Page last updated on:


