Market Overview
| Study Period | 2021 - 2031 |
|---|---|
| Market Size (2026) | USD 93.48 Billion |
| Market Size (2031) | USD 241.96 Billion |
| Growth Rate (2026 - 2031) | 20.95% CAGR |
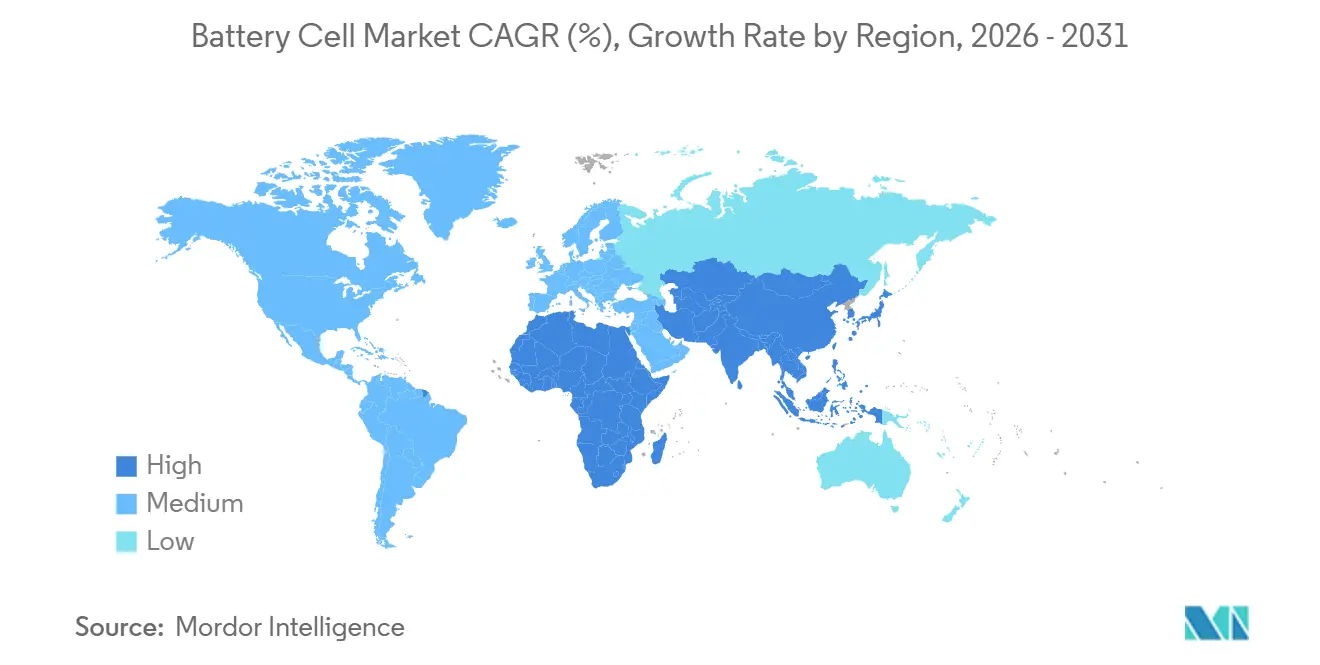
| Fastest Growing Market | Asia Pacific |
| Largest Market | Asia-Pacific |
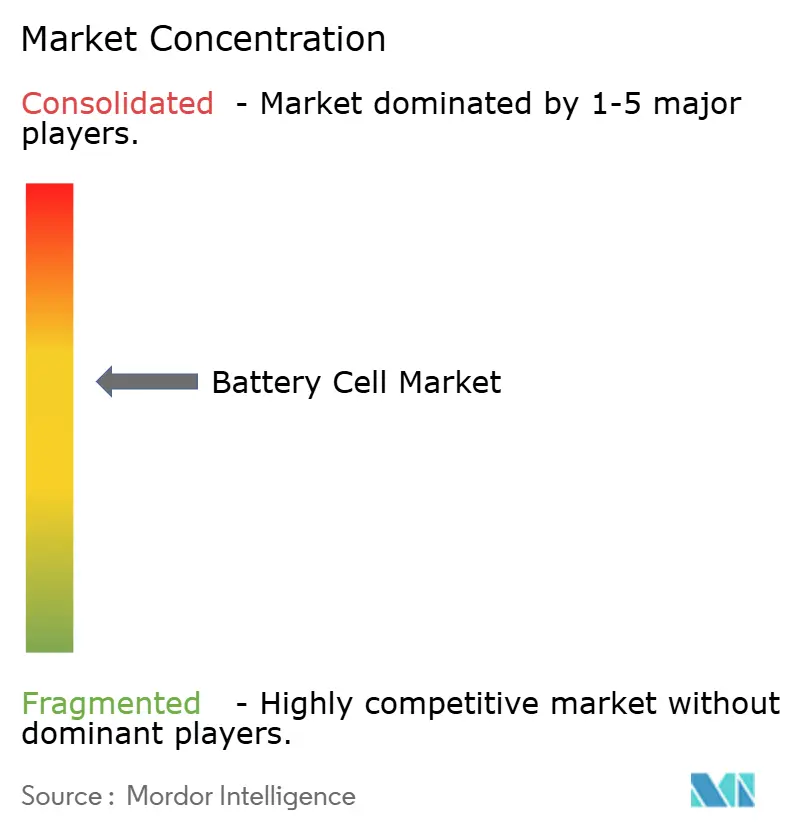
| Market Concentration | Medium |
Major Players *Disclaimer: Major Players sorted in no particular order Image © Mordor Intelligence. Reuse requires attribution under CC BY 4.0. | |
Battery Cell Market Analysis by Mordor Intelligence
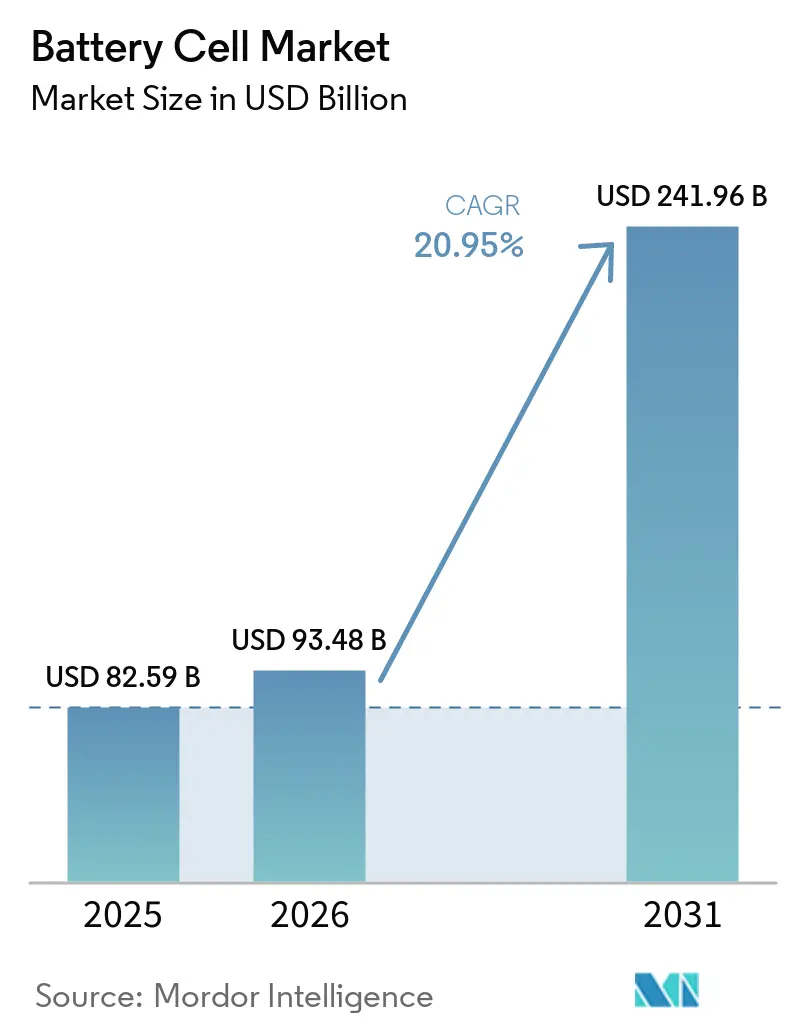
The Battery Cell Market size is projected to expand from USD 82.59 billion in 2025 and USD 93.48 billion in 2026 to USD 241.96 billion by 2031, registering a CAGR of 20.95% between 2026 to 2031.
Tightening vehicle-emissions rules, surging grid-scale storage build-outs, and rapid learning-curve cost declines are lifting demand across every major end-use. Automakers are standardizing 4680-class cylindrical formats for structural packs, while utilities favor lithium-iron-phosphate systems that deliver long cycle life at low cost. Regional gigafactory programs in China, the United States, and the European Union are accelerating capacity even as oversupply pressures prices, prompting dual-sourcing strategies to hedge policy and raw-material risks. The decoupling of Western and Chinese supply chains is also channeling capital toward solid-state and sodium-ion technologies that promise superior safety profiles and localized mineral inputs.
Key Report Takeaways
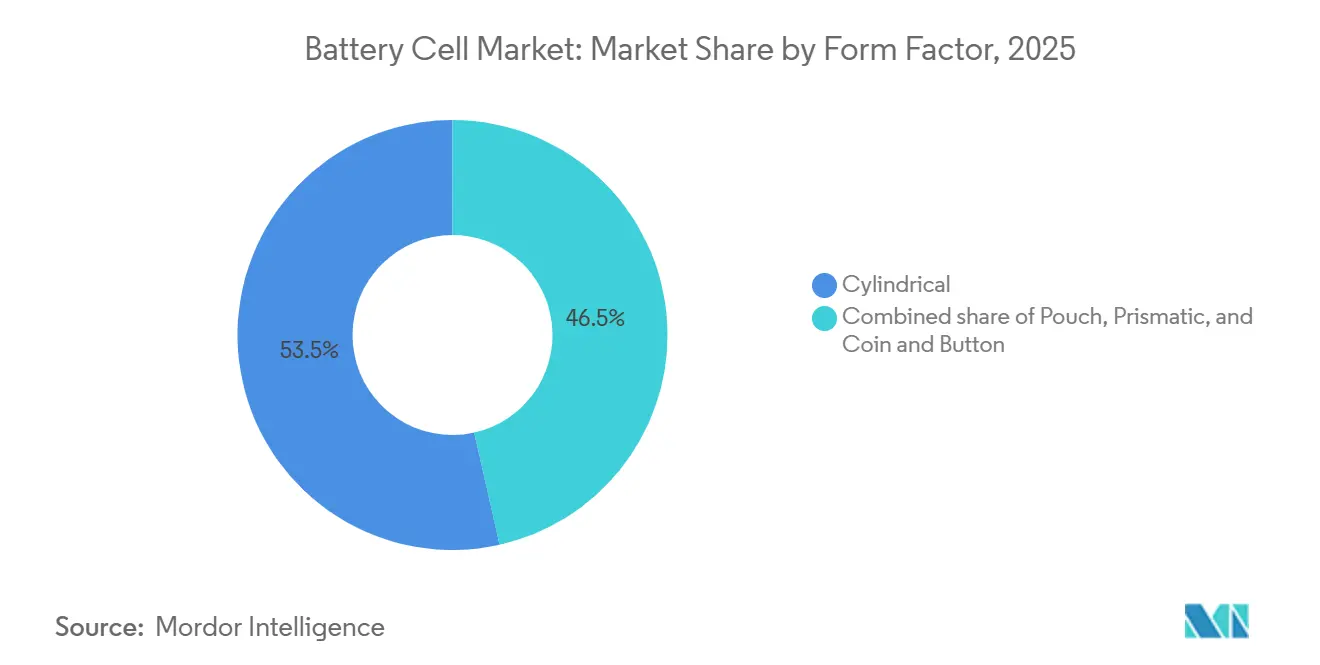
- By form factor, cylindrical cells led with 53.5% of battery cell market share in 2025; pouch cells are projected to expand at a 25.8% CAGR through 2031.
- By chemistry, nickel-manganese-cobalt accounted for 44.9% of battery cell market share in 2025; solid-state variants are set to deliver a 40.5% CAGR from 2026-2031.
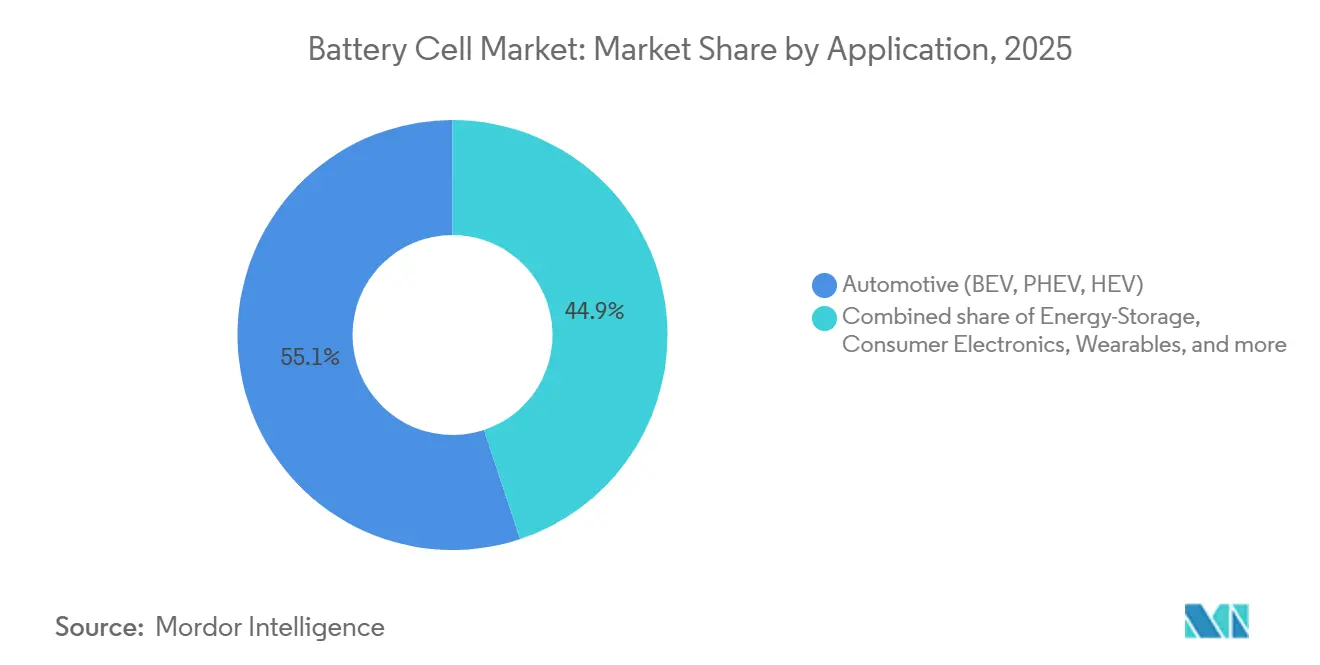
- By application, automotive held a 55.1% share of the battery cell market size in 2025, while energy-storage systems are advancing at a 29.4% CAGR to 2031.
- By geography, Asia-Pacific captured a 52.8% share in 2025 and is poised to grow at a 25.2% CAGR through 2031.
- CATL retained a 37% global share in 2024, underscoring its leadership even amid margin pressure from lithium-price swings.
Note: Market size and forecast figures in this report are generated using Mordor Intelligence’s proprietary estimation framework, updated with the latest available data and insights as of January 2026.
Global Battery Cell Market Trends and Insights
Drivers Impact Analysis*
| Driver | (~) % Impact on CAGR Forecast | Geographic Relevance | Impact Timeline |
|---|---|---|---|
| Surging EV production & government electrification mandates | 5.2% | Global, with peak impact in China, Europe, and North America; emerging influence in India and ASEAN | Medium term (2-4 years) |
| Utility-scale energy-storage demand growth | 4.8% | Global, with North America and China leading deployments; Europe accelerating under renewable mandates; early adoption in Australia | Medium term (2-4 years) |
| Declining $ / kWh from giga-scale production learning curves | 3.5% | Global, with China achieving lowest costs; North America and Europe benefiting from IRA and BRIS incentives | Long term (≥ 4 years) |
| Adoption of 4680-class cylindrical & large-format prismatic cells | 2.9% | North America (Tesla-led), China (CATL, BYD prismatic dominance), Europe (Northvolt, ACC adoption) | Medium term (2-4 years) |
| Gigafactory build-out accelerated by IRA & EU battery regulations | 4.1% | North America and Europe primary; spillover to ASEAN (Thailand, Indonesia, Vietnam) and India under PLI scheme | Short term (≤ 2 years) |
| Commercialization of sodium-ion cells for low-cost mobility & ESS | 2.3% | China-led (CATL, BYD); expanding to India, ASEAN, and cost-sensitive segments in Africa and Latin America | Long term (≥ 4 years) |
| Source: Mordor Intelligence | |||


Surging EV Production And Government Electrification Mandates
Global electric-vehicle output crossed 14 million units in 2024, and regulations in California, the EU, and China are compressing internal-combustion phase-outs to 2035 or earlier. The U.S. Inflation Reduction Act links a USD 7,500 consumer credit to battery-component sourcing from trade-agreement partners, steering cell procurement toward domestic or allied suppliers.[1]Treasury Department, “Inflation Reduction Act Guidance on Clean Vehicles,” home.treasury.gov Europe’s fleet-average CO₂ cap of 93.6 g/km for 2025 is forcing legacy brands to accelerate battery-electric launches even after Germany’s subsidy withdrawal caused a 27% drop in early-2024 plug-in registrations. China extended its purchase-tax exemption for new-energy vehicles through 2027, underpinning roughly half of global EV demand. Divergent incentives are bifurcating chemistries: Western OEMs favor high-nickel cells for long-range models, whereas China’s tier-2 cities adopt lithium-iron-phosphate packs priced under USD 80/kWh.
Utility-Scale Energy-Storage Demand Growth
Grid-scale battery capacity surpassed 50 GWh cumulatively in 2024 as renewable-penetration mandates and ancillary-service revenues lifted project economics. California’s Moss Landing site expanded to 3 GWh after a January 2024 thermal event, signaling operator confidence in enhanced safety protocols. The Long Duration Energy Storage Council foresees 1.5 TWh installed by 2040, a 30-fold jump that pivots chemistry design toward 10,000-cycle durability.[2]Long Duration Energy Storage Council, “Roadmap to Net-Zero,” ldesc.org ERCOT added 4 GW in 2024, monetizing peak-hour price spikes above USD 5,000/MWh and creating financeable cash flows without subsidies. Australia’s big-battery fleet now integrates renewables at penetration rates topping 60%, validating lithium-iron-phosphate dominance in stationary settings.
Declining $/kWh From Giga-Scale Production Learning Curves
Battery-pack prices fell below USD 100/kWh for lithium-iron-phosphate systems in 2024, making unsubsidized EVs cost-competitive on a total-cost-of-ownership basis.[3]Akshat Rathi, “Why Battery Prices Fell Below USD 100/kWh,” Bloomberg, bloomberg.com CATL’s Fuding plant hit USD 50/kWh cell costs through vertical cathode integration and high-speed coating lines. Panasonic’s Kansas facility reduced watt-hour-per-dollar by 15% versus legacy 2170 formats after ramping 4680 production. Samsung SDI and GM are targeting a 40% labor-content reduction per kWh at their Indiana JV by 2026. Meanwhile, lithium-carbonate spot prices slid to USD 10,000/ton in late 2024, erasing raw-material inflation and widening OEM cost-down headroom.
Adoption Of 4680-Class Cylindrical And Large-Format Prismatic Cells
Tesla’s Giga Texas reached a 4 GWh annual 4680 output in 2024, targeting 100 GWh by 2026 for Cybertruck and Semi structural packs. The 46×80 mm cell packs five times the energy of a 2170 unit and halves weld counts, trimming assembly expense by roughly 30%. LG Energy Solution’s Arizona line and BYD’s Blade battery illustrate parallel large-format strategies, cutting module housings and boosting volumetric utilization by up to 50%. The emerging standardization is lowering tooling risk for non-Tesla OEMs, encouraging multi-source procurement, and accelerating factory payback periods.
Restraints Impact Analysis*
| Restraint | (~) % Impact on CAGR Forecast | Geographic Relevance | Impact Timeline |
|---|---|---|---|
| Critical-mineral supply volatility & price spikes | -2.8% | Global, with acute pressure in lithium-dependent regions; China controls 60%+ of refining; supply constraints affecting North America and Europe | Short term (≤ 2 years) |
| Fire-safety incidents triggering tighter regulations | -1.9% | Global, with stringent responses in South Korea, United States, and Europe; China implementing GB standards; Australia and Japan revising ESS codes | Medium term (2-4 years) |
| Global over-capacity driving severe price competition | -3.2% | China-centric (70%+ global capacity); price pressure radiating to Europe and North America; utilization rates below 50% for tier-2 players | Short term (≤ 2 years) |
| EV-subsidy roll-off & policy uncertainty dampening demand | -2.4% | Europe (Germany, France subsidy reductions), China (NEV subsidy phase-out completed in 2022, extended purchase tax exemption), United States (IRA credit complexity) | Short term (≤ 2 years) |
| Source: Mordor Intelligence | |||
Critical-Mineral Supply Volatility And Price Spikes
Lithium-carbonate prices plunged 87% between late 2022 and late 2024, bankrupting marginal miners and delaying 300,000 t of planned capacity. Cobalt fell 40% in 2024, yet its 70% supply concentration in the Democratic Republic of Congo sustains geopolitical risk. Class-1 nickel premiums tightened as Indonesian laterite expansions added low-grade metal unsuited to battery cathodes. Ford’s 2024 deal to license CATL lithium-iron-phosphate cells for Michigan-built pickups highlights OEM pivoting away from nickel dependency despite a 15% energy-density hit. The split between high-nickel premium cars and iron-phosphate mass models is fragmenting cathode procurement and complicating hedging strategies.
Fire-Safety Incidents Triggering Tighter Regulations
South Korea recorded several ESS fires in 2024, including a Hwaseong blaze that killed 23 workers and prompted a nationwide audit of 35,000 containers. California’s 3 GWh Moss Landing site suffered a thermal event the same year, reinforcing the need for IEC 62619 and UL 9540A propagation tests, which now add 6-9 months to certification cycles and USD 0.50-1.00/kWh in extra cost. New York City mandated UL 2849 approval for all e-bike packs after more than 200 residential fires, raising unit costs by roughly 20% for micro-mobility operators.[4]New York City Fire Department, “Lithium-Ion Battery Safety Update 2024,” nyc.gov Insurers lifted premiums 30-50% for sites lacking gas-suppression or thermal-barrier walls, expenses that developers must pass through to offtakers via higher capacity payments.
*Our forecasts treat driver/restraint impacts as directional, not additive. The impact forecasts reflect baseline growth, mix effects, and variable interactions.
Segment Analysis
By Form Factor: Structural Integration Drives Pouch Surge
Cylindrical cells dominated the battery cell market with a 53.5% share in 2025, propelled by entrenched 18650/2170 lines and Tesla’s 4680 ramp, while pouch formats are forecast to register a 25.8% CAGR to 2031 as automakers adopt module-less pack designs. The battery cell market size for pouch designs is set to more than triple by 2031 as cell-to-chassis architectures boost volumetric efficiency and shave vehicle curb weight.
The structural benefits are underscored by BYD’s Blade battery, which is integrated directly into the chassis of the 2024 Seal sedan, achieving a 600 km range with 20% less pack capacity than cylindrical equivalents. European OEMs are following suit; Volkswagen’s unified-cell plan originally banked on Northvolt’s large pouch roadmap, although the supplier’s 2024 bankruptcy has deferred European commercialization by at least 18 months. Durability concerns persist: flexible aluminum-laminate casings can swell under high-cycle duty, limiting adoption for commercial fleets that demand 3,000-plus cycles. Regulatory requirements for easy disassembly under the EU Battery Regulation could also temper pouch uptake in Europe post-2027, preserving a role for cylindrical and prismatic formats.


By Chemistry: Solid-State Transition Accelerates From Low Base
Nickel-manganese-cobalt retained 44.9% battery cell market share in 2025, supplying premium EV ranges above 400 miles, yet solid-state chemistries are projected to grow at a 40.5% CAGR through 2031 from a modest baseline. QuantumScape’s 15-layer separator delivered 800 Wh/L density in 2024 trials, drawing Volkswagen funding toward an 85 GWh plant slated for 2028 startup.
Lithium-iron-phosphate surpassed 50% of China’s passenger-EV installs in 2024, anchored by USD 70/kWh pack economics and intrinsic thermal stability. Sodium-ion production began the same year at BYD’s 30 GWh Jiangsu facility, targeting scooters, e-bikes, and stationary storage, where 20% lower energy density is offset by 30% cheaper material cost. The capital hurdle for solid-state lines, roughly USD 500 million/GWh, limits participation to vertically integrated majors or well-financed startups, reinforcing a two-tier market structure. Nevertheless, the EU Battery Regulation’s carbon-footprint ceilings favor solid-state options that eliminate flammable solvents and cut manufacturing energy by up to 30%, offering a compliance premium beyond 2028.
By Application: Energy Storage Outpaces Automotive Growth
Automotive accounted for 55.1% of the battery cell market size in 2025, equating to more than 600 GWh of cell demand, yet grid-storage installations are forecast to expand at a 29.4% CAGR to 2031, eclipsing vehicle growth. California, Texas, and South Australia already rely on batteries for frequency regulation and peak-shift services as renewable penetration exceeds 50%.
Consumer electronics contributed roughly 12% of revenue in 2025, but unit growth is flattening as smartphone capacities plateau near 5,000 mAh. Power-tool demand remains steady at about 8% share, supplied primarily by 18650 and 21700 cylindrical cells that offer 1,000-cycle durability. Starting-lighting-ignition batteries and micro-mobility added a combined 7% share; the latter is confronting stricter safety certification after e-bike fire incidents in New York City, raising compliance costs 20% and weeding out unbranded imports.
Geography Analysis
Asia-Pacific maintained a commanding 52.8% share of the battery cell market in 2025 and is expected to post a 25.2% CAGR through 2031 as China sustains 75% of global manufacturing capacity and Southeast Asia scales nickel and cathode refining. CATL’s 120 GWh Fuding site exemplifies the region’s scale advantage, while its 100 GWh Hungary project enables tariff-free European access under local-content rules.
North America’s capacity pipeline exceeds 100 GWh between 2024-2026, led by LG-Honda, Samsung-Stellantis, and Panasonic expansions that unlock USD 35/kWh Advanced Manufacturing Production Credits. Europe has announced more than 1 TWh of prospective plants, but Northvolt’s Chapter 11 filing and ACC’s delays at Douvrin highlight execution risk for green-field entrants without vertically integrated supply chains.
South America presently holds under 3% share, focusing on lithium extraction rather than cell output, while the Middle East and Africa remain early-stage demand centers limited by grid constraints and financing hurdles. Japan and South Korea are pivoting from export-only models toward regional production to satisfy U.S. IRA domestic-content thresholds and mitigate rising freight costs.

Competitive Landscape
Industry concentration is moderate: the top five players, CATL, LG Energy Solution, BYD, Panasonic Energy, and Samsung SDI, controlled roughly 65% of global capacity in 2024. CATL’s 37% lead stems from cradle-to-gate integration spanning mineral refining to pack assembly, granting a cost base smaller rivals struggle to match. 2024 saw LG and Samsung secure USD 8 billion and USD 6 billion, respectively, in North American joint ventures, while CATL licensed lithium-iron-phosphate know-how to Ford for a Michigan plant, signaling a shift toward equity-linked supply structures.
Technology differentiation hinges on cell-to-pack construction, dry-electrode coating, and high-silicon anodes; BYD’s Blade and Tesla’s 4680 formats fetch 10-15% pricing premiums over commodity cells. CATL led 2024 patent filings at 1,847 versus LG’s 1,203 and Samsung’s 987, underscoring an IP arms race that is lifting entry barriers for emergent firms. Consolidation is likely to push the top five toward a 75% share by 2027 as over-leveraged second-tier Chinese makers exit or merge under price pressure.
White-space opportunities persist: QuantumScape, Solid Power, and ProLogium attracted USD 2 billion in 2024 for solid-state pilot lines, albeit without gigawatt-hour commercial output yet. Sodium-ion cells, spearheaded by BYD and CATL, promise cost relief for stationary storage and low-speed mobility in emerging markets. Regulatory carbon-footprint ceilings and recycled-content mandates in Europe are steering procurement to players with auditable upstream chains, reshaping competitive dynamics beyond cost alone.
Battery Cell Industry Leaders
CATL
BYD (FinDreams)
LG Energy Solution
Panasonic Energy
Samsung SDI
- *Disclaimer: Major Players sorted in no particular order

Recent Industry Developments
- May 2026: Ola Electric announced a USD 235 million investment in its electric vehicle (EV) and battery cell manufacturing subsidiaries. This initiative aims to enhance localization and vertical integration within India’s electric mobility ecosystem.
- March 2026: Tesla disclosed an additional investment of approximately USD 250 million to expand battery cell production at its Grünheide Gigafactory near Berlin. The company increased its planned annual battery production capacity from 8 GWh to 18 GWh and projected the creation of over 1,500 jobs related to battery cell manufacturing.
- February 2026: ProLogium Technology commenced construction of its first European solid-state battery gigafactory in Dunkirk, France. The facility is set to produce fourth-generation lithium ceramic solid-state battery cells for electric vehicle applications.
- January 2025: Waaree Energy Storage Solutions Private Limited (WESSPL) secured around INR 1,003 crore in a significant funding round. This capital injection bolsters WESSPL's earlier announcement of a capital expenditure (Capex) nearing INR 10,000 crore (~USD 1.2 billion) dedicated to setting up a cutting-edge 20 GWh facility for advanced lithium-ion cell and battery pack production.


Global Battery Cell Market Report Scope
A battery can be defined as an electrochemical device (consisting of one or more electrochemical cells) that can be charged with an electric current and discharged whenever required. Batteries are usually devices made up of multiple electrochemical cells connected to external inputs and outputs.
The Battery Cell Market Report is segmented by form factor, chemistry, application, and geography. By form factor, the market is segmented into prismatic, cylindrical, pouch, and coin and button. By chemistry, the market is segmented into Li-ion NMC, Li-ion LFP, Li-ion NCA, Li-ion LMO/LCO, solid-state, and sodium-ion. By application, the market is segmented into automotive, energy-storage, consumer electronics, power tools, and SLI and micro-mobility. The report also covers the market size and forecasts across major regions. For each segment, the market sizing and forecasts have been done based on revenue (USD billion).
By Form Factor
| Prismatic |
| Cylindrical |
| Pouch |
| Coin and Button |
By Chemistry
| Li-ion NMC |
| Li-ion LFP |
| Li-ion NCA |
| Li-ion LMO/LCO |
| Solid-state (Semi- and All-solid) |
| Sodium-ion and Other Emerging |
By Application
| Automotive (BEV, PHEV, HEV) |
| Energy-Storage (Utility, C&I, Residential) |
| Consumer Electronics and Wearables |
| Power Tools and Gardening Equipment |
| SLI and Micro-mobility (e-bikes, scooters) |
By Geography
| North America | United States |
| Canada | |
| Mexico | |
| Europe | United Kingdom |
| Germany | |
| France | |
| Spain | |
| NORDIC Countries | |
| Russia | |
| Rest of Europe | |
| Asia-Pacific | China |
| India | |
| Japan | |
| South Korea | |
| ASEAN Countries | |
| Australia and New Zealand | |
| Rest of Asia-Pacific | |
| South America | Brazil |
| Argentina | |
| Colombia | |
| Rest of South America | |
| Middle East and Africa | Saudi Arabia |
| United Arab Emirates | |
| South Africa | |
| Egypt | |
| Rest of Middle East and Africa |
| By Form Factor | Prismatic | |
| Cylindrical | ||
| Pouch | ||
| Coin and Button | ||
| By Chemistry | Li-ion NMC | |
| Li-ion LFP | ||
| Li-ion NCA | ||
| Li-ion LMO/LCO | ||
| Solid-state (Semi- and All-solid) | ||
| Sodium-ion and Other Emerging | ||
| By Application | Automotive (BEV, PHEV, HEV) | |
| Energy-Storage (Utility, C&I, Residential) | ||
| Consumer Electronics and Wearables | ||
| Power Tools and Gardening Equipment | ||
| SLI and Micro-mobility (e-bikes, scooters) | ||
| By Geography | North America | United States |
| Canada | ||
| Mexico | ||
| Europe | United Kingdom | |
| Germany | ||
| France | ||
| Spain | ||
| NORDIC Countries | ||
| Russia | ||
| Rest of Europe | ||
| Asia-Pacific | China | |
| India | ||
| Japan | ||
| South Korea | ||
| ASEAN Countries | ||
| Australia and New Zealand | ||
| Rest of Asia-Pacific | ||
| South America | Brazil | |
| Argentina | ||
| Colombia | ||
| Rest of South America | ||
| Middle East and Africa | Saudi Arabia | |
| United Arab Emirates | ||
| South Africa | ||
| Egypt | ||
| Rest of Middle East and Africa | ||


Key Questions Answered in the Report
What is the current value of the global battery cell market?
The battery cell market size reached USD 93.48 billion in 2026 and is forecast to grow to USD 241.96 billion by 2031.
Which region leads manufacturing capacity for battery cells?
Asia-Pacific commands 52.8% of 2025 revenue and hosts about 75% of global factory capacity, led by China.
How fast are grid-scale batteries growing compared with automotive demand?
Energy-storage systems are expected to log a 29.4% CAGR during 2026-2031, outpacing automotive's mid-teens growth rate.
Who are the top players in battery cells today?
CATL, LG Energy Solution, BYD, Panasonic Energy, and Samsung SDI together hold roughly 65% of worldwide capacity.
Which chemistries are gaining the most ground?
Solid-state cells show the highest forecast CAGR at 40.5%, while sodium-ion is emerging for low-cost mobility and storage.
What policy is driving U.S. gigafactory investments?
The Inflation Reduction Act offers a USD 35/kWh production credit and consumer incentives tied to domestic battery content.
Page last updated on:


