Vanadium Redox Flow Battery (VRFB) Market Size and Share
Market Overview
| Study Period | 2021 - 2031 |
|---|---|
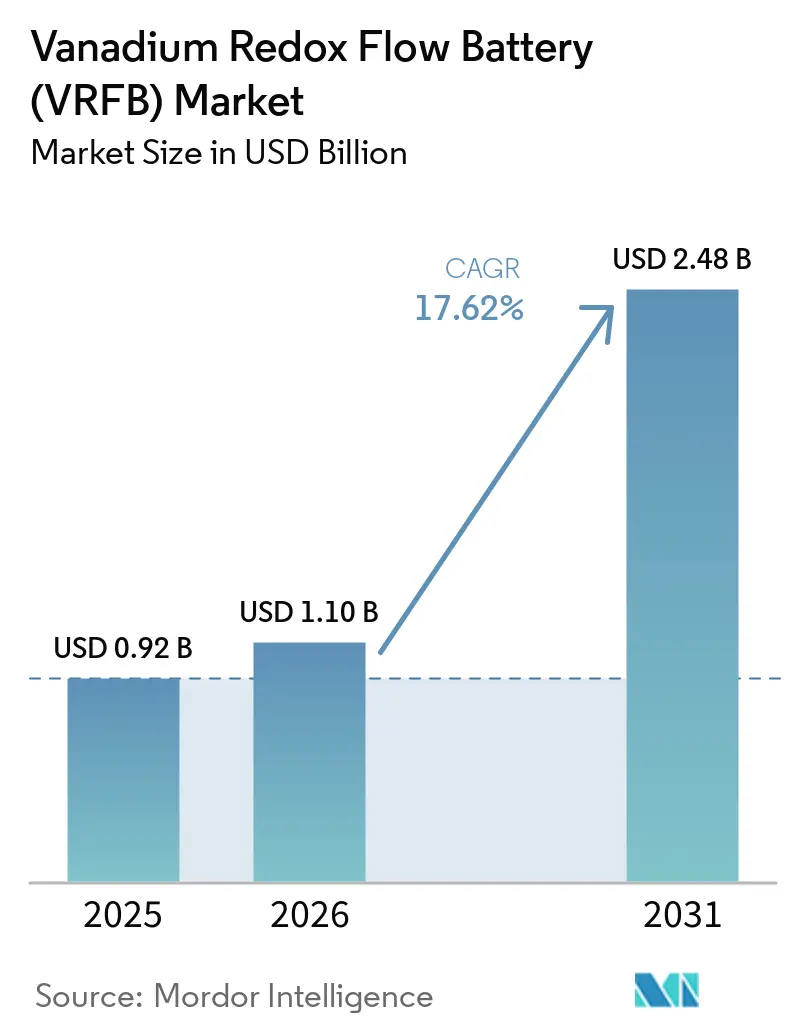
| Market Size (2026) | USD 1.10 Billion |
| Market Size (2031) | USD 2.48 Billion |
| Growth Rate (2026 - 2031) | 17.62% CAGR |
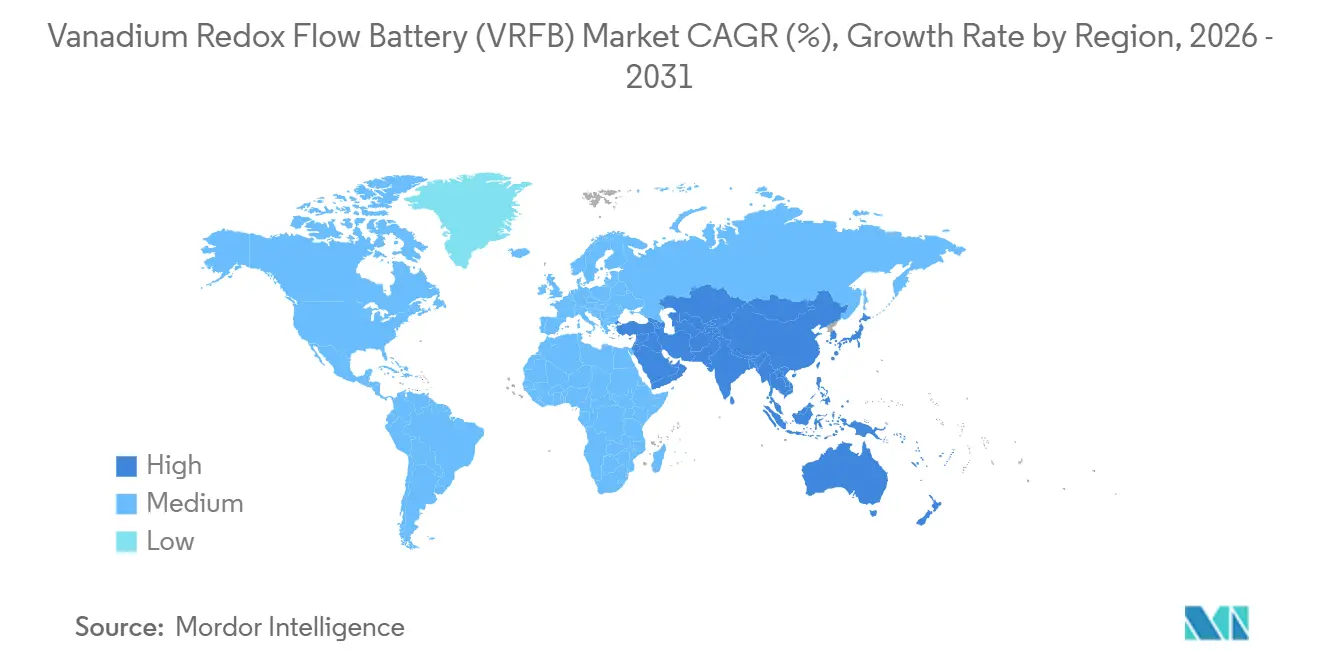
| Fastest Growing Market | North America |
| Largest Market | Asia Pacific |
| Market Concentration | Medium |
Major Players
*Disclaimer: Major Players sorted in no particular order Image © Mordor Intelligence. Reuse requires attribution under CC BY 4.0. |
|
Vanadium Redox Flow Battery (VRFB) Market Analysis by Mordor Intelligence
The Vanadium Redox Flow Battery Market size is projected to expand from USD 0.92 billion in 2025 and USD 1.10 billion in 2026 to USD 2.48 billion by 2031, registering a CAGR of 17.62% between 2026 to 2031.
Growth rests on a structural shift in grid-scale storage from rapid-discharge lithium systems toward technologies that can deliver energy for four hours and beyond, giving utilities a hedge against renewable intermittency. China validated this pivot with two record-setting plants, 175 MW/700 MWh at Wushi and 200 MW/1 GWh at Jimsar, both of which reached commercial operation and demonstrated that flow batteries now meet lender bankability thresholds for multi-hundred-megawatt-hour assets. Electrolyte leasing, first applied at a 6 MW/24 MWh site in South Africa and now replicated in the United Kingdom and China, removes vanadium price exposure from project balance sheets and cuts initial capital requirements by 25-30%. Membrane innovations from Pacific Northwest National Laboratory, coupled with polybenzimidazole designs from Shenzhen ZH Energy, raise energy density by 70% and trim component cost curves, supporting broader adoption in distributed applications.
Key Report Takeaways
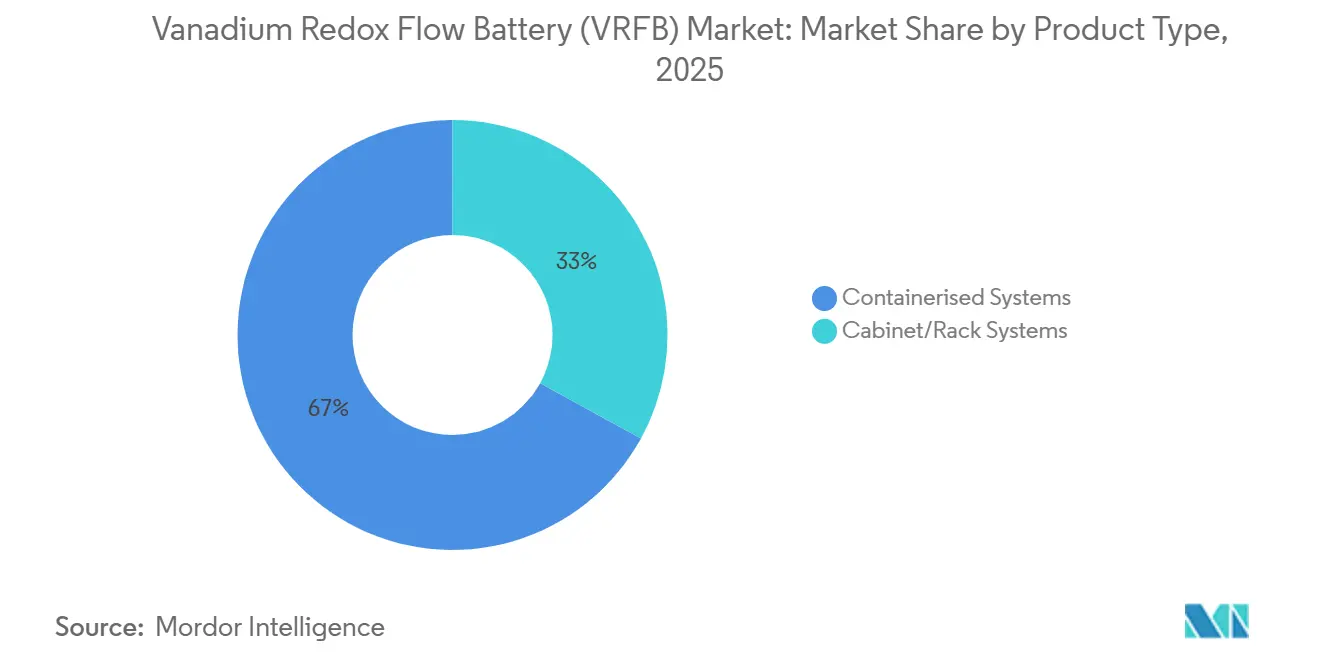
- By product type, containerised systems led with 67.0% revenue in 2025; cabinet and rack units are projected to expand at a 21.1% CAGR to 2031.
- By component, electrolytes represented 43.3% of 2025 component sales, while membranes are on track for an 18.4% CAGR through 2031.
- By power rating type, 501 kW–5 MW segment systems captured a 52.2% share of the vanadium redox flow battery market size in 2025; sub-100 kW units are projected to grow at a 19.3% CAGR.
- By system size type, installations above 10 MWh controlled 63.9% of the vanadium redox flow battery market share in 2025; however, sub-1 MWh projects registered the fastest growth rate of 20% CAGR.
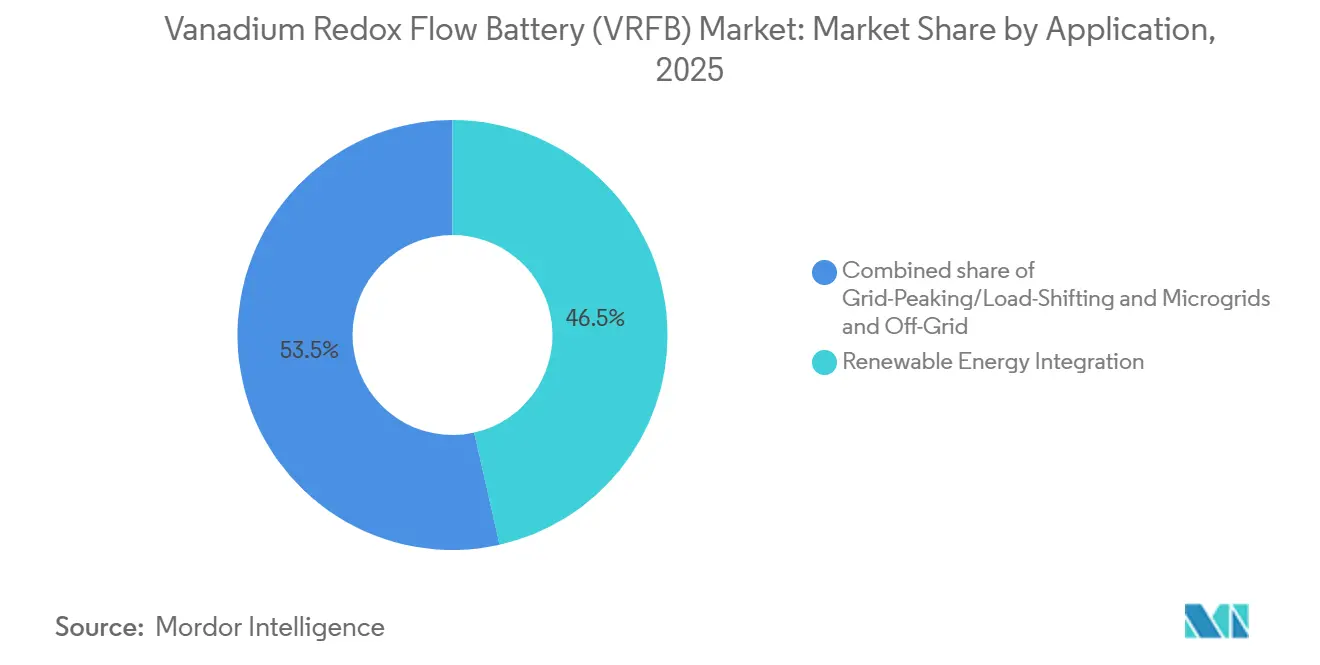
- By application, the renewable energy integration segment accounted for 46.5% of the 2025 market share, and the microgrids and off-grid segment is projected to register a CAGR of 18.8% through 2031.
- By end-user type, the utility segment accounted for 64.8% of the 2025 revenue; C&I demand is expanding at a 20.9% CAGR.
- By geography, the Asia-Pacific region dominated the market with a share of 48.7% in 2025, and North America is poised to grow the fastest during the forecast period, with a CAGR of 22.5%.
Note: Market size and forecast figures in this report are generated using Mordor Intelligence’s proprietary estimation framework, updated with the latest available data and insights as of January 2026.
Global Vanadium Redox Flow Battery (VRFB) Market Trends and Insights
Drivers Impact Analysis*
| Driver | (~) % Impact on CAGR Forecast | Geographic Relevance | Impact Timeline |
|---|---|---|---|
| Rapid build-out of >4 h grid-storage projects in China & U.S. | 3.8% | China, United States, with spillover to India and Australia | Medium term (2-4 years) |
| Vanadium electrolyte leasing models lowering CapEx in Europe | 2.9% | Europe (UK, Germany, Spain), expanding to South Africa and ASEAN | Short term (≤ 2 years) |
| Surging demand for long-duration storage to firm solar in MENA | 3.2% | Middle East (UAE, Saudi Arabia, Egypt), North Africa | Long term (≥ 4 years) |
| Technology breakthroughs in membrane and electrolyte efficiency | 2.7% | Global, with early adoption in Japan, United States, Germany | Medium term (2-4 years) |
| Source: Mordor Intelligence | |||
Rapid Build-Out of above 4 h Grid-Storage Projects in China & U.S.
China’s State Grid connected 375 MW/1.5 GWh of flow storage between 2024 and 2025, anchored by the 200 MW/1 GWh Jimsar array that stabilizes wind output along the Hami corridor.[1]State Grid Corporation of China, “Storage Build-Out Statistics 2024-2025,” sgcc.com.cn In the United States, only 3% of 2025 battery additions exceed four-hour duration, leaving a gap that California’s 1 GW long-duration mandate and the federal 30% standalone storage tax credit are designed to close. Sumitomo Electric’s 4 MW/16 MWh project with San Diego Gas & Electric logged round-trip efficiencies above 68% over seven years, confirming sub-0.5% annual capacity fade even under daily cycling. Because grid operators demand 15-year warranties, this longevity offers a decisive edge over lithium systems that require costly augmentation after year seven. The new tax credit lowers required project IRRs from 12% to roughly 8%, bringing financial returns in line with utility-scale solar and accelerating procurement pipelines in Texas and Arizona.
Vanadium Electrolyte Leasing Models Lowering CapEx in Europe
Bushveld Energy’s South African pilot proved that separating electrolyte ownership from system hardware cuts upfront capital by 28% and secures debt at 4.2%, versus 6.5% for traditional structures. Invinity replicated the construct at its 7 MW/30 MWh Oxford project, using a Glencore-backed fund to cover electrolyte and thereby meet European Investment Bank coverage ratios that flow projects had previously missed. Municipal utilities in Panzhihua adopted the same approach for 50 MW in 2024 without breaching provincial debt ceilings. A secondary market for spent electrolyte is emerging, because vanadium retains 95% residual value after two decades, creating a circular-economy incentive that appeals to ESG-focused funds.
Surging Demand for Long-Duration Storage to Firm Solar in MENA
Saudi Arabia’s Vision 2030 target of 50% renewable electricity demands 6–8 hours of evening storage, where flow batteries undercut lithium by 15-20% on levelized cost. NEOM’s hydrogen and desalination clusters add a premium for non-flammable chemistries that tolerate desert temperatures without active cooling, a criterion that VRFBs meet thanks to their aqueous electrolytes. Dubai’s utility issued a 300 MW/2.4 GWh tender in 2025 that explicitly favors flow technologies for ambient temperatures above 45 °C. Egypt’s 10 GW solar build experiences curtailment rates of 12%, and limited pumped-hydro sites elevate chemical storage to critical-path status, making VRFBs a strong contender for long-duration awards. Aramco’s 1 MWh hybrid iron-vanadium pilot underscores how energy majors view multi-hour storage as core infrastructure rather than a niche add-on.
Technology Breakthroughs in Membrane and Electrolyte Efficiency
Pacific Northwest National Laboratory’s pure sulfate electrolyte supports 2.2 M vanadium concentrations and boosts volumetric energy density 70%, cutting tank volumes by 40% for the same capacity. Shenzhen ZH Energy commercialized non-fluorinated polybenzimidazole membranes at USD 180 per m² that keep vanadium crossover below 0.02 mA cm-2, tripling rebalancing intervals to 18 months. Fraunhofer’s scale-up to 100,000 m²/year production drove membrane prices down 35% between 2023 and 2025, making VRFBs cost-competitive with zinc-bromine units in the 100-500 kW range. The EU-funded HyFlow demonstrator married supercapacitors with a 300 kW VRFB, attaining 82% round-trip efficiency and creating a revenue stack that now captures primary frequency control in Germany. These advances collectively shave system capex and open rooftop and indoor niches previously blocked by footprint limits.
Restraints Impact Analysis*
| Restraint | (~) % Impact on CAGR Forecast | Geographic Relevance | Impact Timeline |
|---|---|---|---|
| Vanadium price volatility tied to steel demand | -1.9% | Global, with acute exposure in China (60% of supply), Russia, South Africa | Short term (≤ 2 years) |
| Lack of bankability standards for VRFB projects | -1.6% | North America, Europe, with emerging impact in India and ASEAN | Medium term (2-4 years) |
|
Competition
from |
-1.2% | Global, concentrated in North America, Europe, Australia | Short term (≤ 2 years) |
| Source: Mordor Intelligence | |||
Vanadium Price Volatility Tied to Steel Demand
Vanadium pentoxide prices fell from USD 9/lb in 2022 to USD 4-5/lb in 2024 as Chinese rebar production slid 8%, squeezing vertically integrated suppliers such as Largo Clean Energy, which hedged 60% of its forward exposure through 2026.[2]Argus Media, “V2O5 Price Data Q4 2024,” argusmedia.com European ferrovanadium settled near EUR 30/kg in 2024, 40% below 2022 peaks, yet futures remain in contango, signaling trader expectations of supply tightness once China’s stimulus revives construction demand. Export quotas imposed by Beijing in 2023 created six-week delivery delays that forced Invinity to pre-purchase 18 months of electrolyte inventory. Leasing structures absorb some volatility, but lessors ultimately pass costs through when spot vanadium exceeds contracted collars, leaving end-users partially exposed.
Lack of Bankability Standards for VRFB Projects
UL 9540 covers fire safety yet omits performance degradation metrics, compelling lenders to request bespoke guarantees that add 12–18 months to financial close and raise debt pricing by 75 basis points.[3]UL Solutions, “UL 9540 Standard Scope,” ul.com IEC 62932 parts on performance and recycling remain in committee draft, creating uncertainty that pushes independent engineers to haircut vendor life-cycle claims by 30%. CellCube’s Rel 4.2 boasts 20,000 cycles and a 30-year design life, but the lack of third-party validation keeps its weighted cost of capital near 8.5%, versus 6% for lithium systems with mature test data. The U.S. Long-Duration Storage Shot earmarked USD 505 million to create certified testing centers, yet the first facility will not open before 2027, leaving smaller developers to navigate protracted diligence timelines that erode project pipelines.
*Our forecasts treat driver/restraint impacts as directional, not additive. The impact forecasts reflect baseline growth, mix effects, and variable interactions.
Segment Analysis
By Product Type: Containerised Dominance Meets Modular Disruption
Containerised units commanded 67.0% of 2025 revenue, underscoring utility appetite for turnkey 40-foot modules that integrate power conversion and fire suppression. The vanadium redox flow battery market size for containerised systems reached USD 740 million in 2025 and is projected to expand in line with multi-gigawatt procurement programs in China and the United States. Jimsar’s 200 MW/1 GWh build used 250 identical containers, enabling phased commissioning that brought early revenue online while later strings completed factory acceptance tests. Cabinet and rack formats address space-constrained sites and will grow at a 21.1% CAGR through 2031, supported by Vanevo’s gravity-fed 10 kW/40 kWh design that removes external pumps and trims maintenance by 35%.[4]Vanevo GmbH, “Gravity-Fed VRFB Cabinet Datasheet,” vanevo.de The shift mirrors grid-edge trends in telecom and data centers, but economies of scale in power electronics will keep containerised offerings dominant for mega-projects.
Container mobility unlocks EPC efficiencies, modules arrive factory-tested and require minimal on-site labor, while the ability to stack them two-high reduces land use to 15 m² MWh-¹. In contrast, cabinets slot into 19-inch racks and fit behind standard switchgear, appealing to commercial and industrial retrofits. Redflow’s hot-swappable 200 kWh pods illustrate how modularity shortens downtime to two hours, a metric valued by data centers at USD 50,000 per avoided outage hour. Over the forecast, containerised shipments will still account for more than 60% of capacity, but high-volume cabinet sales lift modular solutions to almost one-third of delivered units by 2031. The vanadium redox flow battery market will therefore display a two-track dynamic: bulk storage for utilities and flexible form factors for distributed customers.


By Component: Electrolyte Economics Drive Leasing Innovation
Electrolyte generated 43.3% of component revenue in 2025, reflecting vanadium’s 35-40% cost share and the value locked in secondary reuse. High-purity VPURE+ formulations demand a premium yet extend rebalancing intervals by 12 months, lowering O&M by USD 8,000 MWh-¹ yr-¹. Membranes will post an 18.4% CAGR to 2031 as low-cost PBI and PFSA options widen gross-margin headroom even when vanadium prices rebound. The vanadium redox flow battery market share of electrolyte is projected to fall to 38% by 2031 as stack and membrane costs compress faster, but electrolyte will grow in strategic importance because leasing converts a capital line item into a predictable service fee.
Stack cost trajectories are equally aggressive: automated carbon-felt and stamped bipolar plates in Dalian plants drove unit prices to USD 150 kW-¹ by 2025, down 45% from 2022, making stacks the next focus for margin pressure. Pacific Northwest National Laboratory’s higher-density electrolyte permits a 40% reduction in tank volume, shrinking balance-of-plant expenses for rooftop and shipping-container footprints. Together, falling membrane and stack costs ease total system capex and strengthen the case for service-based business models that decouple commodity volatility from project cash flows.
By Power Rating: Mid-Scale Installations Anchor Utility Procurement
Systems rated 501 kW–5 MW held 52.2% 2025 share, aligning with feeders and substations typically upgraded for renewable firming. Sumitomo Electric’s 2 MW/8 MWh Kumamoto site became Japan’s first flow battery to win Ministry of Economy, Trade and Industry funding, validating national policy support for this class size. Sub-100 kW units will record a 19.3% CAGR as telecom operators replace diesel gensets with four-hour cabinets, led by Redflow’s Energy Pod deployments in Australia and Indonesia.
The 100-500 kW bracket answers microgrid needs where partial-state-of-charge cycling would degrade lithium performance. H2 Inc.’s 1.1 MW/8.8 MWh Spain plant demonstrates dual-mode operation, 250 kW baseload and 500 kW peak, inside a single enclosure. Power-rating distribution is expected to stay balanced through 2031, with utilities standardizing on 1-5 MW blocks for interconnection simplicity and C&I buyers preferring sub-500 kW modules that integrate with existing switchgear.

By System Size: Utility-Scale Projects Dominate, Yet Small Systems Surge
Installations above 10 MWh commanded 63.9% of 2025 revenue, buoyed by China’s multi-hundred-megawatt-hour contracts. The Wushi 700 MWh site curbed wind curtailment by 15% and saved the grid operator USD 22 million annually in lost generation, underscoring scale economics at the provincial level. Systems below 1 MWh will rise at a 20% CAGR to 2031 as microgrids proliferate in Southeast Asia and sub-Saharan Africa, aided by Sumitomo’s 250 kW/1.125 MWh Minamikyushu community array that met industrial-estate resilience goals at USD 650 kWh-¹ when electrolyte leasing was applied. Medium-sized 1-10 MWh plants, such as Invinity’s 2.5 MW/10 MWh Mississippi build, deliver both demand-charge savings and frequency-regulation income, closing payback in just over six years.
By Application: Renewable Firming Leads, Microgrids Accelerate
Renewable integration contributed 46.5% of 2025 revenue, driven by California’s rule that solar projects above 1 MW pair with four-hour storage, a policy that flow batteries satisfy cost-effectively once cycle life exceeds 20,000. Microgrid and off-grid deployments will post an 18.8% CAGR, with Saudi Aramco’s 1 MWh pilot showing capex parity against diesel when ambient temperatures top 48 °C. Grid-peaking assets, roughly 35% of total, now offset evening ramps in Japan, where Sumitomo’s Kumamoto plant deferred USD 40 million of transmission upgrades. Market bifurcation will persist: the vanadium redox flow battery market captures 60% of >6-hour needs but only 15% below four hours, where lithium retains the price lead.
By End-User: Utilities Command Share, C&I Growth Accelerates
Utilities delivered 64.8% of demand in 2025, powered by China’s USD 3.2 billion storage budget that earmarked 40% for flow chemistries. Commercial-and-industrial buyers will grow at 20.9% CAGR as electrolyte leasing and frequency-regulation revenues shorten paybacks, illustrated by C Spire’s Mississippi data center that recouped investment in 6.2 years. Residential adoption lags below 2% because the minimum economic size remains 10 kWh, and installed costs still exceed rooftop-solar thresholds in most regions.
Geography Analysis
Asia-Pacific generated 48.7% of 2025 revenue as China pursued a 30 GW storage target and commissioned both Wushi and Jimsar, which now represent 40% of global VRFB capacity. Japan green-lit its first VRFB subsidy for the 8 MWh Kumamoto site, reflecting policy alignment as solar penetration crosses 12% of national generation. India’s draft National Energy Storage Framework assigns tariff premiums to >6-hour systems, positioning VRFBs for 15–20% of a 10 GW pipeline by 2030.
North America will lead growth at a 22.5% CAGR to 2031, underpinned by the federal 30% standalone credit and California’s 1 GW long-duration solicitation. San Diego Gas & Electric’s long-running 4 MW/16 MWh unit verified less than 0.5% annual fade, demonstrating bankable performance to U.S. lenders. Canada’s Clean Electricity Regulations accelerate adoption as utilities must reach net-zero by 2035, driving 500 MW of long-duration procurement in Alberta and Saskatchewan. Mexico’s Sonora solar corridor seeks 300 MW of six-hour storage under CFE’s 2024 tender that favors flow chemistries for high-temperature operation.
Europe held roughly 18% market share in 2025. The United Kingdom showcased electrolyte leasing at Oxford, raising debt-service coverage to 1.5× and reducing capex by 28%. Germany’s EEG 2023 offers a EUR 0.10 kWh-¹ bonus for >4-hour storage, prompting 80 MW of VRFB awards between 2024 and 2025. Spain’s 1.1 MW/8.8 MWh install cut curtailment at a Castilla y León solar farm by 9%. Nordic utilities weigh seasonal benefits as winter peaks exceed summer solar by 60%, making 200 MW of flow storage attractive.
The Middle East and Africa held 8% of revenue. Dubai tendered 300 MW/2.4 GWh of eight-hour storage for its Mohammed bin Rashid Al Maktoum park, citing safety under 45 °C ambient temperatures. Saudi Arabia’s NEOM giga-projects call for at least 1 GW of VRFB to balance intermittent solar, and South Africa’s Eskom now evaluates flow chemistries for peaking capacity after a successful 6 MW pilot. South America remains nascent, but Brazil’s 2024 auction framework favors >20-year design life, a criterion that plays to VRFB’s strengths.

Competitive Landscape
Five manufacturers, Rongke Power, Sumitomo Electric, Invinity Energy Systems, VRB Energy, and H2 Inc., controlled 55% of installed capacity in 2025, indicating a moderately concentrated field. Vertical integration strategies diverge: Largo Clean Energy and Bushveld Energy secure captive vanadium to stabilize electrolyte pricing, while Invinity and VRB Energy focus on system integration and partner with commodity traders for leasing structures. White-space opportunities cluster in the 100-500 kW band; fewer than 10 suppliers offer turnkey solutions below USD 700 kWh-¹. Vanevo’s pump-free cabinet cuts installed cost by 35% and targets telecom towers, whereas Australian Flow Batteries tailors 1 MW/5 MWh ruggedized units for mine sites.
Cost trajectories are compressing: Chinese gigafactories plan >1 GWh yr production that could drive stack costs under USD 150 kW-¹, pushing gross margins for non-integrated vendors from 35% in 2024 to roughly 22% by 2031. ESS Tech’s iron flow chemistry threatens VRFB above four hours, though its lower energy density limits utility where the footprint is constrained. Intellectual-property activity is brisk; three PNNL membrane patents filed since 2024 and Fraunhofer’s hybrid supercapacitor architecture point to continued differentiation on cycle life and efficiency.
Bankability remains the gating factor. UL 9540 coverage gaps mean lenders apply 30% residual-value haircuts to uncertified products, forcing smaller firms into costly third-party testing that delays commercialization by up to 18 months. As standards mature, the competitive landscape is expected to bifurcate: three or four fully integrated giants will dominate >50 MWh utility projects, while a long tail of specialists captures C&I and microgrid niches where customization and local service matter.
Vanadium Redox Flow Battery (VRFB) Industry Leaders
-
VRB Energy
-
Invinity Energy Solutions
-
Sumitomo Electric Industries Ltd.
-
Dalian Rongke Power Co. Ltd.
-
Shanghai Electric
- *Disclaimer: Major Players sorted in no particular order


Recent Industry Developments
- January 2026: China connected a 200 MW / 1,000 MWh vanadium redox flow battery (VRFB) project in Xinjiang. Utilizing technology from Rongke Power, the project is integrated with a 1 GW solar plant and represents the world’s first gigawatt-hour-scale VRFB installation for long-duration energy storage.
- September 2025: Storion Energy LLC, a domestic producer of components for Vanadium Redox Flow Batteries (VRFBs), announces its inaugural customer for vanadium electrolyte. This achievement comes from its continuous production line, set up with backing from the U.S. Department of Energy’s MAKE IT Prize, which stands for Manufacture of Advanced Key Energy Infrastructure Technologies.
- July 2024: China has wrapped up the primary construction of the globe's largest vanadium redox flow battery (VRFB) energy storage initiative. Supported by the China Huaneng Group, this ambitious project boasts a 200 MW/1 GWh VRFB system, seamlessly integrated with a 1 GW solar farm. Nestled across 1,870 hectares in Jimusar county, Xinjiang, the project comes with a hefty price tag of CNY 3.8 billion (USD 520 million).
- February 2025: At the San Diego Convention Center, Sumitomo Electric unveiled its cutting-edge vanadium redox flow battery (VRFB) during the Energy Storage North America (ESNA) event.


Research Methodology Framework and Report Scope
Market Definitions and Key Coverage
Our study defines the global vanadium redox battery (VRB) market as the annual revenue from newly commissioned energy-storage systems that employ an all-vanadium electrolyte flowing through separate tanks, sold to utilities, commercial and industrial users, and off-grid micro-grids. The value chain begins with electrolyte procurement and ends when a turnkey container is energized on site, so aftermarket services are not counted.
Scope exclusion: Residential batteries below 10 kWh and laboratory test stacks are left outside.
Segmentation Overview
-
By Product Type
- Containerised Systems
- Cabinet/Rack Systems
-
By Component
- Electrolyte
- Cell Stack
- Membrane
-
By Power Rating
- Below 100 kW
- 100 to 500 kW
- 501 kW to 5 MW
-
By System Size
- Large-Scale (Above 10 MWh)
- Medium (1 to 10 MWh)
- Small-Scale (Below 1 MWh)
-
By Application
- Renewable Energy Integration
- Grid-Peaking/Load-Shifting
- Microgrids and Off-Grid
-
By End-User
- Utilities
- Commercial and Industrial
- Residential
-
By Geography
-
North America
- United States
- Canada
- Mexico
-
Europe
- United Kingdom
- Germany
- France
- Spain
- Nordic Countries
- Russia
- Rest of Europe
-
Asia-Pacific
- China
- India
- Japan
- South Korea
- ASEAN Countries
- Rest of Asia-Pacific
-
South America
- Brazil
- Argentina
- Colombia
- Rest of South America
-
Middle East and Africa
- United Arab Emirates
- Saudi Arabia
- South Africa
- Egypt
- Rest of Middle East and Africa
-
North America
Detailed Research Methodology and Data Validation
Primary Research
Mordor analysts interviewed VRB integrators, electrolyte leasing firms, grid planners across Asia Pacific, North America, and Europe, and policy experts. These conversations revealed typical turnkey prices, construction lead times, and project slippage risks that helped our team challenge and fine-tune desk assumptions.
Desk Research
We mapped demand using public datasets such as US Energy Information Administration grid-scale additions, International Renewable Energy Agency capacity statistics, Global Wind Energy Council annual reports, and UN Comtrade vanadium flow data. Standards from the International Electrotechnical Commission clarified minimum stack ratings, while project news captured through Dow Jones Factiva and financial splits from D&B Hoovers filled remaining gaps. The sources named are illustrative; many others were reviewed to validate and refine the dataset.
Market-Sizing & Forecasting
A top-down model starts with country-level MWh commissioned each year, converted to value through region-specific average selling prices. Supplier shipment checks and channel calls provide a selective bottom-up view to test totals. Key variables include vanadium flake prices, renewable curtailment hours, national long-duration storage targets, electrolyte leasing uptake, capital subsidy trajectories, and forecast solar additions. Multivariate regression projects these drivers to 2030, and scenario testing cushions commodity volatility. Gap areas in bottom-up inputs are bridged with conservative coefficients vetted by industry advisers before figures are locked.
Data Validation & Update Cycle
Every output passes anomaly screens against third-party trackers and company guidance, followed by peer review. Reports refresh annually, with interim updates when major policy or pricing shocks occur, and a final validation pass is completed just before delivery.
Why Mordor's Vanadium Redox Battery Baseline Commands Reliability
Published values often diverge because firms adopt different chemistries, price assumptions, and data freeze dates. Our disciplined scope and yearly refresh narrow those gaps.
Key gap drivers include whether non-vanadium flow batteries are mixed in, how rapid price erosion is modeled, and if only announced rather than energized projects are tallied.
Benchmark comparison
| Market Size | Anonymized source | Primary gap driver |
|---|---|---|
| USD 0.92 B (2025) | Mordor Intelligence | - |
| USD 0.47 B (2024) | Global Consultancy A | Omits systems above 20 MWh and holds price flat |
| USD 0.19 B (2023) | Industry Journal B | Counts announced projects only |
| USD 0.30 B (2024) | Regional Consultancy C | Blends vanadium with zinc-bromine chemistries |
The comparison shows that our clear scope, dual-path modeling, and frequent validation give decision-makers a balanced baseline grounded in transparent variables and repeatable steps.


Key Questions Answered in the Report
How large is the vanadium redox flow battery market in 2026?
The market stood at USD 1.10 billion in 2026 and is projected to reach USD 2.48 billion by 2031.
What is the expected CAGR for vanadium redox flow batteries to 2031?
The market is forecast to grow at a 17.62% CAGR between 2026 and 2031.
Which application currently leads demand?
Renewable-energy firming applications held 46.5% of 2025 revenue because utilities need multi-hour storage to reduce solar and wind curtailment.
Which region will grow fastest?
North America is poised for a 22.5% CAGR to 2031, driven by federal tax credits and state long-duration mandates.
Why are electrolyte leasing models important?
Leasing removes vanadium price volatility from project capex, lowers upfront capital by nearly 30%, and improves debt coverage ratios.
What limits broader VRFB adoption today?
The absence of unified performance standards and lingering vanadium price volatility both elevate financing costs compared with mature lithium systems.
Page last updated on:


