Flow Battery Market Size and Share
Market Overview
| Study Period | 2021 - 2031 |
|---|---|
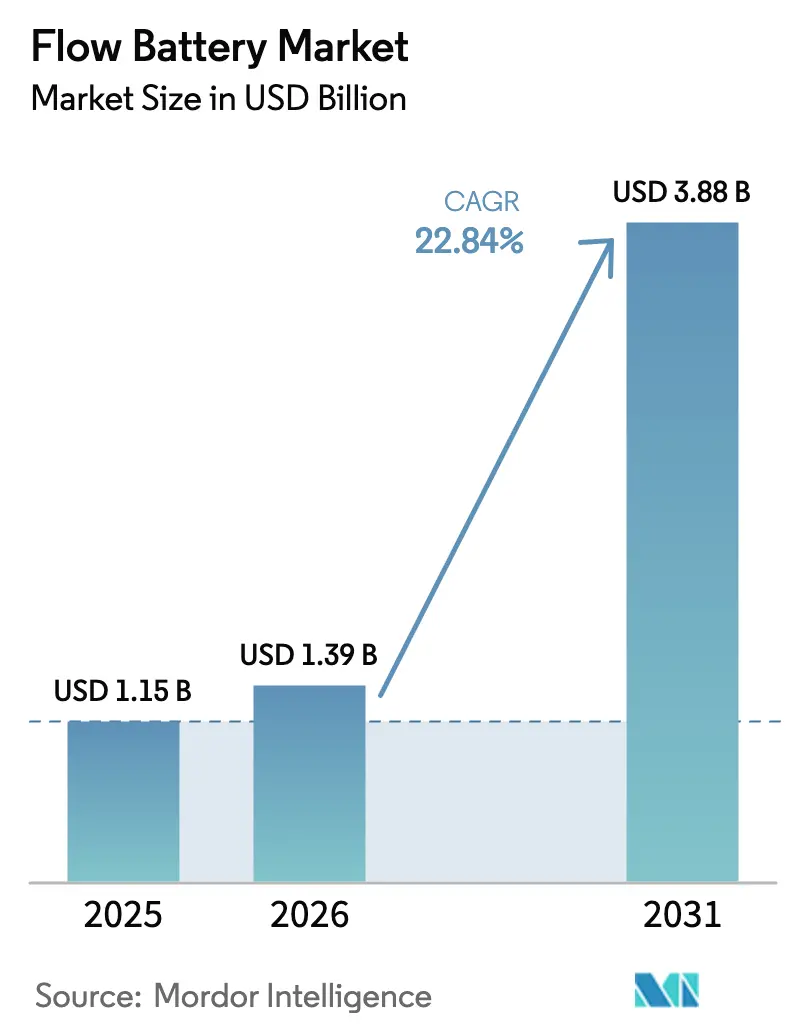
| Market Size (2026) | USD 1.39 Billion |
| Market Size (2031) | USD 3.88 Billion |
| Growth Rate (2026 - 2031) | 22.84% CAGR |
| Fastest Growing Market | North America |
| Largest Market | Asia Pacific |
| Market Concentration | Medium |
Major Players *Disclaimer: Major Players sorted in no particular order Image © Mordor Intelligence. Reuse requires attribution under CC BY 4.0. | |
Flow Battery Market Analysis by Mordor Intelligence
The Flow Battery Market size is expected to increase from USD 1.15 billion in 2025 to USD 1.39 billion in 2026 and reach USD 3.88 billion by 2031, growing at a CAGR of 22.84% over 2026-2031.
Surging renewable generation, mandates for eight-hour discharge capability, and declining electrolyte leasing costs are accelerating procurement. Utilities in California, China, and Germany currently specify 6-12 hour storage windows, a span that fixed-ratio lithium-ion cannot meet at competitive cost. Chinese manufacturers have widened price advantages through vertical integration that delivers electrolyte at RMB 180-220 per kg, undercutting Western vendors by 30-40% on turnkey systems. North America’s Inflation Reduction Act is spurring a wave of tax-advantaged projects, while new IEC and IEEE performance standards are removing certification friction for financiers. Corporate decarbonization goals, together with demand-charge arbitrage, extend addressable opportunities beyond the grid to commercial and industrial buyers that prize modularity, safety, and unlimited cycling capability.
Key Report Takeaways
- By battery type, vanadium redox held 80.2% revenue share in 2025; zinc-bromine is forecast to expand at a 25.1% CAGR through 2031.
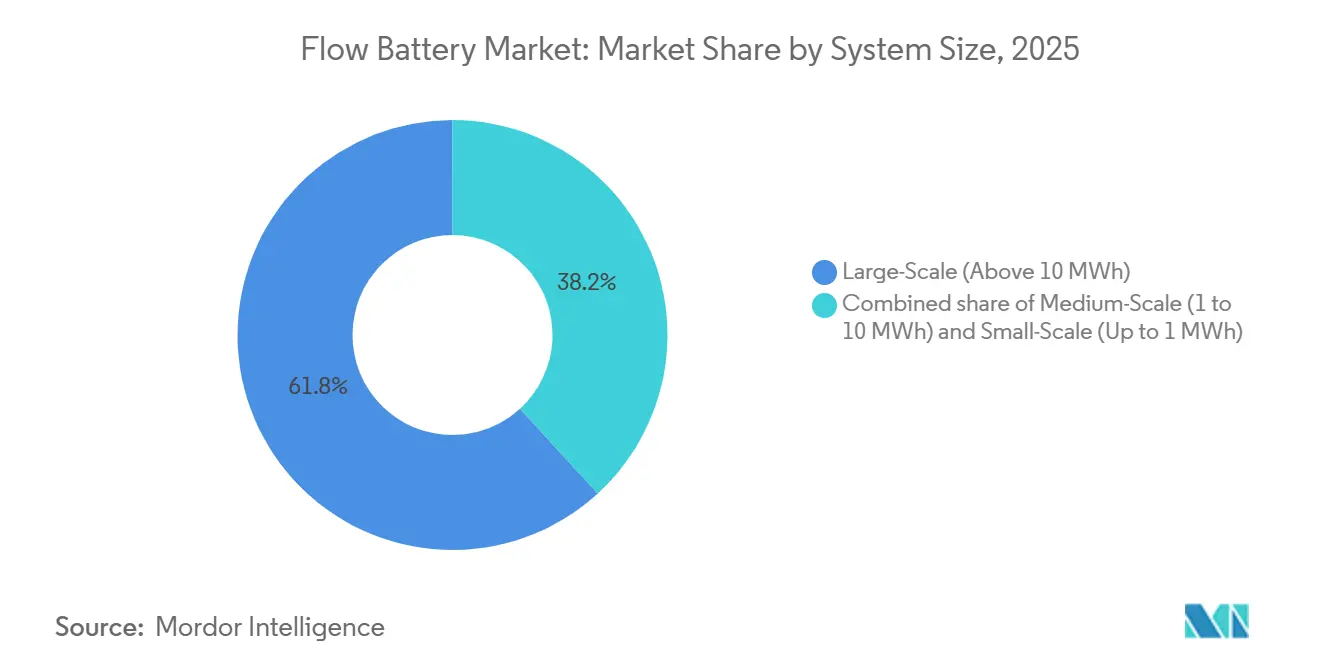
- By system size, large-scale installations above 10 MWh captured 61.8% of 2025 revenue; small-scale units under 1 MWh are projected to advance at a 28.9% CAGR to 2031.
- By application, grid-peaking accounted for 52.5% of 2025 demand and is growing at a 22.3% CAGR; microgrids will pace the sector at a 27.5% CAGR through 2031.
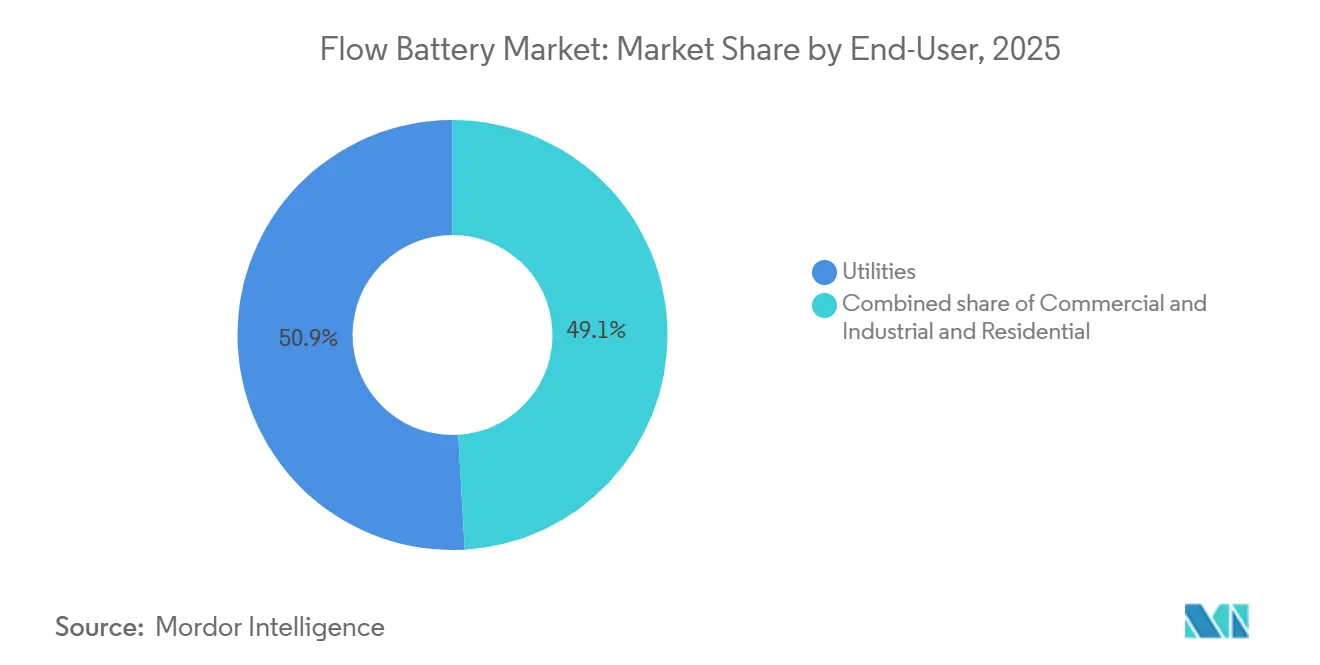
- By end-user, utilities commanded a 50.9% share of the flow battery market size in 2025; commercial and industrial deployments are climbing at a 24.7% CAGR.
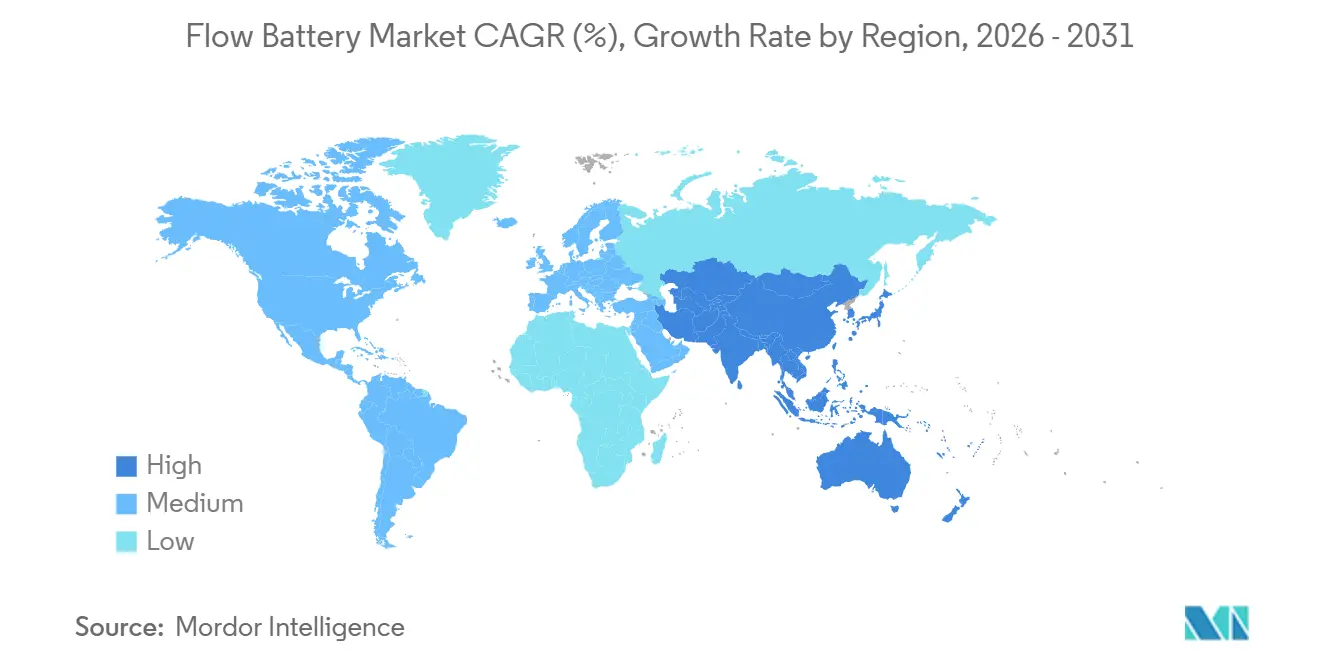
- By geography, Asia-Pacific led with 44.7% 2025 revenue, while North America is the fastest-growing region at 25.6% CAGR through 2031.
- Dalian Rongke Power, ESS Tech, Invinity Energy Systems, Sumitomo Electric, and VRB Energy collectively controlled close to 60% of installed capacity in 2025, with no single player above 25% share.
Note: Market size and forecast figures in this report are generated using Mordor Intelligence’s proprietary estimation framework, updated with the latest available data and insights as of January 2026.
Global Flow Battery Market Trends and Insights
Drivers Impact Analysis*
| Driver | (~) % Impact on CAGR Forecast | Geographic Relevance | Impact Timeline |
|---|---|---|---|
| Renewables-driven long-duration storage demand | 6.50% | China, California, Germany, Australia | Medium term (2-4 years) |
| Falling electrolyte leasing costs | 4.20% | China core, North America and Europe emerging | Short term (≤2 years) |
| Stack manufacturing and membrane advances | 3.80% | Japan, Germany, China | Medium term (2-4 years) |
| China electrolyte capacity scale-up | 3.10% | APAC core, global spillover | Short term (≤2 years) |
| Utility resilience and regulatory mandates | 2.90% | North America, Europe | Medium term (2-4 years) |
| Source: Mordor Intelligence | |||


Renewables-Driven Long-Duration Storage Demand
Curtailment of wind and solar reached 8.3% of renewable generation in China’s northwest during 2024, costing operators USD 2.1 billion in lost revenue.[1]China Electricity Council, “Renewable Curtailment Statistics 2024,” cec.org.cn Provincial rules now call for 6-12-hour storage, an interval that the flow battery market fulfills economically through decoupled power and energy ratings.[2]National Renewable Energy Laboratory, “Flow Battery Cost Assessment 2025,” nrel.gov California’s 11.5 GW long-duration target by 2032 prioritizes technologies with eight-plus hour discharge, effectively excluding most lithium-ion systems. Australia’s Yadlamalka Energy project and Germany’s negative-pricing events showcase arbitrage earnings when round-trip degradation is negligible.
Falling Electrolyte Leasing Costs (New Model)
Panzhihua’s 100 MW/500 MWh project pioneered electrolyte leasing that trimmed upfront capital 35-40%, replacing lump-sum vanadium purchase with USD 0.015 per kWh monthly fees. Largo Clean Energy’s VPURE+ now offers 20-year performance guarantees and end-of-life buyback in North America and Europe, mirroring solar power-purchase constructs. Lease accounting recasts electrolyte as an operating expense, raising internal rates of return by up to 300 basis points for utilities. South Africa’s Bushveld Minerals is porting the model to mining microgrids across sub-Saharan Africa.
Stack Manufacturing And Membrane Advances
Sumitomo’s third-generation bipolar plates, deployed at Kashiwazaki in 2024, cut internal resistance by 18% and lifted efficiency to 82%. Hydrocarbon membranes under development by Jena Batteries and VoltStorage demonstrate 30,000-plus cycles in tests, extending system life toward 25 years. Dalian Rongke’s standardized 250 kW modules reduce site work 40% by enabling plug-and-play stacking for multi-megawatt arrays. The shift away from perfluorinated membranes also anticipates emerging PFAS restrictions under the EU REACH framework. IEEE 1679.3 now offers buyers a unified performance test regime, cutting diligence costs.
China's Electrolyte Capacity Scale-Up
Vanadium pentoxide output climbed 22% in 2024 to 140,000 t/y as new mines in Panzhihua and Chengde ramped, delivering electrolyte at USD 25-31/kg versus USD 40-50/kg on Western spot markets. State-owned Pangang Group is stockpiling electrolyte as a strategic reserve, insulating domestic projects from volatility. Closed-loop recovery infrastructure enhances recyclability and reduces lifecycle costs, a competitive advantage spotlighted by the World Bank’s 2024 circular economy report. Rumored export controls on battery-grade vanadium could push Western developers to source from Australia, South Africa, or Canada.
Restraints Impact Analysis*
| Restraint | (~) % Impact on CAGR Forecast | Geographic Relevance | Impact Timeline |
|---|---|---|---|
| High upfront CAPEX & vanadium price volatility | -3.7% | Global, acute in North America and Europe | Short term (≤ 2 years) |
| Low energy density vs. Li-ion | -2.4% | Global, limiting C&I and residential adoption | Long term (≥ 4 years) |
| Lack of global standards / installer base | -1.8% | North America, Europe, emerging markets (India, Southeast Asia, MEA) | Medium term (2-4 years) |
| Permitting complexities for large electrolyte tanks | -1.5% | North America, Europe; less acute in China | Short term (≤ 2 years) |
| Source: Mordor Intelligence | |||
High Upfront CAPEX & Vanadium Price Volatility
Turnkey vanadium redox systems averaged USD 600-750 per kWh for sub-10 MWh projects in 2025. Vanadium prices rose 15% in 2024, lifting levelized costs 3-4% when electrolyte represents 30-40% of spend. The United States imports 95% of its vanadium, exposing developers to tariff and disruption risk. Lease models mitigate upfront outlay yet narrow arbitrage margins in markets with limited peak-to-off-peak spreads.
Low Energy Density Versus Lithium-Ion
Flow batteries provide 20-40 Wh/kg, one-fifth that of lithium-ion, and occupy 150-200 m² for 1 MWh, restricting rooftop or basement siting. Transportation costs are 40-60% higher per kWh because of electrolyte mass. A 10 kWh residential system would weigh 400-500 kg, deterring single-family adoption. Zinc-bromine delivers 50-60 Wh/kg but faces corrosion trade-offs that cap cycle life at 10,000-15,000 cycles.
*Our forecasts treat driver/restraint impacts as directional, not additive. The impact forecasts reflect baseline growth, mix effects, and variable interactions.
Segment Analysis
By Battery Type: Vanadium Redox Dominates, Zinc-Bromine Gains Traction
Vanadium redox captured 80.2% of 2025 revenue on the back of a proven 20,000-cycle life and China’s supply-chain control, positioning it as the anchor chemistry of the flow battery market.[3]Sumitomo Electric Industries, “Vanadium Flow Technology White Paper 2024,” sei.co.jp Zinc-bromine systems are projected to grow 25.1% CAGR through 2031, owing to one-third electrolyte cost versus vanadium and simpler permitting regimes, which help them penetrate the commercial and industrial flow battery market share at 12% by 2031. Iron flow chemistry commands growing mindshare after ESS Tech delivered 75 MWh to Sacramento; its non-toxic electrolyte appeals in dense urban settings. Zinc-iron and all-iron remain pilot-scale due to corrosion and low efficiency, holding less than 1% revenue.
China’s vertically integrated mines, electrolyte plants, and module factories drive utility-scale vanadium costs below USD 300 per kWh, enabling 20-year warranties that protect flow battery market size economics. Zinc-bromine uptake is notable in Australia and Germany, where C&I users adopt modular 50-200 kWh racks that fit transformer yards without fire-suppression retrofits. Iron flow contenders aim to win U.S. federal grants that prioritize domestic mineral content.
By System Size: Utility-Scale Leads, Small-Scale Surges
Installations above 10 MWh held 61.8% of revenue in 2025 as utilities centralize long-duration assets across multiple substations, yielding flow battery market size advantages via economies of scale.[4]California Public Utilities Commission, “Storage Procurement Tracker 2025,” cpuc.ca.gov Small-scale units, while only 8% of 2025 megawatt-hours, are set to expand 28.9% CAGR on microgrid adoption in islands and remote mines. Medium 1-10 MWh systems target demand-charge mitigation, but lithium-ion competition is intense where space premiums are high.
Cost curves favor big footprints. Dalian Rongke’s 200 MW/800 MWh Ordos site achieved sub-USD 300 per kWh by using steel tanks taller than 15 m, whereas microgrid developers value modular containerized units under 1 MWh despite higher USD 550-600 per kWh tags. California schools and data centers are piloting 2-4 MWh systems that shave peaks to cut USD 20-30 per kW demand charges. Small-scale sales will remain a minority of the flow battery market share to 2031, yet supply critical proof points for residential viability.


By Application: Grid-Peaking Dominates, Microgrids Accelerate
Grid-peaking and load-shifting locked in 52.5% of 2025 demand, exploiting 5-10x intraday price spreads and deferring gas peaker upgrades in California and China. Microgrids should post a 27.5% CAGR through 2031 as mines, islands, and military bases chase diesel displacement and multi-day autonomy. Renewable firming rounds out demand, aligning growth with wind and solar pipelines in Asia and the Middle East.
Flow batteries enable capacity deferral by time-shifting solar from midday to evening peaks when wholesale rates triple. In the Northern Territory, diesel prices above USD 2 per L make 20-year vanadium systems paired with PV achieve sub-USD 0.20 per kWh levelized costs. Chinese provinces with double-digit wind curtailment are contracting flow batteries for renewable portfolio compliance.
By End-User: Utilities Lead, C&I Accelerates
Utilities generated 50.9% of 2025 revenue, driven by policy mandates and grid-modernization budgets, locking in long tenor power-purchase agreements that underpin bankability. Commercial and industrial buyers are on track to reach 35% share by 2031, spurred by demand-charge savings and ESG targets. Residential remains experimental, constrained by weight and footprint, but iron-salt pilots in Germany hint at a future niche.
California IOUs have already signed for 400-plus MWh of vanadium projects to meet 2026 targets. German manufacturing plants are installing 1-5 MWh zinc-bromine units to shave 15-25% of peak load, while data centers secure 20-year iron flow warranties that cut backup diesel runtime. Residential traction depends on shrinking system footprints below 2×2 m and hitting sub-EUR 10,000 installed price points.
Geography Analysis
Asia-Pacific led the flow battery market with 44.7% revenue in 2025 because China commissioned over 2 GWh of capacity and commands 70% of global vanadium output. Provincial mandates pairing 10-20% of renewable nameplate with storage created a captive buyer base, though February 2025 policy changes may temper speculative builds. Japan’s Kashiwazaki project underscores renewed interest as nuclear retirements tighten reserve margins.
North America is the fastest-growing region at 25.6% CAGR thanks to the Inflation Reduction Act’s 30-50% investment tax credit and DOE demonstration grants. California utilities have queued over 300 MWh to hit 2026 goals, while Texas ERCOT reforms reward unlimited-cycling services. Canada sees early activity in Alberta microgrids, but project finance remains nascent without federal incentives.
Europe captured near 15% of 2025 revenue. Germany’s Energiewende and the United Kingdom’s capacity auctions offer 15-year contracts that derisk capital. The Netherlands and Spain explore flow batteries for black-start and congestion relief. Fragmented permitting and hazardous-materials rules lengthen timelines, yet IEC standardization is reducing certification delays.
The Middle East and Africa count under 50 MWh cumulative, yet Vision 2030 in Saudi Arabia and South African mining microgrids are poised to lift demand as solar and wind pipelines pass 50 GW. Latin America remains exploratory; Brazilian utilities favor hydropower reservoirs, and Argentina leans toward lithium-ion for four-hour peaks.
Mordor Intelligence provides coverage of the flow battery market across other key regional markets, including Europe, each with their regulatory frameworks and demand patterns.

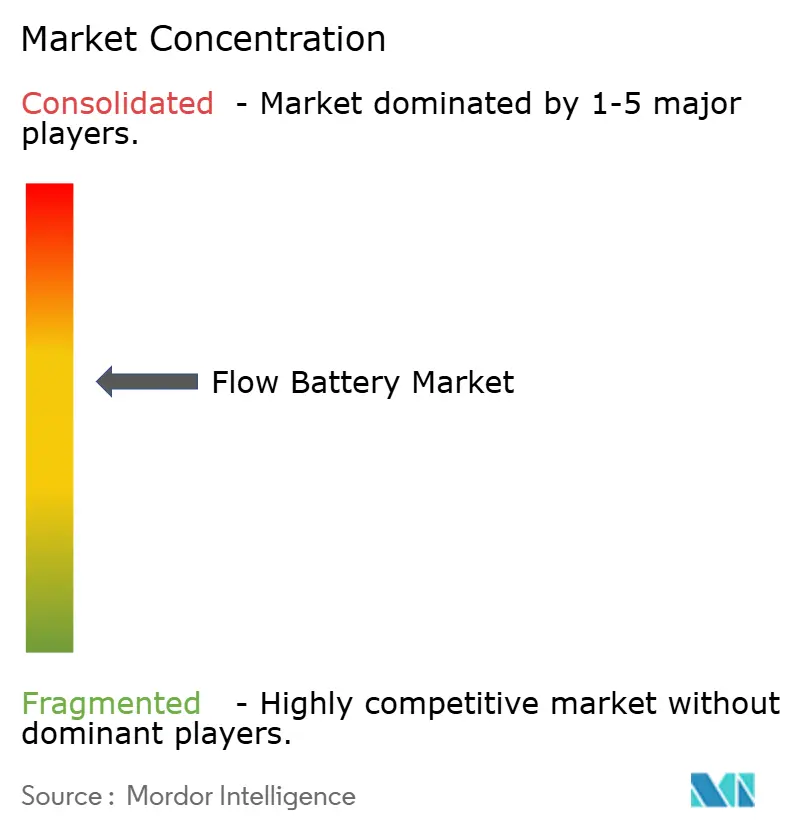
Competitive Landscape
The flow battery market is moderately concentrated. The top five vendors held about 60% of cumulative capacity in 2025, none exceeding 25% individually. Chinese suppliers leverage domestic vanadium, low-cost labor, and state-backed finance to bid turnkey plants at RMB 2.02 per Wh (USD 280/kWh), straining Western balance sheets. Western champions, therefore, emphasize supply-chain security, advanced warranties, and specialized chemistries.
Strategic moves include Largo Clean Energy’s electrolyte-as-a-service pact with Invinity that aligns mineral leasing with module sales. Sumitomo’s acquisition of membrane startups secures high-cycle hydrocarbon materials, and ESS Tech’s iron flow deployments provide a non-toxic value proposition attractive to utilities near population centers. VoltStorage and Jena Batteries target underserved small commercial and residential niches with iron-salt and organic electrolytes that dodge vanadium volatility.
U.S. federal grants could catalyze domestic manufacturing, but capital intensity remains high. Lockheed Martin’s GridStar Flow has shown limited progress since 2023, and CellCube’s 2024 restructuring highlights execution risk. In China, the National Energy Administration’s pivot away from mandatory storage quotas shifts competition toward merchant revenues, potentially slowing speculative gigawatt pipelines and giving Western players breathing room in international tenders.
Flow Battery Industry Leaders
Dalian Rongke Power Co. Ltd.
Sumitomo Electric Industries Ltd.
Invinity Energy Systems PLC
ESS Tech Inc.
CellCube (Enerox GmbH)
- *Disclaimer: Major Players sorted in no particular order

Recent Industry Developments
- January 2026: ERCOT began settling six-hour ramping products, and Dalian Rongke Power bid a 300 MWh vanadium system into the first auction.
- August 2025: Dalian Rongke commissioned a 100 MW/400 MWh project in Changzhou using electrolyte leasing that cut capital 35-40%.
- March 2025: China’s National Energy Administration scrapped compulsory storage ratios, moving to merchant models.


Global Flow Battery Market Report Scope
A flow battery is a rechargeable battery in which electrolyte flows through one or more electrochemical cells from one or more tanks. Flow batteries are often used as a substitute for fuel cells and lithium-ion batteries.
The global flow battery market report is segmented by battery type, system size, application, end-user, and geography. By battery type, the market is segmented into vanadium redox flow battery, zinc-bromine flow battery, iron flow battery, zinc-iron flow battery, and all-iron flow battery. By system size, the market is segmented into large-scale (above 10 MWh), medium-scale (1 to 10 MWh), and small-scale (up to 1 MWh). By application, the market is segmented into renewable energy integration, grid-peaking/load-shifting, and microgrids and off-grid. By end-user, the market is segmented into utilities, commercial and industrial (C&I), and residential. By geography, the market is segmented into North America, Europe, Asia-Pacific, South America, and the Middle East and Africa.
| Vanadium Redox Flow Battery |
| Zinc-Bromine Flow Battery |
| Iron Flow Battery |
| Zinc-Iron Flow Battery |
| All-Iron Flow Battery |
| Large-Scale (Above 10 MWh) |
| Medium-Scale (1 to 10 MWh) |
| Small-Scale (Up to 1 MWh) |
| Renewable Energy Integration |
| Grid-Peaking/Load-Shifting |
| Microgrids and Off-Grid |
| Utilities |
| Commercial and Industrial (C&I) |
| Residential |
| North America | United States |
| Canada | |
| Europe | Germany |
| United Kingdom | |
| France | |
| Italy | |
| NORDIC Countries | |
| Russia | |
| Rest of Europe | |
| Asia-Pacific | China |
| Japan | |
| India | |
| South Korea | |
| ASEAN Countries | |
| Australia and New Zealand | |
| Rest of Asia-Pacific | |
| South America | Brazil |
| Argentina | |
| Rest of South America | |
| Middle East and Africa | Saudi Arabia |
| United Arab Emirates | |
| South Africa | |
| Egypt | |
| Rest of Middle East and Africa |
| By Battery Type | Vanadium Redox Flow Battery | |
| Zinc-Bromine Flow Battery | ||
| Iron Flow Battery | ||
| Zinc-Iron Flow Battery | ||
| All-Iron Flow Battery | ||
| By System Size | Large-Scale (Above 10 MWh) | |
| Medium-Scale (1 to 10 MWh) | ||
| Small-Scale (Up to 1 MWh) | ||
| By Application | Renewable Energy Integration | |
| Grid-Peaking/Load-Shifting | ||
| Microgrids and Off-Grid | ||
| By End-User | Utilities | |
| Commercial and Industrial (C&I) | ||
| Residential | ||
| By Geography | North America | United States |
| Canada | ||
| Europe | Germany | |
| United Kingdom | ||
| France | ||
| Italy | ||
| NORDIC Countries | ||
| Russia | ||
| Rest of Europe | ||
| Asia-Pacific | China | |
| Japan | ||
| India | ||
| South Korea | ||
| ASEAN Countries | ||
| Australia and New Zealand | ||
| Rest of Asia-Pacific | ||
| South America | Brazil | |
| Argentina | ||
| Rest of South America | ||
| Middle East and Africa | Saudi Arabia | |
| United Arab Emirates | ||
| South Africa | ||
| Egypt | ||
| Rest of Middle East and Africa | ||


Key Questions Answered in the Report
How large is the flow battery market in 2026?
The flow battery market size is projected at about USD 1.39 billion in 2026, on the trajectory toward USD 3.88 billion by 2031.
What CAGR is forecast for flow battery installations through 2031?
Global revenue is expected to advance at a 22.84% CAGR from 2026 to 2031.
Which battery chemistry holds the largest share?
Vanadium redox accounts for roughly 80% of 2025 revenue, maintaining clear leadership through the forecast period.
Why are utilities favoring flow batteries over lithium-ion for long-duration needs?
Flow batteries deliver 6-12 hour discharge without rapid degradation and enable independent scaling of power and energy, which cuts lifecycle cost for eight-hour duty cycles.
What regions are growing the fastest?
North America leads growth with a forecast 25.6% CAGR, supported by investment tax credits and long-duration procurement mandates.
How does electrolyte leasing improve project economics?
Leasing converts vanadium into an operating expense, slicing upfront CAPEX 35-40% and improving project IRR by up to 3 percentage points.
Page last updated on:


