
Process Oils Market Size and Share
Market Overview
| Study Period | 2021 - 2031 |
|---|---|
| Market Volume (2026) | 5.33 Million tons |
| Market Volume (2031) | 6.06 Million tons |
| Growth Rate (2026 - 2031) | 2.61 % |
| Fastest Growing Market | Asia Pacific |
| Largest Market | Asia Pacific |
| Market Concentration | Medium |
Major Players *Disclaimer: Major Players sorted in no particular order Image © Mordor Intelligence. Reuse requires attribution under CC BY 4.0. | |
Process Oils Market Analysis by Mordor Intelligence
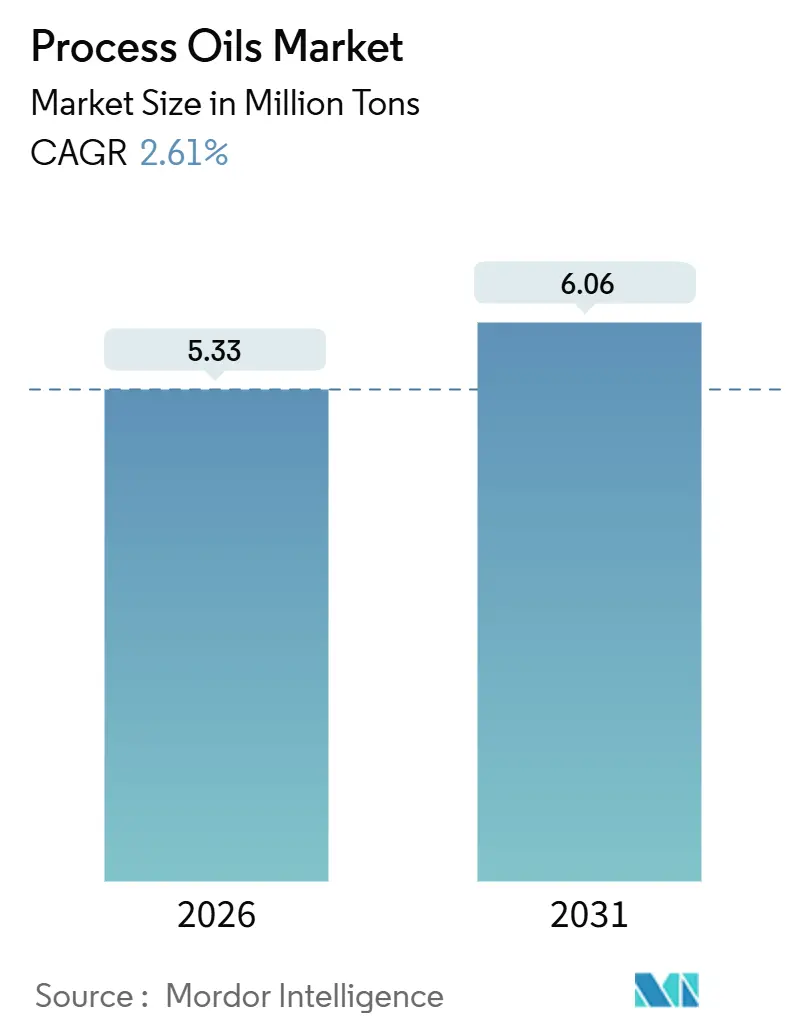
The Process Oils Market size is estimated at 5.33 million tons in 2026, and is expected to reach 6.06 million tons by 2031, at a CAGR of 2.61% during the forecast period (2026-2031). Solid demand for naphthenic grades, resilient tire production in Asia-Pacific, and the pivot toward ultra-low-PAH formulations underpin this steady trajectory. Naphthenic oils pair incumbent scale with fastest-in-class growth, personal-care formulations are upgrading to U.S. Pharmacopeia (USP) white oils, and integrated Asian refiners are capitalizing on feedstock security to widen cost advantages over Western peers. Meanwhile, Group I refinery shutdowns in North America and Europe have re-ordered trade flows, while REACH Annex XVII PAH ceilings accelerate the shift toward hydro-treated and naphthenic alternatives.
Key Report Takeaways
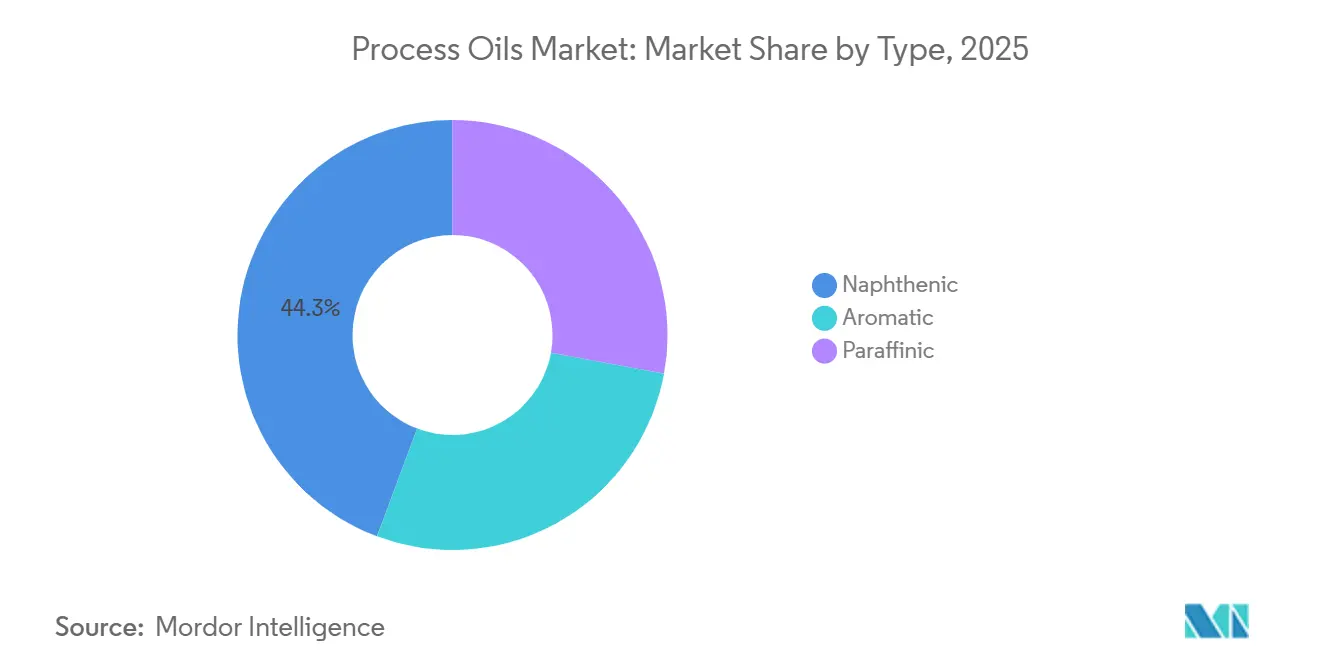
- By type, naphthenic oils led with 44.28% of the process oil market share in 2025 and are advancing at a 6.03% CAGR through 2031.
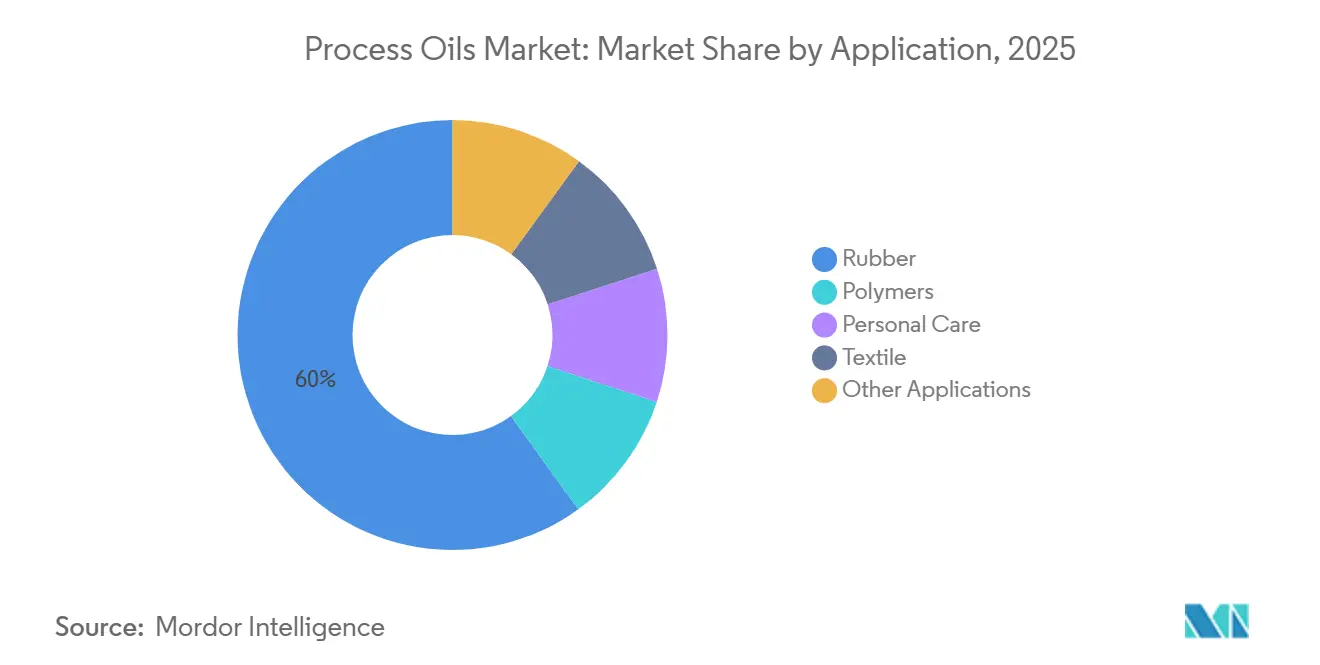
- By application, rubber captured a 59.94% share of the process oil market size in 2025, while personal care is growing at a 4.92% CAGR to 2031.
- By geography, Asia-Pacific commanded 66.06% of the process oil market size in 2025 and is projected to sustain a 2.94% CAGR through 2031.
Note: Market size and forecast figures in this report are generated using Mordor Intelligence’s proprietary estimation framework, updated with the latest available data and insights as of January 2026.
Market Trends and Insights
Drivers Impact Analysis of Process Oils Market*
| Drivers | (~) % Impact on CAGR Forecast | Geographic Relevance | Impact Timeline |
|---|---|---|---|
| Rising polymer and synthetic rubber capacity additions | +0.9% | Asia-Pacific core, spill-over to North America | Medium term (2-4 years) |
| Elevated demand from high-performance tire formulations | +0.7% | Global, with concentration in China, India, ASEAN | Short term (≤ 2 years) |
| Growth of naphthenic oils in metal-working fluids for EV manufacturing | +0.6% | Asia-Pacific and North America EV hubs | Medium term (2-4 years) |
| Surging personal-care formulations using white process oils | +0.4% | North America & EU, emerging in Asia-Pacific | Long term (≥ 4 years) |
| Shift to ultra-low VOC printing inks using hydro-treated process oils | +0.2% | EU and North America, regulatory-driven | Medium term (2-4 years) |
| Source: Mordor Intelligence | |||
Rising Polymer And Synthetic Rubber Capacity Additions
Evonik's new polybutadiene unit in Shanghai, which came online recently, has boosted the captive demand for low-viscosity process oils. Meanwhile, Dow's utilization rate indicates a tightening market, prompting debottlenecking efforts linked to multi-year supply contracts with integrated refiners. Naphthenic grades gain share as solution-polymerized rubber formulas need superior solvency, and Asian producers leverage co-located feedstock to secure margins. These dynamics enlarge the addressable base for the process oil market, reinforcing mid-term growth. Merchant refiners without captive base oil streams face thinner spreads, pushing them toward specialty niches or import strategies.
Elevated Demand From High-Performance Tire Formulations
China’s tire production has seen significant growth, with premium radial categories incorporating process oils per compound, signaling strong demand. While premium segments embrace "green" tires, which utilize silica to reduce rolling resistance, these innovations hinge on treated distillate aromatic extract (TDAE) or bio-based substitutes. These substitutes must adhere to a PAH ceiling, a benchmark now adopted by global OEMs. Meanwhile, in South Asia and Africa, bias-ply and off-road tires continue to favor more affordable aromatic extracts. This choice not only highlights a geographic arbitrage but also bolsters legacy capacities in those regions. As tire formulations evolve, they introduce a broader spectrum of grade requirements, ensuring the process oil market remains closely tied to the automotive industry's rhythms.
Growth Of Naphthenic Oils In Metal-Working Fluids For EV Manufacturing
Electric-vehicle battery-pack machining requires fluids that maintain stable viscosity between 10-80 °C. Naphthenic oils not only meet this criterion but also come with inherently low levels of PAHs. A study published in the 2024 Journal of Cleaner Production highlighted that naphthenic-based blends boast an edge in cooling efficiency over their paraffinic counterparts. As global electric vehicle production is set to grow significantly by 2028, the demand for naphthenic fluids is expected to increase. The sensitivity of performance to these fluids overshadows fluctuations in feedstock prices, allowing for premium pricing and solidifying their specialty status in the larger process oil market.
Surging Personal-Care Formulations Using White Process Oils
As dermatology and baby-care brands eliminate trace aromatics, USP-grade white oils, compliant with FDA 21 CFR 178.3620(a), have become mainstream[1]U.S. FDA, “CFR Title 21 §178.3620,” fda.gov. These highly refined grades see their market value uplifted even with modest volume gains. With middle-class consumers in China and India increasingly purchasing premium lotions, regional producers such as Idemitsu and H&R are responding by expanding their white-oil capacity. This shift not only underscores the growing demand but also broadens the market's reliance on process oils, moving beyond its traditional anchor in rubber.
Restraints Impact Analysis of Process Oils Market*
| Restraints | (~) % Impact on CAGR Forecast | Geographic Relevance | Impact Timeline |
|---|---|---|---|
| Stringent PAH limits on aromatic extracts in the EU and North America | -0.8% | EU and North America, spillover to export-oriented Asian producers | Short term (≤ 2 years) |
| Group I base-oil refinery shutdowns tightening feedstock supply | -0.5% | Global, acute in North America and Europe | Medium term (2-4 years) |
| Price volatility linked to crude and base-oil crack spreads | -0.3% | Global, most severe in import-dependent regions | Short term (≤ 2 years) |
| Source: Mordor Intelligence | |||
Stringent PAH Limits On Aromatic Extracts In EU And North America
In response to REACH Annex XVII's ban on process oils containing benzo[a]pyrene and total PAHs above specified thresholds, tire companies have been forced to move away from conventional extracts[2]European Chemicals Agency, “REACH Annex XVII Entry 8,” echa.europa.eu. Echoing these measures, North American regulators, via California statutes, set similar thresholds. This regulatory alignment, coupled with Shell's 2025 closure of its Pernis aromatics unit and ExxonMobil's 2023 exit from Beaumont, has led to a diminished supply of compliant TDAE. Consequently, spot TDAE prices increased, putting pressure on cost-sensitive compounders and stifling short-term growth in the process oil market.
Group I Base-Oil Refinery Shutdowns Tightening Feedstock Supply
Many Group I capacity vanished between 2023 and 2025 as Chevron, Phillips 66, Marathon, and HF Sinclair rationalized legacy units that failed modern lube specs. Because process oils are co-produced with Group I streams, Western supply tightened, and spot imports from South Korea or India attracted freight premiums. Integrated Asian refiners, flush with feedstock, expanded exports and widened their price lead, but long transit times expose buyers to volatility, tempering expansion of the process oil market in deficient regions.
*Our forecasts treat driver/restraint impacts as directional, not additive. The impact forecasts reflect baseline growth, mix effects, and variable interactions.
Process Oils Market Segment Analysis
By Type:
Naphthenic Oils Capture Premium ApplicationsNaphthenic grades held 44.28% of the process oil market share in 2025 and are growing at a 6.03% CAGR, a rare blend of scale and velocity. Their cycloparaffinic structure delivers low-temperature fluidity and high solvency, making them indispensable in EV metal-working fluids and ultra-low-PAH tire treads. Paraffinic oils fill mid-range needs in rubber and polymers, while aromatic oils retain a foothold in bias-ply tires and asphalt in Asia-Pacific where enforcement is looser.
Nynas, Ergon, and Calumet are investing in application labs to co-develop naphthenic solutions with tire makers, locking in long contracts that buffer them from crude swings. Abundant Group II and III paraffinic feedstock keeps paraffinic prices competitive, yet commoditization erodes margins. Should China and India adopt EU-equivalent PAH norms later this decade, significant aromatic demand could vanish, stranding assets in South Korea and Thailand. These cross-currents keep the process oil market fluid, rewarding flexible producers.



By Application:
Rubber Dominates, Personal Care AcceleratesRubber consumed 59.94% of volume in 2025, reflecting tires’ heavy reliance on extender oils to improve processability and flex-fatigue. Tire cycles remain tied to auto demand, so that macro softness can ripple through the process oil market size. Personal care posts a 4.92% CAGR as brands reformulate lotions and baby oils with FDA-certified white oils that eliminate allergenic residues.
Polymers benefit from polyolefin additions in the Middle East, though PVC plasticizers face migration scrutiny that trims oil usage per ton of resin. Textile lubricants are sliding in Europe and North America as apparel shifts to Asia, but integrated mills in China source low-cost oils from Sinopec, maintaining baseline volumes. Together, these sub-sectors diversify the process oil market, dampening over-reliance on any single end use.
Geography Analysis
APAC Process Oils Market
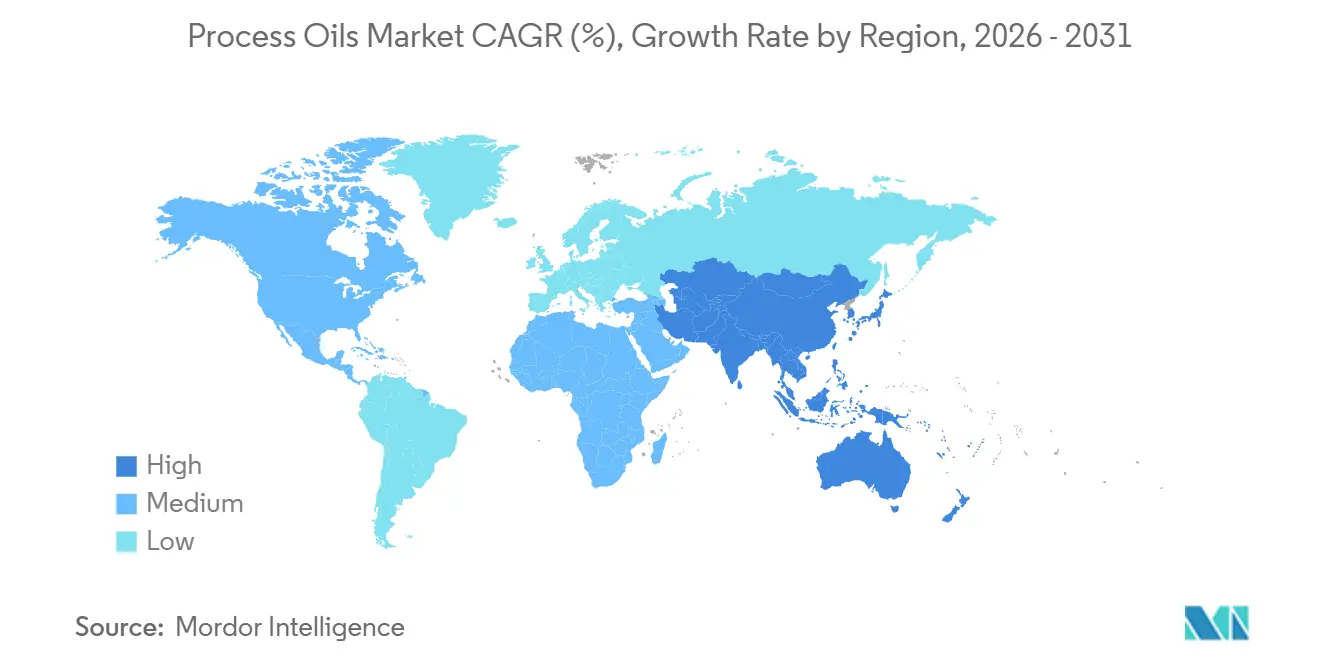
Asia-Pacific held 66.06% of the process oil market size in 2025 and is poised for a 2.94% CAGR through 2031. Integrated complexes at Maoming, Dalian, and Jinling co-produce base oils and process oils, giving Sinopec and PetroChina a delivered-cost edge. China's tire production consumes a significant amount of oil. Indian demand is rising as commercial fleets upsize, while South Korea and Japan export premium white oils for electronics and pharma niches. The region’s feedstock security and scale suggest its share could even inch higher, cementing leadership in the global process oil market.
North America Process Oils Market
After Group I closures at Beaumont, El Segundo, and San Francisco reduced annual capacity, North America grapples with structural shortages. While Calumet, HF Sinclair, and Ergon operate near full capacity, spot shortfalls have driven TDAE prices up. Although imports from South Korea help fill the void, they come with a hefty freight cost, squeezing buyer margins. With Canada boasting a smaller base-oil slate, its reliance on imports is set to continue, curbing volume growth in the process oil market.
EMEA and South America Process Oils Market
Europe mirrors this pattern: Shell’s Pernis shutdown and Total’s Gonfreville conversion tightened supply even as tire demand from Michelin and Continental stayed firm. Compliance with REACH PAH limits has accelerated the move to hydro-treated paraffinic and naphthenic grades, lifting average unit values. South America and the Middle-East and Africa remain slender but rising outlets, thanks to Chinese tire manufacturers establishing plants in Brazil and South Africa. Freight economics make localized supply attractive, inviting investments by Petrobras and Sasol to capture regional slices of the process oil market.

Value Chain Analysis
The process oils value chain starts with crude and vacuum gasoil feedstocks that are converted into base oil and process oil streams at refineries (often alongside Group I/II/III production). Refiners then run hydrotreating and finishing steps to meet low-PAH and white-oil purity requirements. Integrated refiners and specialty producers, including Shell, ExxonMobil, Chevron, TotalEnergies, Nynas, H&R, and Ergon, supply blenders and compounders that tailor grades for rubber, polymers, metalworking fluids, inks, and personal care, with technical service and application labs increasingly used to qualify formulations and secure long-term offtake.
Distribution typically moves through bulk terminals and chemical distributors into tire and rubber plants and other industrial users. Because quality-sensitive grades need dedicated logistics (segregated tanks, heated storage, and contamination control), supply tightness linked to Group I rationalization has increased the importance of trade flows from surplus Asian refiners into North America and Europe. Buyers have also relied more on dual-sourcing and regional procurement to manage freight exposure and delivery variability. Administrative frictions, including intensified customs scrutiny for oil-product classifications, can create short delivery delays, which makes local inventory and contracted supply more valuable for high-throughput rubber customers.
Competitive Landscape
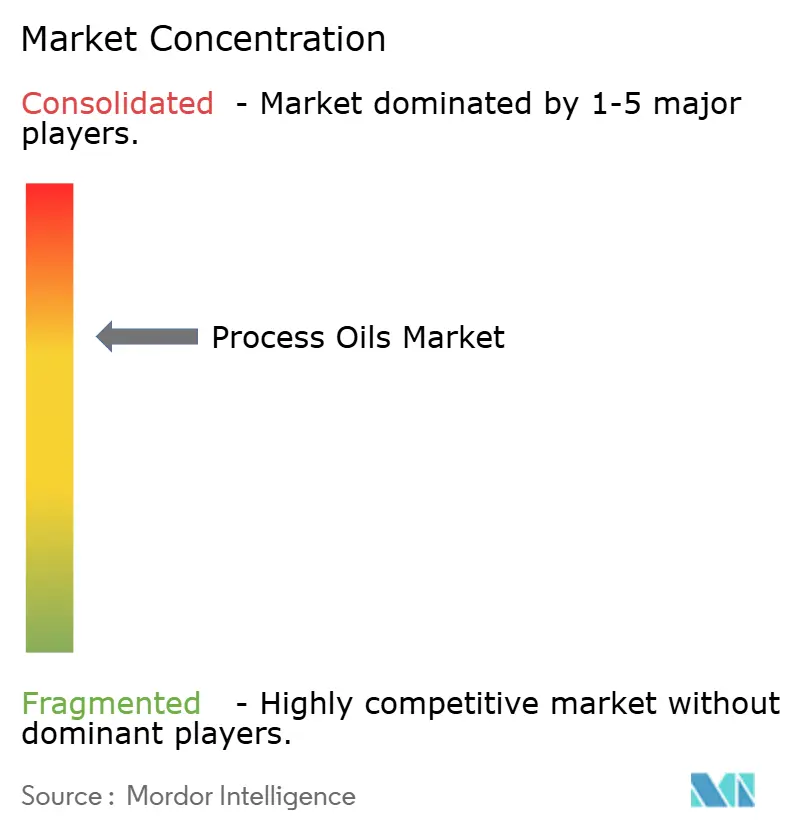
The process oils market is moderately consolidated in nature. Regional specialists focus on technical service, offering tailor-made naphthenic or white oils that command premiums in metal-working fluids and personal-care lines. Mergers and acquisitions talk hovers over niche producers as conglomerates seek specialty margins. Yet, valuations stay disciplined, as no single target commands a significant share. Absent transformative deals, the landscape will likely stay fragmented, rewarding agile firms that can pivot portfolios toward low-PAH and bio-based grades in line with tightening policy across major economies.
Process Oils Industry Leaders
Nynas AB
Shell plc
Exxon Mobil Corporation
Ergon Inc.
LUKOIL
- *Disclaimer: Major Players sorted in no particular order
Process Oils Market Companies Covered in this Report
- Calumet, Inc.
- Chevron Corporation
- China Petroleum & Chemical Corporation.
- ENEOS Corporation
- Ergon Inc.
- Exxon Mobil Corporation
- H&R GROUP
- HF Sinclair Corporation
- Idemitsu Kosan Co. Ltd.
- LUKOIL
- Neste
- Nynas AB
- ORGKHIM Biochemical Holding
- Panama Petrochem Ltd.
- PetroChina
- PETRONAS Lubricants International
- Phillips 66 Company
- SEOJIN CHEMICAL CO.,LTD.
- Shell plc
- TotalEnergies SE

Market Opportunities and Future Outlook
Opportunities concentrate in premium, compliant formulations where customers pay for low-PAH and high-purity performance rather than volume alone. That is visible in USP-grade white oils for personal care (aligned with FDA 21 CFR 178.3620(a)) and in naphthenic or hydro-treated grades used in EV-related metalworking fluids that need stable viscosity across wide operating temperatures. Suppliers that combine feedstock flexibility with technical support for tire makers and OEM-aligned formulations have a stronger position as compounders shift away from higher-aromatic extracts under REACH Annex XVII-style thresholds.
A second opportunity track is sustainability-labeled process oils that can reduce fossil intensity while remaining workable in rubber formulations. In 2024, Nynas launched a renewable-feedstock rubber process oil for SBR and BR elastomers, and Panama Petrochem introduced an eco-certified bio-based rubber process oil derived from castor oil, showing commercialization beyond pilot scale. On the supply side, refinery reconfigurations toward higher-quality base stocks are also reshaping process-oil availability and trade patterns, creating openings for blenders and distributors that can secure reliable compliant streams, manage logistics, and offer portfolio breadth across naphthenic, paraffinic, and treated aromatic alternatives.
Recent Industry Developments in Process Oils Market
- February 2026: Nynas AB approved a 213 MSEK investment to expand vacuum distillation capacity at its Nynashamn refinery. The project strengthens feedstock processing capability that supports naphthenic and specialty oil supply, an important lever as customers shift toward low-PAH and higher-purity process oil formulations.
- September 2025: Exxon Mobil Corporation started up its Resid Upgrade Project in Singapore using proprietary technology, increasing Group II base stock production by 20,000 barrels per day, including EHC 340 MAX. More regional Group II availability supports paraffinic process oil blending economics and improves supply optionality for Asia-Pacific and export markets.
- January 2024: Shell took a final investment decision to convert the hydrocracker at its Wesseling site within Energy and Chemicals Park Rheinland in Germany to produce Group III base oils, targeting 300,000 tonnes per year. The conversion highlights ongoing European refinery optimization toward higher-spec base oils, a shift that can reshape co-product slates and the sourcing strategy for compliant process oils in the region.


Process Oils Market Report Scope and Research Methodology
Market Definition and Coverage
For this study, the process oils market covers mineral and specialty hydrocarbon oils that are blended into rubber, polymers, and similar formulations to improve processing, softness, and final product performance, and the sizing reflects traded and consumed volumes across major industrial regions.
Scope exclusions: We do not count finished lubricants and greases sold for equipment lubrication, or crude and refinery feedstocks that are not sold as process oil grades.
Segments Covered in This Report
- By Type
- Aromatic
- Paraffinic
- Naphthenic
- By Application
- Rubber
- Polymers
- Personal Care
- Textile
- Other Applications
- By Geography
- Asia-Pacific
- China
- India
- Japan
- South Korea
- ASEAN Countries
- Rest of Asia-Pacific
- North America
- United States
- Canada
- Mexico
- Europe
- Germany
- United Kingdom
- France
- Italy
- Spain
- Russia
- Rest of Europe
- South America
- Brazil
- Argentina
- Rest of South America
- Middle-East and Africa
- Saudi Arabia
- South Africa
- Rest of Middle-East and Africa
- Asia-Pacific
Data Sources, Market Sizing, and Validation
Desk Research
Desk research starts with building the supply and demand map for process oils by grade families and by the main consuming industries. We rely on public references such as government trade statistics, customs HS code guidance notes, refinery and base oil statistical releases, and macro indicators from sources such as the World Bank and the IMF to set the background demand context.
We then cross-check direction and turning points using sources such as national statistical agencies, industry and rubber associations, peer-reviewed papers on rubber compounding and oil compatibility, and environmental or chemical regulations that affect aromatic content and PAH limits. Company annual reports, investor presentations, and press releases are used to confirm capacity additions, turnaround cycles, and portfolio shifts. We also use paid subscriptions for company financials and intelligence, patent databases, and shipment-level import and export visibility where it helps validate trade-driven markets. These examples are not exhaustive, and many other public sources were also used for data collection, validation, and clarification.
Primary Interviews and Surveys
Primary discussions were run with process oil producers, distributors, compounders, and large end users in rubber and polymer processing, so that key assumptions on grade mix, pricing spreads, and substitution behavior could be confirmed. For a global market, we ensured the respondent set covered APAC, EMEA, and the Americas, and we included both commercial and technical roles to pressure-test how demand shifts when regulations or feedstock costs move.
Distribution of primary research fieldwork respondents
| Company type | Respondent position | Region |
|---|---|---|
| Top tier: 27% | CXOs: 16% | APAC: 47% |
| Mid tier: 57% | Functional/Unit leaders: 41% | EMEA: 31% |
| Smaller Players: 16% | Managers: 43% | Americas: 22% |
Market-Sizing & Forecasting
The core model is built using a top-down approach, where refinery and base oil outputs, trade flows, and downstream rubber and polymer activity are used to reconstruct the addressable demand pool for process oils by region, and then translated into market totals. To keep the numbers realistic, we corroborate totals with selective bottom-up approximations, such as rolling up a sampled set of supplier volumes, channel checks with distributors, and an ASP times volume logic by grade family, before final adjustments are made.
Inputs used in the model include tire and general rubber goods production trends, polymer processing activity, the mix shift between aromatic, paraffinic, and naphthenic grades, typical extender oil treat rates in rubber formulations, and observed price differentials linked to viscosity and aromatic content. For forecasting, scenario analysis is used around three practical drivers: industrial output growth, regulatory tightening that changes allowable aromatic content, and feedstock swings that influence refinery economics and substitution between grades. Where country-level visibility is weaker, we use regional proxies tied to trade intensity and manufacturing output, then check those assumptions against primary conversations to keep them grounded.
Data Validation & Update Cycle
Validation is done through several passes of cross-checks so results do not rely on a single data stream. We compare model outputs against independent signals such as regional trade balances, reported refinery operating rates, and downstream rubber consumption markers, and then investigate large variances before internal sign-off.
If a major variance is detected, the team re-contacts industry participants to confirm whether it is a temporary disruption, a price timing issue, or a structural shift in grade usage. Reports are refreshed annually, and interim updates are made when material events occur, including regulation changes, refinery outages, and major capacity additions. Before delivery, a final review is completed so clients receive the latest updated view.
Mordor Intelligence's Process Oils Market Size Compared With Other Published Estimates
Published numbers for process oils often do not match because the product definition is not consistent, and because some authors use different base years and price timing. Differences also show up when one estimate is built from downstream rubber indicators and another is built from lubricant style value chains.
A common gap is whether adjacent categories are folded in, such as finished lubricants, greases, and other functional oils that are sold for equipment rather than for compounding. Some estimates also apply a single global price curve across all regions, even though grade mix and compliance needs can shift pricing. In Mordor Intelligence, those adjacent finished lubricant revenues are not counted, and the sizing is kept tied to process oil grades used in applications like rubber and polymers, with volumes anchored to the 2026 to 2031 tonnage outlook shown on the report page.
Benchmark comparison
| Source | Market Size | Gaps in Research Methodology |
|---|---|---|
| Mordor Intelligence | USD 5.33 M (2026) | |
| Global Consultancy A | USD 5.72 B (2025) | Uses a broader value-chain treatment that can mix in factory-gate revenues from finished lubricants and related services, and it also reports a different base year which shifts pricing and conversion assumptions. |
| Industry Research Group B | USD 5.00 B (2024) | Often anchors on a single base-year value with limited clarity on grade-level exclusions, and it can blend extender oils and nearby industrial oil uses, which inflates totals versus a compounding-only demand pool. |
Overall, the spread in published values is mainly explained by scope choices and year alignment, and then amplified by how pricing is applied across regions and grades. By keeping the model traceable to manufacturing demand indicators and checking it against trade and supply signals, the estimate stays repeatable and easier to reconcile when new information appears.


Key Questions Answered in the Report
What is the current size of the process oil market and its growth outlook to 2031?
The process oil market size is 5.33 million tons in 2026 and is projected to reach 6.06 million tons by 2031, reflecting a 2.61% CAGR.
Which type of process oil is growing the fastest?
Naphthenic oils are advancing at a 6.03% CAGR thanks to low-PAH chemistry and superior solvency required in EV metal-working fluids and premium tire treads.
Why is Asia-Pacific the dominant region for process oils?
Integrated Chinese and Indian refineries co-produce base and process oils at low cost, supporting tire and polymer capacity that together represent 66.06% of global demand in 2025.
Which end-use segment offers the highest growth potential?
Personal-care products, especially baby oils and dermatological ointments, are expanding at a 4.92% CAGR as brands switch to USP-grade white oils for purity and skin safety.
What competitive strategies are leading suppliers adopting?
Major players focus on feedstock integration, compliance investments, and co-development with tire, EV, and personal-care customers to secure long-term offtake and higher margins.
Page last updated on:





