Base Oil Market Size and Share
Market Overview
| Study Period | 2020 - 2031 |
|---|---|
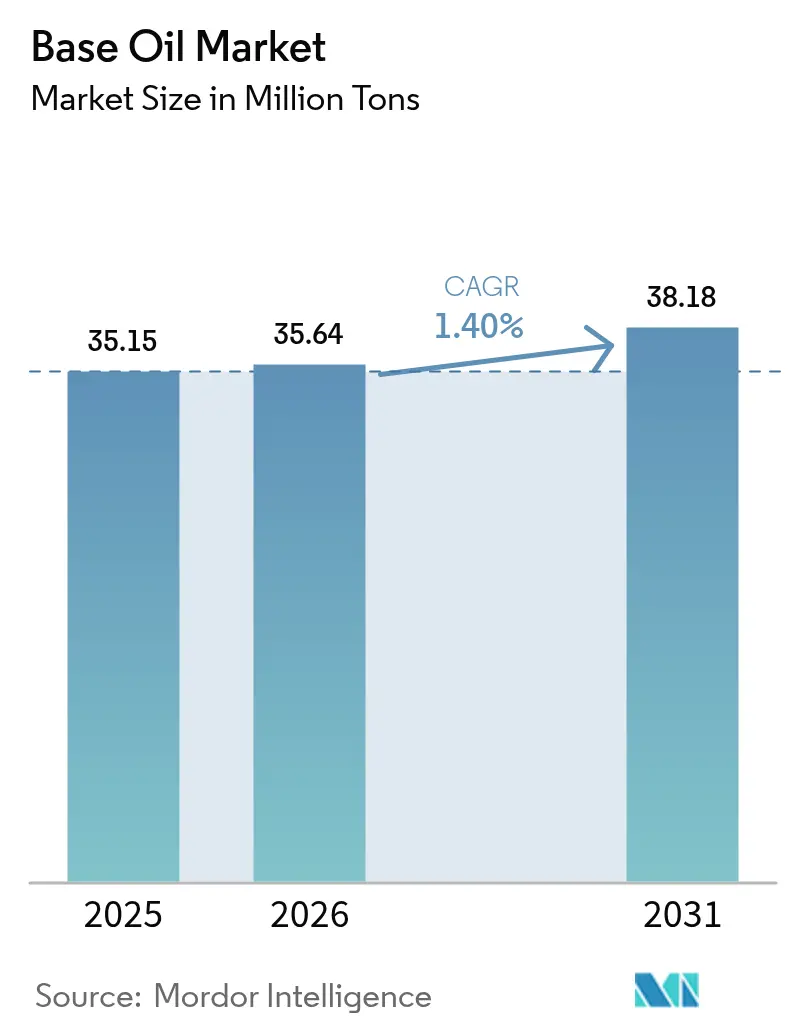
| Market Volume (2026) | 35.64 Million tons |
| Market Volume (2031) | 38.18 Million tons |
| Growth Rate (2026 - 2031) | 1.40% CAGR |
| Fastest Growing Market | Middle East and Africa |
| Largest Market | Asia Pacific |
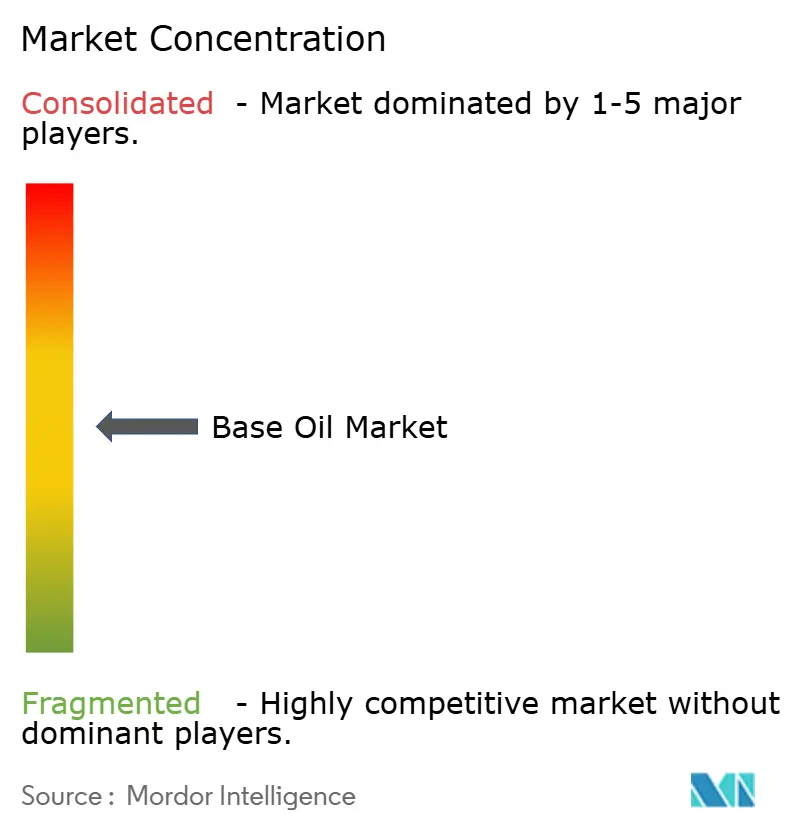
| Market Concentration | Medium |
Major Players *Disclaimer: Major Players sorted in no particular order Image © Mordor Intelligence. Reuse requires attribution under CC BY 4.0. | |
Base Oil Market Analysis by Mordor Intelligence
The Base Oil market size is expected to grow from 35.15 million tons in 2025 to 35.64 million tons in 2026 and is forecast to reach 38.18 million tons by 2031 at 1.40% CAGR over 2026-2031. The measured growth of the base oil market is underpinned by three forces: the migration from Group I to higher-performance Group II and III stocks, tightening global emission rules, and the expanding role of synthetic formulations in electric-vehicle (EV) drivetrains. Asia-Pacific commands volume leadership, yet the Middle East and Africa records the fastest expansion, signaling a gradual realignment of supply chains toward crude-advantaged regions. Competitive positioning hinges on hydroprocessing technology, while refiners confront margin pressure from compressed Brent–Dubai spreads and rising capital outlays for catalyst upgrades. Opportunities emerge in immersion-cooling fluids for data centers and closed-loop re-refining initiatives that meet circular-economy targets.
Key Report Takeaways
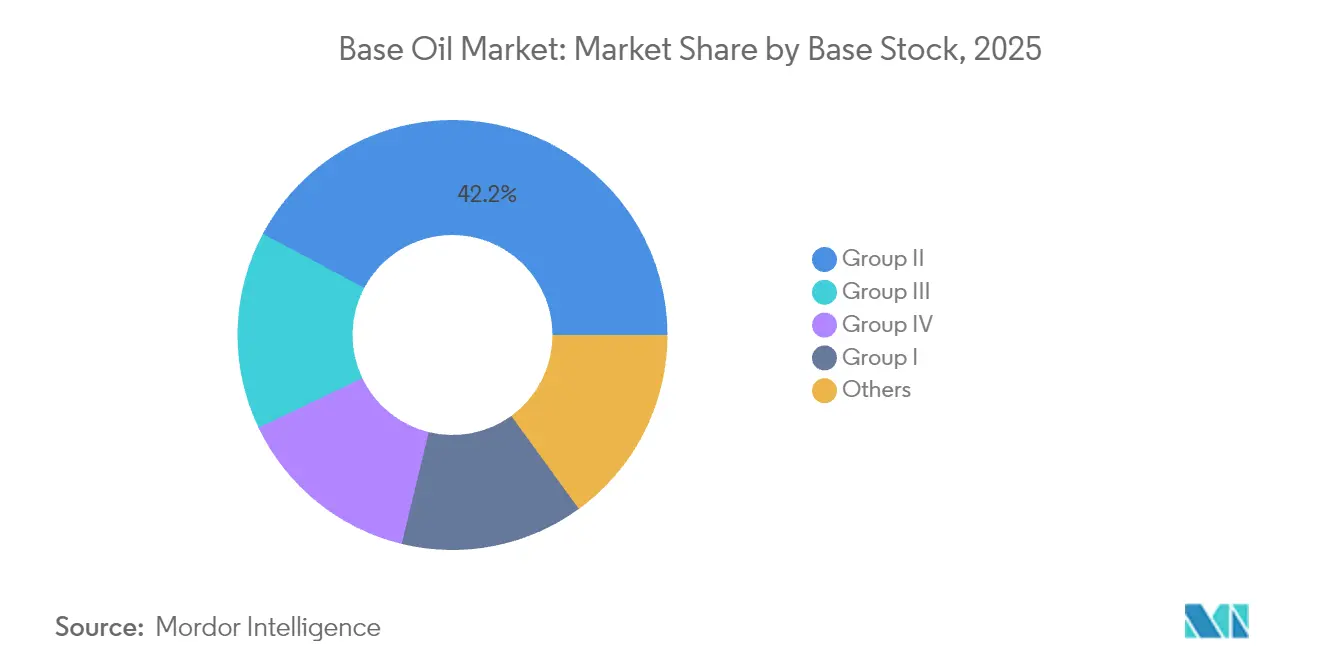
- By base-stock type, Group II held 42.20% of the base oil market share in 2025, whereas Group III posts a 4.05% CAGR through 2031, the highest among all base-stock grades.
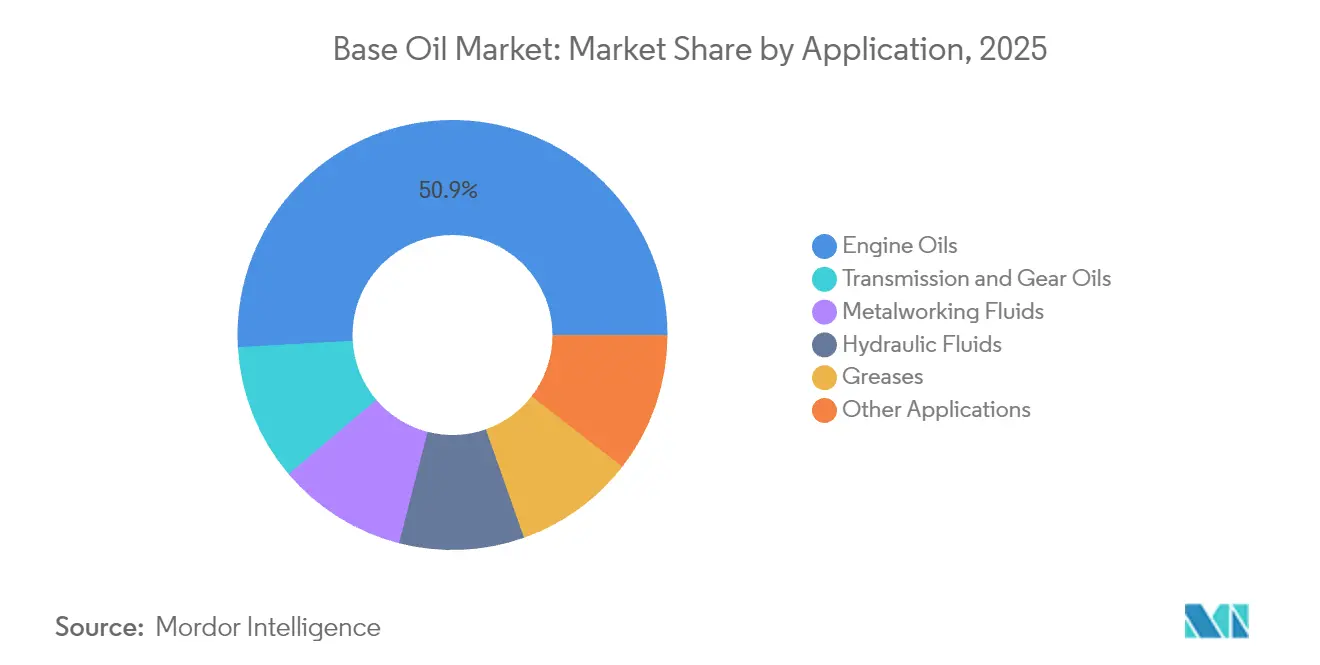
- By application, engine oils retained 50.90% of the base oil market size in 2025, while transmission and gear oils advance at a 1.63% CAGR to 2031.
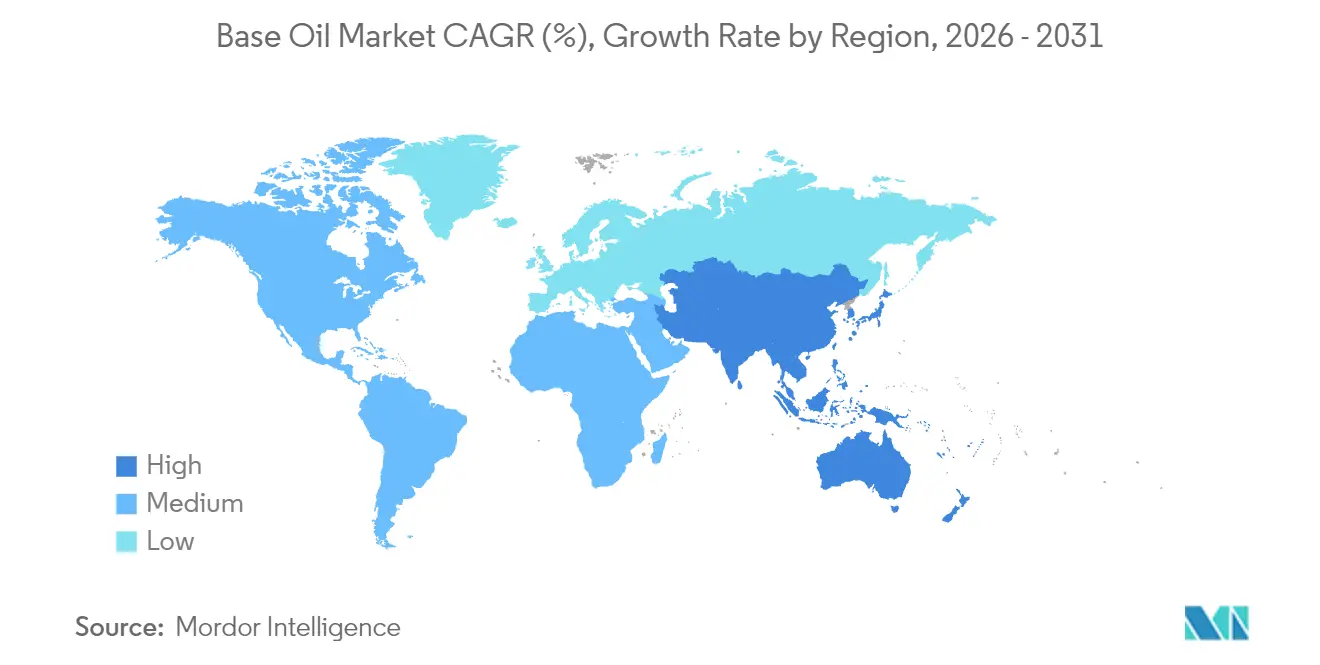
- By geography, Asia-Pacific captured 46.30% of the base oil market in 2025, but the Middle East and Africa is forecast to grow at a 3.33% CAGR between 2026-2031.
Note: Market size and forecast figures in this report are generated using Mordor Intelligence’s proprietary estimation framework, updated with the latest available data and insights as of 2026.
Global Base Oil Market Trends and Insights
Drivers Impact Analysis*
| Drivers | (~) % Impact on CAGR Forecast | Geographic Relevance | Impact Timeline |
|---|---|---|---|
| Rapid industrialisation across APAC production clusters | +0.8% | APAC core, spill-over to MEA | Medium term (2-4 years) |
| Stricter Euro 7 and China VII emission norms boosting Group III/IV demand | +0.4% | Europe and China, expanding globally | Short term (≤ 2 years) |
| Rising demand for high-performance lubricants in EV thermal-management systems | +0.2% | Global, concentrated in North America and EU | Long term (≥ 4 years) |
| Expansion of data-centre immersion-cooling fluids (novel synthetic base-stocks) | +0.1% | Global, early adoption in North America | Long term (≥ 4 years) |
| Closed-loop re-refining economics under circular-economy mandates | +0.3% | EU leading, expanding to North America | Medium term (2-4 years) |
| Source: Mordor Intelligence | |||


Rapid Industrialization Across APAC Production Clusters
Asia-Pacific’s manufacturing boom underpins a significant share of incremental base oil market demand. China processed 14.8 million barrels per day of crude in 2024, creating robust pull for metal-working and hydraulic fluids[1]U.S. Energy Information Administration, “Crude Oil Processing in China Hit a Record High in 2023,” eia.gov . An expanding network of integrated refinery-petrochemical complexes increases operational flexibility, enabling producers to shift yields toward the most profitable base-stock grades. PETRONAS projects 2 million barrels of oil-equivalent output per day in its 2025-2027 outlook, with a downstream push into specialty chemicals supported by a biorefinery startup in 2028. These investments solidify the region’s pre-eminence in the base oil market and accelerate the displacement of legacy Group I capacity.
Stricter Euro 7 and China VII Emission Norms Boosting Group III/IV Demand
The adoption of Euro 7 standards obliges automakers to fit particulate-filter systems across all light-duty gasoline engines, upping demand for ultra-low-volatility Group III stocks. China’s parallel China VII framework intensifies the requirement for low-SAPS lubricants, while forty-four refining projects approved between 2022-2026 are poised to reinforce local supply. ILSAC GF-7, effective 31 March 2025, calls for a 10% fuel-economy gain, nudging blenders toward higher-quality base oils [ORONITE.COM]. Hydrocracking and hydro-isomerization units thus attract capital, accelerating the premiumization of the base oil market.
Rising Demand for High-Performance Lubricants in EV Thermal-Management Systems
EV powertrains integrate reduction gears, bearings, and coolant channels in compact housings, requiring fluids that combine electrical insulation with superior heat transfer. Poly-alpha-olefin (PAO) blends meet these criteria by offering high viscosity indices and low pour points, and ExxonMobil is scaling metallocene PAO output at Baytown to satisfy rising orders. Copper compatibility remains a pain point; advanced additive chemistries are being formulated to mitigate corrosion and wear. Synthetic esters provide promising conductivity control but face validation hurdles in mass-production vehicles. The trend bolsters the base oil market, especially in Group IV niche grades coveted by OEMs.
Expansion of Data-Center Immersion-Cooling Fluids
Artificial-intelligence workloads propel rack densities beyond 80 kW, outpacing air-cooling limits. Shell’s single-phase dielectric oils dissipate heat 1,200 times faster than air and slash energy use by 48% in pilot sites. Hydrocarbon-based coolants outperform fluorinated peers in high-flow circuits, as indicated by ExxonMobil’s research. Demand for PFAS-free formulations dovetails with EU regulatory pressure, presenting an avenue for specialty-grade suppliers within the base oil market.
Restraints Impact Analysis*
| Restraints | (~) % Impact on CAGR Forecast | Geographic Relevance | Impact Timeline |
|---|---|---|---|
| Rapid substitution away from Group I capacities | -0.3% | Global, concentrated in North America and EU | Short term (≤ 2 years) |
| Volatile Brent–Dubai crude differentials squeezing margins | -0.2% | Global refining centers | Short term (≤ 2 years) |
| Impending micro-plastic classification of PAOs in the EU (ECHA) | -0.1% | EU, potential global spillover | Medium term (2-4 years) |
| Source: Mordor Intelligence | |||
Volatile Brent–Dubai Crude Differentials Squeezing Margins
The Brent–Dubai spread turned negative at times in 2024, signaling scarce medium-sour barrels crucial for VGO-based base-oil feed. New Kuwait, Oman, and Nigeria refineries lifted global capacity, depressing margins and driving some operators, such as LyondellBasell Houston, to exit refining by early 2025. The crunch pressures independent players in the base oil market to trim runs or shutter older assets.
Impending Micro-Plastic Classification of PAOs in the EU
ECHA’s draft restricts synthetic polymer microparticles above 0.01 wt%, potentially sweeping PAOs into stringent control regimes by 2027. Roughly one-third of PFAS use in lubricants resides in base oils, raising reformulation costs and supply-chain complexity. Producers now weigh ester or renewable alternatives, yet performance parity remains elusive.
*Our forecasts treat driver/restraint impacts as directional, not additive. The impact forecasts reflect baseline growth, mix effects, and variable interactions.
Segment Analysis
By Base-Stock Type: Group III Drives Premium Transformation
Group II maintained leadership with 42.20% of the base oil market share in 2025, owing to its balanced performance-cost equation and established distribution networks. Shell’s 300,000-ton conversion at Wesseling underscores sustained confidence in hydrocracked stocks. Group III, though smaller on an absolute basis, advances at a 4.05% CAGR to 2031, buoyed by Euro 7 and EV-cooling mandates that call for ultra-low volatility and high oxidation resistance. The base oil market size for Group III is thus poised to expand faster than any other grade during the forecast horizon.
Group I endures in select rubber-processing and metal-working fluids requiring solvency, yet closures continue as economics deteriorate. Group V’s diverse chemistries, including secondary polyol esters for bio-lubricants, round out innovation pathways. Altogether, the base oil market is migrating toward higher API groups to meet stricter OEM specifications and sustainability goals.


By Application: Engine Oils Dominate Amid EV Transition
Engine oils accounted for 50.90% of the base oil market size in 2025 as global vehicle parc growth offset modest ICE share erosion. ILSAC GF-7 tightens viscosity targets, pushing formulators into Group III space to secure 10% fuel-economy gains. Transmission and gear oils post the fastest 1.63% CAGR through 2031 as multi-speed automatic gearboxes and EV integrated drivetrains demand higher thermal-fluid performance. The base oil market experiences steady lubricant diversification as formulations evolve to provide electrical insulation alongside shear stability.
Metal-working fluids gain steady traction from APAC manufacturing, with vegetable-oil alternatives incrementally displacing mineral oils on biodegradability grounds. Hydraulic fluid re-specification away from PFAS adds research and development overhead, yet stimulates new ester- and PAO-based blends. Greases remain a stable volume sink, while immersion-cooling and other niche uses contribute incremental demand. These shifts illustrate how the base oil industry adapts core applications to new technological realities.
Geography Analysis
Asia-Pacific generated 46.30% of 2025 volume, underpinned by China’s record 14.8 million barrels-per-day crude runs and India’s INR 1.9-2.2 lakh crore expansion program slated for completion by 2025. The base oil market benefits from vertically integrated complexes able to toggle between fuels, chemicals, and base stocks as margins dictate. Japan and South Korea supply precision synthetic technology for electronics thermal management, while Southeast Asian nations add capacity to serve regional industrial demand.
The Middle East and Africa posts a 3.33% CAGR to 2031, the fastest globally. ADNOC’s USD 3.5 billion Ruwais Crude Flexibility Project enables processing heavier sour crudes, optimizing Group II and III output. Europe contends with margin compression and decarbonization pivots such as TotalEnergies’ Grandpuits conversion into a zero-crude platform by 2026.
North America, bolstered by shale-oil economics, invests in specialty PAO and Group III projects; Chevron’s Pasadena upgrade lifts throughput to 125,000 barrels per day while raising jet-fuel flexibility. South America enjoys moderate upside from Brazil’s petrochemical integration, although macro volatility dampens large-scale investments. Collectively, geographic dynamics reflect a gradual diffusion of capacity into crude-advantaged and demand-rich locales while traditional centers adapt through specialization.
Mordor Intelligence provides coverage of the base oil market across other key regional markets, including Asia, each with their regulatory frameworks and demand patterns.

Value Chain Analysis
The base oil value chain starts with feedstock sourcing, vacuum gas oil and slack wax, and extends through refinery base-oil units, solvent extraction for legacy Group I, and hydrocracking and hydro-isomerization for Group II and III. Storage and bulk logistics then feed into lubricant additive blending, finished-lubricant manufacturing, and distribution to automotive, industrial, marine, and specialty end users. In parallel, the circular stream links used-oil collection, aggregation, and re-refining back into Group II and III grade supply, with operational focus building in 2026 through initiatives including HPCL and Castrol India evaluating a re-refined base oil ecosystem in India, and Aster Chemicals and Energy with Puraglobe exploring a re-refined base oil processing facility in Singapore.
Key bottlenecks sit at the interface of refinery economics and logistics. VGO competes directly with diesel production when middle-distillate margins rise, tightening base-oil availability even when plants run reliably. In 2026, disruptions tied to the Persian Gulf and the Strait of Hormuz highlighted exposure to long-haul routes for premium Group III cargoes, which increased the value of regional hubs and secured offtake, illustrated by Apar Industries Middle East signing a base-oil supply agreement with Saudi Aramco Base Oil Company (Luberef) for the Yanbu LubeHUB value park. These dynamics reinforce the role of integrated refiners, long-term contracts, and localized re-refining networks in reducing supply variability for blenders and OEM-aligned lubricant programs.
Competitive Landscape
The base oil market displays moderate fragmentation. ExxonMobil, Shell, Chevron, and TotalEnergies jointly hold a commanding share based on integrated refining scale. ExxonMobil’s 20,000-barrel-per-day Singapore Resid Upgrade exemplifies the shift toward higher-value Group II/III yields. Regulation shapes competition as well. EU circular-economy mandates lift the attractiveness of re-refined Group II products, enticing European independents to retrofit hydro-treaters. Simultaneously, possible PAO micro-plastic classification may tip OEM approvals toward ester or glycol-based options, catalyzing portfolio diversification. Strategic repositioning revolves around premium grades, sustainability compliance, and specialty niches that command differentiated margins.
Base Oil Industry Leaders
Exxon Mobil Corporation
Chevron Corporation
Shell plc
TotalEnergies
Saudi Arabian Oil Co.
- *Disclaimer: Major Players sorted in no particular order

Market Opportunities and Future Outlook
Premiumization and resilience create whitespace where higher-spec base stocks and localized supply systems address tighter lubricant specifications and recurring logistics shocks. Capacity and investment signals in 2026 include Luberef targeting H2 2026 completion of the Yanbu base oils expansion to lift total capacity to 1.53 million tonnes per year, and Vertex Energy announcing an expansion at Mobile, Alabama to add 6,000 bpd of conventional Group III capacity (targeted for 2029). These moves reflect the market shift away from Group I and toward Group II and III (and specialty synthetics) needed for low-volatility, low-SAPS lubricants, as well as newer drivetrain and thermal-management fluid requirements.
Circular-economy aligned supply is also becoming a strategic lever, since re-refining reduces dependence on virgin feedstock and long-haul imports. In 2026, HPCL and Castrol India moved to evaluate a re-refined base oil ecosystem in India, while Aster and Puraglobe advanced work on a Singapore re-refining concept aimed at producing Group II/III/III+ from used motor oil. Alongside these supply-side shifts, the intensity of the spring 2026 lubricant pricing cycle, multiple pricing actions across many companies within a short window, reinforces how supply constraints can transmit quickly into finished-lube markets. That supports opportunities for producers that can secure feedstock, lock in offtake, and differentiate with OEM-aligned formulations, including EV-oriented product lines.
Recent Industry Developments
- June 2026: Vertex Energy announced an expansion project at its Mobile, Alabama refinery to add 6,000 barrels per day of conventional Group III base oil capacity, with operations targeted for 2029. The project strengthens North American Group III supply options and supports blenders seeking more local sourcing amid import volatility.
- June 2026: Apar Industries said its wholly owned subsidiary, Apar Industries Middle East Limited, signed a base oil supply agreement with Saudi Aramco Base Oil Company (Luberef) tied to the Yanbu LubeHUB lubricants value park in Saudi Arabia. The agreement improves feedstock security for specialty oil production and reflects the increasing role of long-term supply arrangements in stabilizing the lubricants value chain.
- December 2024: Hindustan Petroleum Corporation Limited (HPCL) earmarked INR 46.79 billion (USD 551 million) to expand lube-oil base-stock output at its Mumbai refinery by 289,000 tons per year, a 61% uplift. The expansion supports domestic supply availability and helps reduce reliance on imports for higher-quality base stocks.


Research Methodology Framework and Report Scope
Market Definition and Coverage
For this study, the base oil market covers API base stocks sold for formulating finished lubricants, measured on a volume basis where products are traded as base stocks and then blended into end-use lubricants.
Scope exclusions: Additives, finished lubricant packaging and distribution margins, and crude fuels are excluded from this sizing unless they are explicitly traded as base oil base stocks.
Segmentation Overview
- By Base-Stock Type
- Group I
- Group II
- Group III
- Group IV
- Others
- By Application
- Engine Oils
- Transmission and Gear Oils
- Metalworking Fluids
- Hydraulic Fluids
- Greases
- Other Applications
- By Geography
- Asia-Pacific
- China
- India
- Japan
- South Korea
- Malaysia
- Indonesia
- Vietnam
- Thailand
- Rest of Asia-Pacific
- North America
- United States
- Canada
- Mexico
- Europe
- Germany
- United Kingdom
- France
- Italy
- Spain
- Nordic Countries
- Turkey
- Russia
- Rest of Europe
- South America
- Brazil
- Argentina
- Colombia
- Rest of South America
- Middle-East and Africa
- Saudi Arabia
- United Arab Emirates
- Qatar
- Egypt
- South Africa
- Nigeria
- Rest of Middle-East and Africa
- Asia-Pacific
Data Sources, Market Sizing, and Validation
Desk Research
Desk research was used to build the starting structure of supply, demand, and trade, then to sanity-check the model outputs against known refinery and trading patterns. We relied on public sources such as energy statistics from agencies like the IEA and EIA, refinery and base oil capacity notes from sources like the USGS, and trade flows from UN Comtrade and national customs releases.
To avoid mixing base oils with finished lubricants, we also reviewed technical definitions and product group notes from standards bodies and peer-reviewed tribology and lubricant journals, along with trade association publications and port and shipping updates. Company annual reports, investor presentations, and reputable industry press helped us track capacity changes, turnarounds, and regional balancing. In a few cases, paid subscriptions for company financials and patent databases were used to cross-check investment timing and technology direction. These examples are not exhaustive, and we also used other public references for data collection, validation, and clarification.
Primary Interviews and Surveys
Primary work focused on validating conversion factors and tradeoffs that desk sources typically do not spell out, such as how much Group I demand is being replaced by Group II and Group III in key lubricant applications. We spoke with a mix of base oil producers, lubricant blenders, distributors, and procurement and technical roles across major consuming regions, so assumptions could be checked against what is being bought and blended in practice.
Distribution of primary research fieldwork respondents
| Company type | Respondent position | Region |
|---|---|---|
| Top tier: 30% | CXOs: 14% | APAC: 43% |
| Mid tier: 55% | Functional/Unit leaders: 32% | EMEA: 34% |
| Smaller Players: 15% | Managers: 54% | Americas: 23% |
Market-Sizing & Forecasting
Sizing is built with a top-down approach where refinery base oil capacity and operating rates, adjusted by regional trade balances, are used to reconstruct the effective supply available for lubricant blending. Once the supply pool was set, it was translated into market volumes by aligning it with application demand signals and inventory behavior that were repeatedly mentioned in interviews.
To keep the model realistic, we cross-checked results using selective bottom-up approximations, such as sampled supplier volume disclosures, distributor channel checks, and typical consumption splits by application that are described in public technical literature. Inputs that mattered most included base stock migration rates (Group I to Group II and Group III), key turnaround and new unit start-up timing, import and export direction by region, shifts in automotive and industrial lubricant demand, and observed substitution into synthetic and Group IV uses where relevant. Forecasts leaned on scenario analysis supported by expert consensus, because regulation-driven specification changes and capacity additions do not always follow smooth time series patterns. Where local data was thin, gaps were handled by using nearby trade-linked benchmarks, then rechecking the implied per-capita lubricant consumption for reasonableness.
Data Validation & Update Cycle
Outputs were validated by comparing modeled volumes with independent signals such as announced capacity, regional trade totals, and application-level lubricant demand indicators, then investigating any large variances. If a number looked out of place, we revisited the underlying assumptions, rechecked unit conversions, and, when needed, re-contacted industry participants to clarify the point.
Before sign-off, the model and narrative are reviewed in multiple steps so the logic and totals stay consistent across regions and time periods. Reports are refreshed annually, and interim updates are made when material events occur, such as major plant outages, new capacity, or policy shifts affecting lubricant specifications. Right before delivery, a final analyst pass is completed so clients receive the most current view available.
Mordor Intelligence's Base Oil Market Estimate Compared With Other Published Estimates
Published market sizes for base oil often look far apart because the underlying units and scope are not always aligned, which creates confusion for buyers. The largest differences usually come from whether the number represents base stock volume, a value estimate, or a wider lubricants-related basket that is being labeled as base oil.
Another driver is the conversion logic used between tons and dollars, since ASPs vary by group and by region and can move with crude and refinery margins. This means one set of price assumptions can shift the total materially. Some estimates also include finished lubricant value, distribution markups, or specialty fluids, while others use longer forecast periods with more aggressive capacity utilization and demand growth assumptions, which can lift the starting year as well.
Benchmark comparison
| Source | Market Size | Gaps in Research Methodology |
|---|---|---|
| Mordor Intelligence | USD 35.15 M (2025) | |
| Global Consultancy A | USD 44.20 B (2025) | Reported as a value market in USD, which can include a different pricing stack and may reflect blended ASP assumptions across groups and regions rather than a pure volume base stock pool. |
| Industry Publisher B | USD 34.00 B (2024) | Uses a value-based base year and a longer forecast window, and the disclosed scope suggests broader segmentation lenses that can shift what is counted as base oil versus lubricants-related value. |
The table shows that the spread is mainly explained by unit choice and what is being priced, not just by different growth views. When the market is sized as a base stock volume pool tied to capacity, utilization, and net trade, and then kept separate from finished lubricant value, the figure stays traceable to supply and demand checks, which is the approach followed here and reflected in the estimate from Mordor Intelligence.


Key Questions Answered in the Report
What volume will global base-oil demand reach by 2031?
The base oil market is forecast to reach 38.18 million tons in 2031, rising at a 1.40% CAGR from 2026.
Which base-stock grade is expanding the fastest?
Group III posts the quickest growth at 4.05% CAGR, propelled by Euro 7 and EV heat-management requirements.
Why are refiners shutting Group I units?
Superior Group II economics, tighter emission norms, and declining marine-oil demand have undermined Group I profitability.
Which region registers the highest growth to 2031?
The Middle East and Africa leads with a projected 3.33% CAGR, buoyed by ADNOC and other downstream expansions.
How do circular-economy mandates influence supply?
EU targets of 70-85% waste-oil regeneration by 2031 are stimulating investment in hydroprocessed re-refineries, adding low-carbon Group II supply.
Page last updated on:


